The integration of GIS and decision support software promotes collaborative GIS, focuses problem solving efforts, and establishes and maintains an alignment between personal and group goals.
The intent of this paper is to describe a system that integrates GIS (Esri's ArcView2) and decision support software (Ventana's GroupSystems for Windows) to promote collaborative GIS techniques. The group interaction is accomplished by utilizing a portable system of laptop computers on a local area network. Possible topics to be addressed with this system are: land use, economic incentives, pollution, technological development, and environmental regulations. Meeting participants construct various geographic scenarios which are collected, combined, discussed, and prioritized. Decision rationale for final recommendations are recorded automatically and linked to the original geographic data sets. Connected as a team, people rapidly share information through electronic dialogues anonymously contributing ideas without fear of criticism. ArcView2 allows for the visualization of these geographically oriented discussions. This integration of GIS and decision support software can greatly reduce meeting time by structuring and focusing problem solving efforts and establishing and maintaining an alignment between personal and group goals. An example application of the system is described.
       BACKGROUND

       This GIS and decision support application is being jointly developed by

       International Business Machines Corporation (IBM), Terrestrial

       Ecosystems Regional Research and Analysis Laboratory (TERRA), and

       Environmental Systems Research Institute (Esri).   Group interaction is

       accomplished through facilitated sessions with a portable system of laptop

       computers on a local area network that can be utilized in almost any setting

       for half day to multi-day sessions.  This will be a spatial decision support

       system for multi-objectives.  Specific Forest Service interests could

       include: harvesting, habitat protection, sedimentation limit in a watershed,

       viewshed limitations, and limits on activities in certain areas.  The group

       data-sharing tools allow a number of people to access the same base of

       information with minimal technical skills.  (A facilitator guides the

       participants through the tasks necessary to achieve the goals of the

       meeting.)  Spatial decisions can be reactive, proactive, and/or interactive.

       Adding decision support to the GIS allows for the necessary mixture of

       quantitative and qualitative criteria for multi-objective analysis..


       Ventana's GroupSystems for Windows is an electronic meeting support

       software system comprised of a collection of tools that support group

       processes including: brainstorming, list building, voting, organizing,

       prioritizing and consensus building.  A meeting facilitator controls the

       software enabling the group to generate, organize, and evaluate ideas.  A

       video display device and printer can be connected to the facilitator's

       computer to display results to the group.  Electronic meeting support

       software can save time by allowing participants to contribute

       simultaneously.  Participant comments can be gathered in multiple ways:

       limited or unlimited number of comments, one line of text, small block of

       text, or unlimited lines per comment.  Anonymity encourages creative idea

       generation and ideas are evaluated on merit and not source.  Through

       GroupSystems, the complete record of discussions is automatically

       documented.


       ArcView2 allows participants to visualize, explore, query, and analyze the

       data spatially.  Participants can select features according to their attributes

       or based on their proximity to other features.  Places where certain features

       coincide can also be selected.  ArcView2, customized with Avenue scripts,

       will allow meeting participants to construct various geographic scenarios

       or proposals which can then be collected, combined, discussed, and

       prioritized.  Decision rationale for final recommendations are recorded

       automatically and linked to the original geographic data sets.  This

       customized ArcView2 incorporates group interaction with geographic

       data.   Connected as a team, people rapidly share information through

       electronic dialogues anonymously contributing ideas without fear of

       criticism.  Overbearing and dominant personalities cannot drown out less

       aggressive participants.  The initial version of this GIS decision support

       application, the Active Response GIS (AR/GIS), combined IDRISI GIS

       software with Ventana's GroupSystems for DOS.  The AR/GIS application

       displayed updated polygon boundaries, attributes, and supportive text while

       users altered or reversed an emerging solution.  This initial version was

       utilized by Arapaho-Roosevelt National Forest personnel  to explore

       district priorities, review public comment, and develop alternatives to

       management prescriptions as part of their Management Plan Revision

       Process.


       The  integration of GIS and decision support software can greatly reduce

       meeting time by structuring and focusing problem solving efforts,

       establishing and maintaining an alignment between personal and group

       goals, and promoting joint intellectual efforts.


       PROCESS


       The meeting initiator, i.e. Senior City Planner, EPA Site Manager, or

       Forest Service Manager, determines the topic and goals of the meeting, and

       the participants, i.e. land use planners, public officials, and affected parties.

       In addition, the meeting initiator and/or staff  identify the information

       needed to develop the desired meeting results.


       The meeting facilitator and/or technographer are supplied with the digital

       data and other necessary information.  The digital data is processed by or

       for the facilitator/technographer, according to group needs, using ArcInfo

       and ArcView2. This preprocessing could greatly reduce the time required

       to refresh the computer screen view of the data by selecting only the

       needed coverages and attributes for the decision at hand.  (Examples: clip

       data to focus on a specific area, utilize union, intersect or identity

       commands to combine coverages, and/or generate a fishnet to chunk data

       into smaller pieces for changing parts of data specific polygons.)


       Specific areas or attributes that would remain constant (i.e. soil types and

       protected areas) would be identified and therefore not be available for

       change but would be available for consideration during decision process.

       (No write access to these files or revert back to original parameters after an

       inadvertent change.)


       An ArcView2 project skeleton of  themes, views, tables, scripts, charts,

       and a layout, if a map is desired, are developed by or for the facilitator and

       technographer.  (If Unix and ArcInfo are utilized for this development

       rather than PC ARC/INFO, then hard coded paths in Avenue scripts would

       need to be changed.)

       a. Text tool could be used to clarify views by adding titles and annotations.

       b. Variable scales could be viewed and a scale-dependent display of themes

       developed.  (A range of scales would be defined for the drawing of each

       theme in a view such that when zoomed out to smaller scales, certain

       themes would not be drawn and clutter up your view.  Example

       neighborhood roads would not be drawn on state-wide view.)

       c. Hiding some theme legends and only showing a few at first could help

       keep participants from becoming overwhelmed.

       d. Grouping buttons and tools and simplifying GUI to only show a subset

       of available interfaces could expedite participants development of

       scenarios.

       e. Maintain a copy of project on floppy or in a limited access directory on

       the facilitators laptop for ease of replacing corrupted data during session.


       Determine tentative flow of meeting and GroupSystems tools to be

       utilized.  Collaborative group processes include idea generation,

       organization, evaluation, analysis and issue exploration.  Once the general

       process for accomplishing the meeting goal is identified, specific tools can

       be selected.  Certain tools are able to support more than one task.  Each

       group will have specific needs and unique characteristics, and

       understanding these will enable you to choose the most effective tools for a

       particular session.

       Example:

       Generate a list of criteria for determining solution - Categorizer tool

       Prioritize the list - Voting tool

       Quantify group consensus - Opinion Meter tool

       Generate ideas about the causes and affects - Electronic Brainstorming tool

       Organize solutions into categories such as short term, mid term, and long

       term solutions - Categorizer tool with reference file.

       Evaluate solutions against a set of criteria - Group Outliner tool

       (Group Outline functions much like the Topic Commenter tool in which

       participants enter comments about topics on a list.  Unlike topic

       commenter, each Group Outliner topic can have subtopics arranged in the

       hierarchical structure of an outline.  Therefore, the idea generation process

       is more structured than that of either Electronic Brainstorming or topic

       commenter.)


       Data can easily be shifted from one activity or tool to another so that, for

       instance,  a categorizer list could be voted on.
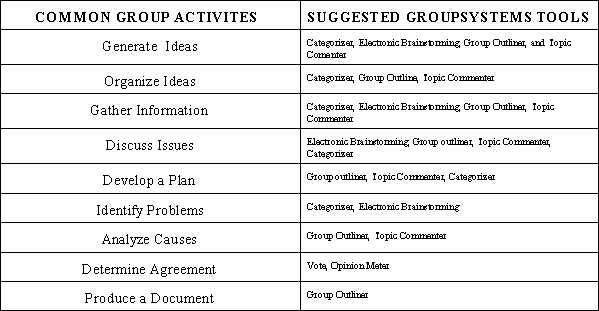
       *Tool Definitions are  located in Appendix A


       Next, the GIS decision support session will provide a dynamic means to

       make suggestions, establish priorities,  resolve inconsistencies between

       proposals, integrate differences in approaches, and work out compromises.

       a. At the beginning of a session, facilitator covers the entire tentative

       agenda explaining the purpose of each segment.

       b. Decision makers participate in interactive exploration of data.

       Participants/decision makers are able to review data and customize their

       view of the data by zooming into particular regions, highlighting areas of

       interest, adding basemap features for orientation to roads, streams and

       landmarks, and by querying the data.  (Other avenues of exploration are

       also available)

       c. Individuals prepare geographic proposals on their laptops and these are

       echoed on the facilitators PC and/or on a whiteboard.  (If participants are

       more comfortable drawing on a whiteboard and anonymity is not an issue,

       then facilitator could translate drawings into digital format.)

       d. Facilitator aggregates results and explains where participants have been

       and where they are going.  Weighted items might be adjusted to reflect

       changes in priority or conditions.

       e. Consensus or agreement building with numerous iterations.  Discussion

       of proposals/scenarios using decision support software and prioritization of

       plans using voting tools.

       f. Voting focuses key items for discussion and rapidly surfaces differences

       of opinion.  (Voting methods include utilizing a 10 point scale,

       agree/disagree, and customized possibilities.)

       g. Create statistics of results and/or charts and a map if needed.  A variety

       of statistics and charts can be generated including group consensus

       statistics, pie charts, and histograms.

       h. Maintain justification comments in table attached to geographic data

       i. Compare original data with final modified data and goals of session.


       SUMMARY

       1. System operates within a Windows environment but can be ported to X-

       windows.

       2. It has a user interface that is easy to understand and allows for

       exploration of alternative solutions.

       3. Laptop computers have become much more powerful in the past few

       years so visualization of map-based display alternative solutions has been

       expedited.

       4. System is capable of generating and displaying different management

       schemes that maintain spatial and temporal constraints, while achieving

       scenario based goals.

       5. It has the ability to track and view forest attributes past, present, and

       future within data limitations.  These futuristic models could enhance and

       clarify goals related to harvesting, revenue, habitat protection, etc.

       6. Process allows for tremendous flexibility in modeling and significant

       interaction on the part of the decision makers.

       7. Generation of trade-offs between competing considerations and then

       group consensus of prioritization can be accomplished.  Example:  A model

       to meet harvesting goals and another model utilized to optimize activities in

       conflict with harvesting.  Harvesting might be given a low enough weight

       such that it would only be accomplished when it helped to meet specific

       conditions to produce desired future goals.

       8. Hierarchical decision making is an iterative process with multiple levels

       of decision making involved in order to flow from broad scale management

       goals for very large regions down to the finer details required for specific

       operational schemes for individual tracts of land.  Each inter-related level

       requires more precision of detail as the geographic scale becomes larger.

       This is analogous to a mathematical procedure to produce a desired result

       by replication of a series of operations that successively better approximate

       the desired result.


       APPENDIX A: GroupSystems Tool Definitions


       CATEGORIZER

       List building format: each participant enters ideas related to the task being

       considered by the group.  These ideas are added directly to the group or

       public list.  After the list is complete, it can be edited and information

       merged to consolidate similar ideas and create a more manageable list.


       Categorizing mode: participants can create categories from a list which

       they built and then copy ideas to the appropriate categories.  Ideas can also

       be copied  or moved from one category to another.


       ELECTRONIC BRAINSTORMING

       An issue is presented to the participants and each receives the electronic

       equivalent of  a sheet of paper.  After entering an idea, the discussion sheet

       is exchanged for another.  The next discussion sheet displays an idea or

       ideas entered by one or more other participants.  These ideas can be

       commented on or a new line of thought can be entered.  Each discussion

       sheet gathers an assortment of ideas which can spark other responses.


       GROUP OUTLINER

       Allows participants to generate and organize ideas using an outline

       structure.  The tool supports numerous categories and up to seven

       subordinate levels.


       OPINION METER

       Provides a fast and informal means of measuring the opinion of the group.

       Three voting methods are offered: Yes/No, Agree/Disagree, and 10-Point

       Scale.


       TOPIC COMMENTER

       Each participant is given the electronic equivalent of a set of lined sheets of

       paper labeled with topics which they can comment on in any order they

       choose.  The topics can be entered or imported prior to starting

       participants.


       VOTE

       Enter a list of ballot items, or shift a list from another tool, and select a

       voting method. Participants enter their choices according to the type of

       vote that has been chosen.  When the ballots are collected, statistical

       information is automatically generated.  Results are displayed in text

       reports, graphs, and voting matrices.  Group consensus can be determined.


       END NOTE

       The 191 million acres of National Forest Land covers an area that is just

       slightly larger that half the size of Alaska and about 30,000 more square

       miles than the area of Texas.  In addition to this there are 480 million acres

       of forests and watershed belonging to state and local governments and

       private owners.  Forest ecosystem planning is possible and can be

       expedited to protect habitat, ensure the survival of endangered species,

       promote biological diversity, provide recreation, and balance

       aforementioned concerns with the ever present demand for timber and the

       jobs it creates.  In order to achieve this there is a need to understand forest

       ecosystems, public input, and industry needs.  The combination of GIS and

       decision support software can help land managers, the public, and industry

       to understand each others' concerns by airing political, economic,

       emotional, and environmental concerns in a controlled, moderated setting.

       While computers manage the large amounts of information, potential

       stakeholders are free to concentrate on the collaborative debate and

       conflict resolution.


       REFERENCES

       Baker,Tony and Peter MacDonald (1994).  "Blackboard Systems: A New

       Approach to Collaborative Resource Management Planning", Proceedings

       of the GIS '94 Symposium. Vancouver, B.C..


       Church, Richard L., Alan T. Murray, and Michael A. Figueroa (1994).

       "Designing a Spatial Decision Support system for Forest Ecosystem

       Management", Proceedings of the GIS '94 Symposium.  Vancouver, B.C.


       Davis, Norah Deakin (1995).  "The Elusive Ecosystem",  Nature

       Conservancy, Volume 45, Number 2, March/April 1995.  Arlington,

       Virginia.


       Faber, B., R. Watts, J. Hautaluoma, J. Knutson, W. Wallace, and L.

       Wallace (1994).  "A Groupware-Enabled GIS", Proceedings of the GIS '94

       Symposium.  Vancouver, B.C..


       Nunamaker, Jay F. and Robert O. Briggs (1993).  "GroupWare User

       Experience: Ten Years of Lessons with GroupSystems", Center for the

       Management of Information, University of Arizona.  Tucson, Arizona.


       Strapp, James D. (1994).  "Decision Support For Land privatization in the

       Czech Republic", Proceedings of the GIS '94 Symposium.  Vancouver,

       B.C..


       Ventana Corporation (1994).  Ventana GroupSystems for Windows

       Reference Manual.  Tuscon, Arizona.