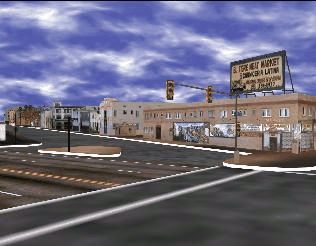
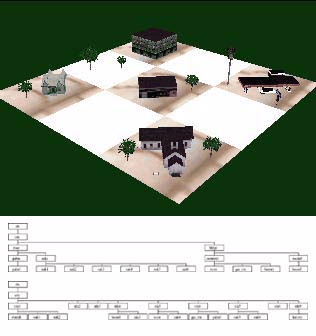
figure 1. Street view of Pico Union neighborhood model
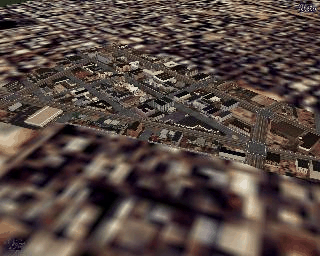
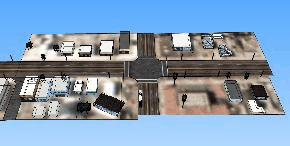
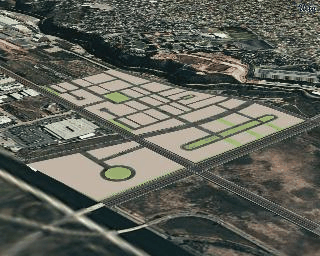
figure 2. Aerial view of Pico Union model
Robin Liggett, Scott Friedman, and William Jepson
Researchers at UCLA have developed an Urban Simulator which links virtual reality technology with traditional two-dimensional Geographic Information Systems (GIS) and databases. This paper discusses the data structure and interface requirements necessary to integrate a real-time three-dimensional visual simulation system with a GIS system. Potential uses of the integrated system are illustrated with a set of current projects in the Los Angeles area.
Drawing on technologies developed for virtual reality and military flight simulation, researchers at UCLA's Departments of Architecture and Urban Planning have created a computing environment designed for real-time urban simulation [Liggett et al, 1993, 1995; Friedman, 1994]. This environment integrates existing systems such as Computer Aided Design (CAD) and Geographic Information Systems (GIS) with virtual reality to facilitate the modeling, display and evaluation of existing and proposed physical environments.
The core component of the UCLA Urban Simulator is a visualization system which provides high quality photo-realistic simulations of selected communities and neighborhoods. With this system, aerial photographs can be combined with street level video to efficiently create a realistic (down to plants, street signs and the graffiti on the walls) computer model of an urban neighborhood which can then be used for interactive fly and walk-through demonstrations. Figures 1 and 2, for example, show street level and aerial views of a model representing a portion of the Pico Union neighborhood in Los Angeles. This model is part of a project intended to provide a community-based planning and communications tool to aid in the redevelopment of the area, which is considered by many to be the most distressed community in Los Angeles.

figure 1. Street view of Pico Union neighborhood model

figure 2. Aerial view of Pico Union model
While visual simulation is proving to be a useful tool for viewing neighborhoods as they currently exist or as they might appear after built intervention occurs, it can also be an effective interactive planning, design and evaluation tool when linked dynamically to a GIS system. In the Urban Simulator's integrated environment, links have been established between the visual simulation module and Environmental Systems Research Institute's (Esri) ArcView2. This provides the capability for dynamic query and display of information from a GIS database in a real-time 3-dimensional format. A user can dynamically access a GIS database from the visual simulation window by selecting an object in the 3-dimensional environment as he/she is navigating the urban neighborhood. This will highlight 2-dimensional maps and tables in the GIS window. Alternatively, a query can originate in a traditional manner from the GIS side with results displayed by highlighting objects in the simulation window.
This paper focuses on the interaction between the visual simulation and a GIS system. An overview of the system components is presented, followed by a discussion of the data structure and interface requirements which facilitate real-time communication in the integrated environment. A description of current UCLA projects in the Los Angeles area is included. These projects illustrate how the integration of visual simulation and GIS aids the interactive design and decision process.
Work at UCLA has focused on developing a user interface for viewing and interacting with a 3-dimensional environment which has been designed specifically to meet the needs of the planning and design professions. This interface and simulation software runs on a four processor Silicon Graphics Onyx workstation with Reality Engine graphics hardware allowing extensive use of real-time texture mapping. The simulation software was developed using Silicon Graphic's IRIS Performer application development environment [Silicon Graphics, 1994].
The simulation interface includes fly/drive controls so that the user can travel anywhere and view any part of the model. Dynamic objects (such as moving vehicles or pedestrians) can be included in the scene (see figure 3). The user has the option of attaching to any of these objects as they are moving through the model allowing specific paths to be followed and evaluated.
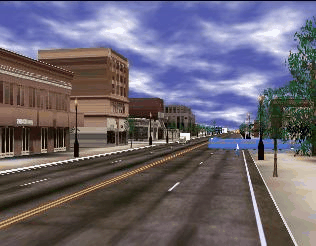
figure 3. Fully detailed urban model with automated vehicles and pedestrians
A separate mode of interaction allows three-dimensional selection ("picking") of objects in the scene. Once selected, an object can be removed from the scene (simulating, for example, the removal of a building from a lot), or highlighted in the scene (as if a colored spot light were focused on it). More importantly from a design perspective, alternative models can be substituted for the object. This latter function is useful for displaying design options for a particular site, or showing a sequential set of options (for example, models that show the development of a site over time or the growth of newly planted foliage over time).
Another key option in "pick" mode allows an associated database to be queried for object attributes. For access to databases in our demonstration project, we have chosen to link the visual simulator to ArcView2, a simple and intuitive interface for display and query of a GIS database.
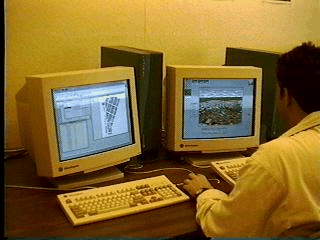
The GIS component of the system stores and maintains geographic databases at varying levels of spatial detail ranging from parcel data at the community level to data on the metropolitan region at the highest level. The GIS interface (ArcView2) can be used to process information in a traditional manner: to create, query and display data in two dimensional map form. Query results are also sent to the visual simulation module using the Remote Procedure Call (RPC) protocol available on UNIX machines (we are running ArcView2 in either a Sun Solaris or SGI IRIX environment). Figure 4 shows the system in operation on two side-by-side workstations (one displaying the visual simulation window and the other the ArcView2 window). It is also possible for both processes to be running on the same machine (given sufficient resources), or running on two different machines with windows open on a single monitor.
An urban model is composed of a number of different types of data: data describing the 3-D geometry of the study area; photo imagery data for realistic imaging of the site; and attribute data that would typically be contained in a GIS system. This data has alternative methods of representation and can be created and stored in a variety of ways.
The 3-D geometry of a model is constructed outside of the simulation environment using existing CAD or modeling packages. We have chosen to use MultiGen (MultiGen Inc., San Jose, CA) as the primary 3-dimensional modeler. Traditionally a tool used for military applications, MultiGen has the ability to quickly model an urban scene. A useful capability of MultiGen allows the application of photographic or video images ("textures") to highly simplified geometric models of objects (building, tree, street, light, car, etc.). In addition, MultiGen facilitates the specification of a hierarchical view of data organization which is consistent with a spatial subdivision of the geometry that is critical for optimal simulation performance.
When a model is loaded into the simulator for viewing, a run-time database of the 3- dimensional geometry is generated. This visual database, which is known as the "scene", is structured to maximize the efficiency of frame display so that real-time dynamics are feasible. The scene is organized into a hierarchical structure called a tree which is composed of connected database units called nodes. The scene hierarchy supplies rules which describe how items in the database relate to one another. The simulation software uses the spatial organization of the database to efficiently "cull" (temporarily remove from the scene) unseen entities and thereby increase the performance of the renderer. This means that the database should be organized along a spatial hierarchy which allows the system to eliminate portions of the models that are outside the cone of vision.
Figure 5 illustrates the most efficient scheme for database organization from a visual simulation system perspective. In this case the physical database is partitioned into regions, called tiles. Objects are organized on a tile-by-tile basis in the bottom tree structure. This can be contrasted to a typical data structure which clusters objects based on physical attributes as shown in the alternate tree structure in figure 5.
To make the dynamic query feasible during the simulation process, links must exist between the physical objects as stored in the simulation database and the GIS spatial/attribute databases. From the GIS perspective, a typical project involves an array of data accessible at different levels of spatial aggregation: Census data available by tract or block; data associated with an individual parcel such as zoning characteristics, assessed value, number of parking spaces; and data at the individual building level which might include building value, condition, and number of employees. These types of data attributes are generally associated with polygonal entities in a 2-dimensional GIS data base. In addition data is associated with linear features such as street or utility networks (e.g. traffic or information flows).
Historically the data organizing principal for geographic features in GIS is consistent with an object type paradigm. Similar types of physical features are grouped to form a theme and visualized as a layer of a map. For example, following the database scheme partitioned by object as shown in figure 5, one branch of the tree would group polygons representing blocks, another branch would group links representing street segments, etc. While there are topological relationships stored in the database for relating these different types of thematic groupings, features are basically stored and accessed by type.
For the visual simulation model, not only is the data organized spatially (i.e. different types of features which are associated with a particular spatial partition (tile) are clustered together under a common node in the data tree-structure), the basic graphic entities which are recognized in the GIS database may be partitioned in the visual modeling database. For example, when creating models specifically for visual simulation, we find it most efficient to use street intersections as the basic organizing unit. Intersections provide an easy way to reference the locations in the database (for example, the intersection of Wilshire and Vermont). Thus one tile includes an intersection and about a quarter of each of the four adjacent blocks. The blocks can be divided along parcel lines so that some data integrity is maintained, however, there is not a direct link in the data structure between the separate block segments.
Figure 6 shows the graphic representation of the basic organizational entity (the intersection). While this partitioning scheme facilitates the modeling process (it is more convenient to split the blocks into parts than to divide the streets down the center lines), it causes additional complexity when linking the physical model to a GIS database where normally a block would be stored as a coherent entity. Therefore, as models are loaded into the simulation run-time database, our software generates linked lists of pointers to geometry associated with GIS descriptors (e.g. block identifiers) to facilitate the interface between the systems.
When the 3-dimensional geometry of the model is constructed, geographic identifiers must be associated with objects in a scene. The MultiGen modeler allows the specification of a comment field with each object (node) of the geometric database. We use this comment field to assign a geographic descriptor to nodes in the 3-D database which represent a particular level of spatial aggregation. A descriptor is defined by specifying a "type" of object (such as "Block", "Lot" or "Building") and a corresponding identifier (eg. "1201.01" or "Bld23").
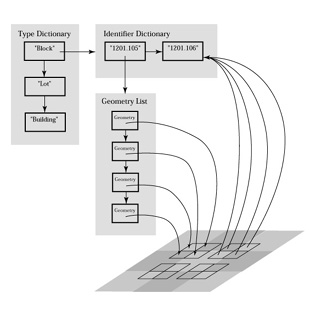
When the 3-D database is loaded into the simulator, the comment field is parsed and a dictionary of all "type" keys found in the model is generated. Each "type" key in the dictionary points to a second dictionary of object identifiers which are also generated as the model is loaded. Thus no master lists of object types or specific identifiers need be created a priori, rather these dictionaries are generated as the model is loaded. Each identifier in turn points to a list of actual geometry nodes in the scene data base.
Figure 7 diagrams a typical dictionary/pointer structure that is created when a model is loaded. For example, the "Block" entry in the "type" dictionary points to a list of Census Block ID's which have been attached to nodes in the 3-dimensional model. Each of these ID's points to a linked list of geometry nodes. At selected nodes in the scene hierarchy (nodes which group sets of geometry to make an object), pointers refer back to an identifier. When an object (piece of geometry) is selected in the simulation window, the scene tree is traversed upwards until the first node with a pointer to an identifier is found. This pointer makes it possible to quickly highlight all geometry belonging to the object to which the selected node is associated (e.g. the whole block) as well as recover the type identifier which can be sent to ArcView2.
ArcView2 and the visual simulation process communicate through the Remote Procedure Call (RPC) protocol. Each application operates as both a client and a server (i.e. a message can originate in either process). If an incoming message is detected by the simulation a callback function is activated to receive and process the message. In the ArcView2 process, a server script waits for requests from the simulator. When a message is received, a script is activated.
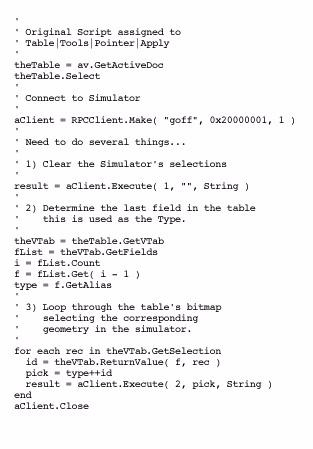
The query process can originate in the ArcView2 interface, either by selecting a geographic entity in the view window or in an associated table, or by issuing a query. This activates built-in Avenue (ArcView2's scripting language) scripts which carry out the tasks of highlighting the entity in the current map view or associated table. These built-in scripts have been modified so that in addition to their standard tasks, they activate an RPC call which sends a message to the simulator (see sample script in figure 8). The argument passed to the simulator is a string containing a field name (which identifies the "type" of object such as "Block") followed by an identifier (e.g. "1201.105"). For this demonstration project, the last field in the data table is assumed to be the key field.
The message string is processed by the simulation, searching the "Type" and "Identifier" dictionaries for a match. When the correct identifier is found, the associated geometry is highlighted in the 3-dimensional scene. For example, one might wish to identify all sites with ten or more employees. The results of such a query can be displayed by changing the underlying color of a building from natural to red. This highlights all buildings meeting the selection criteria by simulating the effect of shining several very powerful bright red spot lights on each facet of the building.
If a query originates in the simulation process while the simulator is in "pick" mode, a message is passed to ArcView2. This message contains an ArcView2 command to run a specific script (i.e. AV.RUN) with arguments describing the "Type" (e.g. "Building") and object identifier (eg. "Bld23"). The Avenue script which is launched by the run command searches the active table for the identifier and highlights the table entry and associated object in the view window (e.g. the building footprint on the plan).
The UCLA Urban Simulator Team has a number of real-world simulation projects in various stages of construction. Two of these projects are particularly suited to using the GIS interface: the Pico Union community development initiative and the proposed Playa Vista master planned community.
The creation of a virtual reality model for the Pico Union district of Los Angeles is part of a larger project to produce a comprehensive community development plan and services implementation program. This area of Los Angeles was badly damaged by the 1992 riots and the 1994 Northridge earthquake. For the initial project a base area of about eighteen square blocks of the community has been modeled. Using only simple interactive features of the simulator interface, planners have been able to experiment with removing a number of existing buildings and reclaiming street areas to bring park and green space into the neighborhood. Planners in the community are particularly interested in linking the virtual reality model to a GIS database for displaying information on population characteristics as well as parcel level data such as building ownership, type and the willingness of the owner to work with the community in the redevelopment process. In addition, information on the eligibility of each site for specific government redevelopment grants will be included. Accessing such data in real-time as part of the visual simulation will allow immediate identification of parcels which are most suitable for the planned redevelopment.
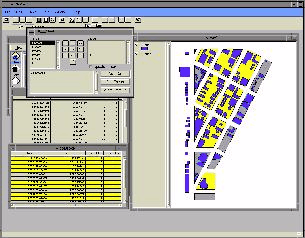
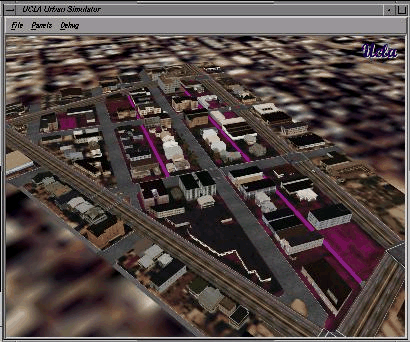
figure 9. Blocks highlighted in response to query of Census Block database
For demonstration purposes a GIS database has been created for this same 18 block area. Data is available at two levels: census block and individual building (represented by building footprints on the GIS map). Figure 9 displays the results of a query at the census block level. In this case, all blocks with fewer than two owner occupied units are highlighted (note, still to be implemented is the ability to highlight blocks in different colors to represent a range of data). In figure 10, based on querying the building data base, all buildings which are vacant are highlighted.
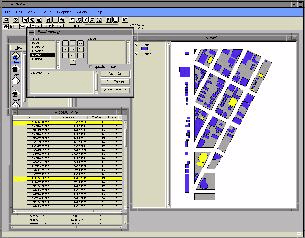
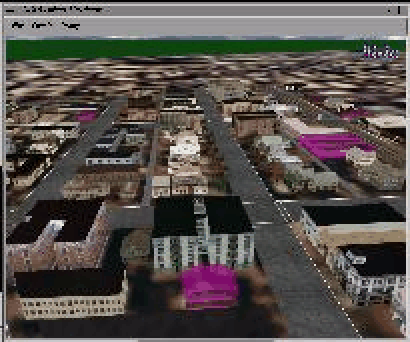
figure 10. All vacant building highlighted
Figure 11 shows the results of picking in the simulation window. The building which was selected is highlighted in the scene and the corresponding building footprint and table entries are highlighted in the ArcView2 window.
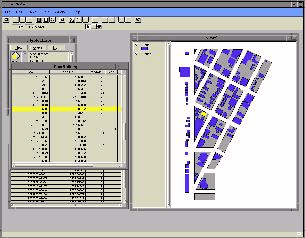
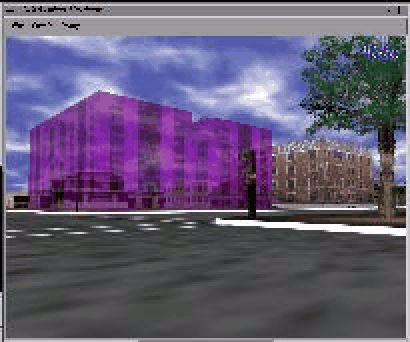
figure 11. Single building selected in simulation window highlighted
In the preceding examples, information is passed only from the client process to the server (i.e. in response to a selection in the simulation window (client), the server, ArcView2, displays a result, and vice versa). It is possible, however, to return information to the client process. The return of data in response to queries from the simulator has many possible uses in interactive design and decision making. For example, in another project we are using the Pico Union model to simulate the effects of a proposed ordinance which would require property owners to plant street trees in front of their properties (if they did not currently exist) upon the sale of the property. This plan [Shoup, 1995] is viewed as a simple way to improve neighborhoods at little cost to the home owner. In order to demonstrate the effect such an ordinance would have on a neighborhood, data on home sales over the last ten years was collected for a street in the Pico Union area. The simulator was then used to visually experience the changes in the neighborhood which would have occurred if street trees had been planted as the properties were sold (figure 12 shows views of the changing streetscape over time). While for demonstration purposes the sales data was hardcoded into the model, in the future it will be generated by database queries.
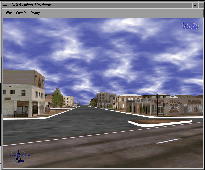
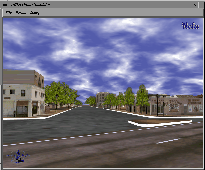
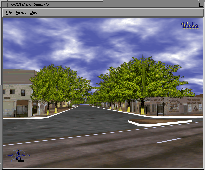
figure 12. Changes to neighborhood over time as street trees are planted
Another project, where database access would facilitate interactive planning and design, focuses on conceptual modeling of a new mixed-use, master planned community. This proposed community, known as Playa Visa, is located near the Pacific coast approximately two miles north of the Los Angeles International Airport. To date the Master Plan site layout including the surrounding natural bluff features and major existing buildings in the study area has been modeled (figure 13). This site model consists of the system of streets, lot boundaries and open spaces and will ultimately include the proposed landscaping. Once the infrastructure model is complete, building envelopes consistent with a detailed set of development criteria available in an associated database can be generated. Articulated models of typical buildings can be selected for inclusion on a site via access to a library of prototype massing models. Selection of appropriate building types could be guided by querying the associated database on development criteria or urban design guidelines.
Urban visualization is proving to be a valuable tool for designers and planners. The ability to visualize potential modifications to the urban fabric and experience these changes in their actual context allows planners and designers to evaluate alternatives rapidly, in more detail, and for lower cost than through more traditional analysis. It also makes the results of planning process visible, allowing the public to view the proposed changes to their environment in a realistic fashion.
While useful as a visualization tool, linking the simulation interface to attribute databases through an existing GIS system provides a powerful method for search and retrieval of information tied to 3-dimensional form. This combined system can be used both to identify existing problems and to quickly evaluate alternative solutions to those problems, significantly increasing its potential as a tool for analysis of complex urban problems.
Friedman, S. Urban Visualization and Simulation. MArch II Thesis. Graduate School of Architecture and Urban Planning, UCLA, 1994.
Liggett, R. and W. Jepson. An integrated environment for urban simulation. In Proceedings of the Third International Conference on Computers in Urban Planning and Management. Atlanta, 1993, pp 565-583.
Liggett, R. and W. Jepson. Implementing an integrated environment for urban simulation: CAD, visualization and GIS. In A. Koutamanis (ed) Visual Data Bases. Avebury, 1995 forthcoming.
Silicon Graphics Inc. Iris Performer Programming Guide. Silicon Graphics In., Mountain View, CA., 1994.
Shoup, D. Regulating land use at sale. Working Paper. Department of Urban Planning, UCLA, 1995.
Scott Friedman
Lecturer
William Jepson
Director of Computing
Department of Architecture + Urban Design
School of the Arts and Architecture
University of California at Los Angeles
Box 951467
Los Angeles, CA 90095-1467
Telephone: (310) 825-6294
Fax: (310) 825-7745