Jeffrey T. Limback and Bryce R. Brunner
Realtime Military Applications Using ArcInfo
Despite today's trend of bread military downsizing, one application
has enjoyed renewed attention and use: that of realtime simulation.
Due to its low-cost, safety and flexibility relative to using live
assets, simulation environments are used to enhance and sometimes
replace certain aspects of training and mission rehearsal exercises.
This paper will discuss the use of ArcInfo to help assemble vast
amounts of source data into a visual database capable of being displayed
on a realtime Image Generator (IG). The discussion will focus
on the integration of ArcInfo into an existing Database Generation
System (DBGS) and the use of ArcInfo in building a realtime visual
database for the Close Combat Tactical Training (CCTT) program.
INTRODUCTION
Today's realtime IG's are capable of rendering scenes of great complexity
and density. Gone are the days of simple databases containing
a few runways and a couple of buildings that are only displayed as
viewed at night. Databases now cover thousands of square miles and
contain complete linear feature networks, large areal features,
photo-specific and photo-realistic texture, large numbers of
three-dimensional static and dynamic models (tree, buildings, vehicles),
area specific terrain topology and many other features that help to
give a sense of realism to computer generated imagery. The challenge
now becomes to manage vast amounts of source data and to filter
this data down to proportions that can be rendered on a realtime IG.
This paper will discuss how ArcInfo was used to enhance an existing
DBGS in developing a realtime visual database for the CCTT program.
TOOLS DEVELOPMENT
Evans & Sutherland has developed a DBGS know as the Evans &
Sutherland Interactive Environment-Simulation Toolkit (EaSIEST) for
producing visual databases for the ESIG2000/3000/4000 line of realtime
IG's. EaSIEST includes tools for gathering and manipulating feature
and terrain data (DMA DFAD, DTED and ITD) and formatting these data
into a realtime visual database. Rather than enhance these tools to
meet the feature manipulation requirements of the CCTT program,
engineers from the U.S. Army Topographic Engineering Center (USA/TEC)
in Fort Belvore, VA, recommended ArcInfo for integration into the
EaSIEST DBGS.
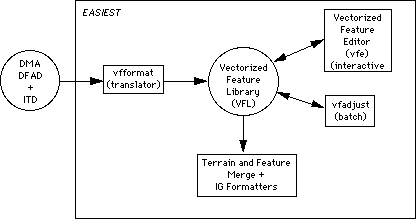
Figure 1 - EaSIEST Data Flow
Figure 1 shows the data flow through EaSIEST. Existing translators
in EaSIEST convert DMA DFAD and ITD formats into the E & S Vectorized
Feature Library (VFL) format. The VFL format is capable of saving
point, linear and areal features in a single file. New translators were
then written to convert VFL into ArcInfo coverages and tables with
each VFL feature type stored as a separate coverage. Reverse translators
were also written to translate the ArcInfo coverages and tables back
into VFL format. Figure 2 shows where ArcInfo fits into the EaSIEST
data flow.
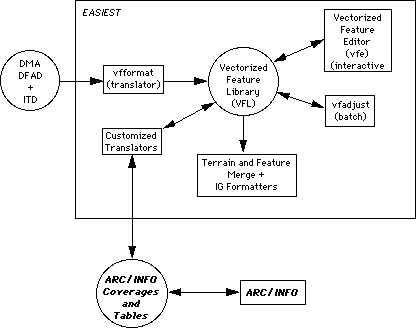
Figure 2 - EaSIEST Data Flow with ArcInfo
These translators originally utilized ArcInfo's Arc Macro
Language (AML) as well as C programs incorporating the Inter-Application
Communication (IAC) capability of ArcInfo and the INFOLIB software
library developed by Todd Stelhorn at Esri. However, IAC proved too slow
for use in translators. Evans & Sutherland has since become an
Esri Software Development License (SDL) holder and the translators have
been rewritten to utilize the SDL library, greatly improving their
performance. Total development time for these translators has been
about one man-month.
Once these translators were written and tested, they were made available
to the database production team for use. The following section discusses
how ArcInfo was used in conjunction with EaSIEST in producing CCTT
databases.
DATABASE PRODUCTION
SOURCE DATA
The selection of source data is greatly dependent upon customer
training requirements. For the CCTT program, source data directed
toward ground warfare training is required. Interim Terrain Data (ITD)
is SLF format provided by DMA met these requirements. To augment this
data, DMA DFAD Level 1 feature data was used. The elevation data used
was DMA DTED Level 2.
The ITD data consists of six thematic layers:
Each layer may contain point, linear and/or areal features. Point
features are those placed at a single location such as bridges,
buildings, houses, etc. Linear features are used to represent road,
rivers, railroads, etc. Areal features are used to represent lakes,
grass lands, forests, etc. (see figure 3). All features are 2D at
this time and may be mapped or replaced by 3D features in a future
process.
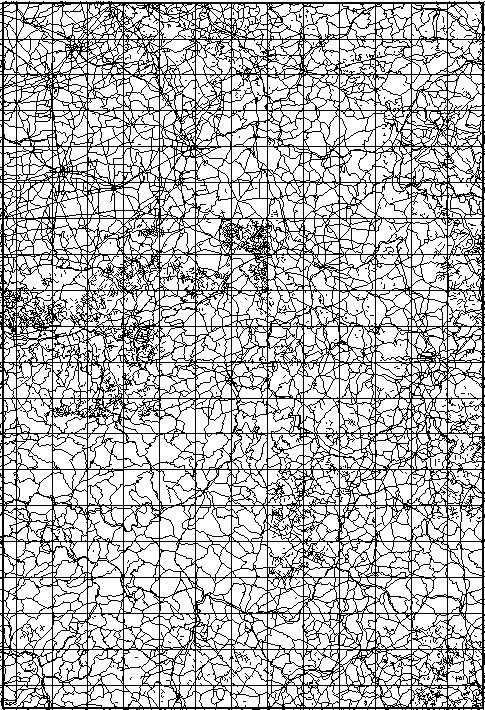
Figure 3 - CCTT Transportation Layer
LOADING THE DATA INTO ArcInfo
In the initial database design, ITD data would be taken directly into
ArcInfo, modified and then exported back into ITD format. Several
problems were encountered with the ArcInfo ITD importers and exporters,
SLFARC and ARCSLF respectively. As a result, the translators
previously discussed were developed. This required all ITD data to
be converted to VFL format before being imported into ArcInfo.
Once the data has been successfully imported, many operations are
performed, the first of which is to combine the 35 ITD coverages (each
coverage being 12 degrees by 20 degrees) into a single coverage. The
resulting coverage has had all edges dissolved to provide a single file
with continuous data. This is an important first step in that it
greatly improves future processes related to thinning, correcting and
otherwise modifying the data.
We continue combining layers until we obtain the following six layers:
MANIPULATING THE SOURCE DATA
All source data has inherent problems associated with its use. The
task to identify these problems and attempt to correct or otherwise
compensate for them ranges from simple to elaborate.
One example was
an attempt to identify continuous primary roads in the transportation
layer. When selecting roads based on type and width, many disjoint
segments were encountered. Looking at the 1:50,000 maps, primary roads
were identified and compared with those selected from the source code.
There were many discrepancies. Some roads would show up as secondary
roads in the source data but were actually primary roads according to
the maps. We made an assumption that the person creating the source data
digitized all primary roads first and created an AML to select the first
N roads digitized. We began with a number around three hundred and adjusted
it up or down until the primary roads selected in the source data
matched the primary roads in the maps. As a result, we were able to
produce a much more accurate and complete network of primary roads from
the source data.
Other main operations performed in ArcInfo were related to thinning.
Nearly all features were generalized to reduce the number of vertices used
to describe the feature. We also removed features of low importance, such
as cart tracks. Reducing the amount of source data while
retaining visual integrity is a necessary and intricate process. In
some cases it required several iterations to provide the desired results.
Other more complex AMLs we are working on involve creating intersections,
properly placing bridge features and snapping areal features to terrain
skin facets. ArcInfo has many strength and has proven to be an
invaluable tool. If there is one area where ArcInfo is deficient, it is
in the storing of vertex attributes. Storing vertex attributes is currently
not available in ArcInfo and is a serious problem we are attempting to
compensate for.
GENERATING A 3D VISUAL WORLD FROM THE SOURCE DATA
Once the source data has been sufficiently modified, it is ready to be
polygonalized and turned into a 3D visual database. Before a visual database
can be generated, all source features need to be given colors,
textures and material codes. This includes all features from roads and
rivers to trees. All 3D point features such as building, barns, power
poles and bridges must also be created.
The elevation data must become a terrain skin of polygons before feature
data can be placed upon it. This is performed through a series of EaSIEST
tools which take the source elevation data and create a 3D polygonalized
terrain skin from it.

Figure 4 - Surface Conformal Example
The next step is to merge the feature data with the terrain data using
another EaSIEST process (see figure 4). This process effectively takes
the 2D source data and drapes it on top of the existing 3D terrain skin.
Areas that are grass will be covered with grass texture. Areas that are
forest will have a forest texture but will also contain various types and
mixtures of 3D trees. Point features will cause a 3D model (house, barn,
bridge, etc.) to be place on the terrain. We can also randomize the
placement of point features to add variety to the database.
The final step is to format the database for one of the E & S IG's, in
this case the ESIG 3000. Once completed, the formatted database is loaded
on the IG and the database is ready to be rendered in real time. A person
can move throughout the database in realtime, moving in any direction
desired. Any moving models, such as tanks, planes and trucks, can be
placed in the scene and put in motion. Animations and special effects
such as explosions, tracer fire and smoke, which are created in the
database, can be implemented. Plan view and hard copy maps can also be
generated from the source data which directly correlate with the database.
CONCLUSION
Through the integration of ArcInfo and EaSIEST, large amounts of source
data were able to be handled in the creation of the CCTT program realtime
visual databases. The cooperation between Esri and E & S will allow us
to create larger and more dense databases in a shorter amount of time.
Figure 5 shows an example scene from a production database.
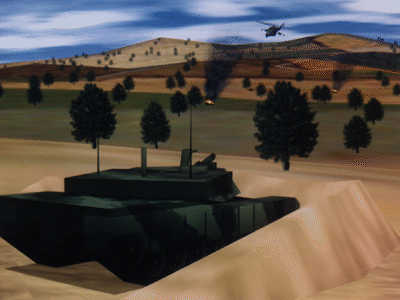
Figure 5 - Example Scene from Production Database
Jeffrey T. Limback
Bryce R. Brunner
Evans & Sutherland Computer Corporation
600 Komas Drive
Salt Lake City, UT 84158
phone: (801) 582-5847
fax: (801) 583-9738
email: jlimback@es.com OR bbrunner@es.com