Christopher B. Cogan
The California Biodiversity Project:
Selection and Use of Biodiversity Indicators

Selection and Use of Biodiversity Indicators
These measures have included land management status, species richness, landscape metrics, and the presence of threatened and endangered species. This paper discusses an approach which combines several of the above measures, and presents a model designed to predict future biodiversity conflicts, enabling this information to become part of the process of land planning and management. These methods are intended to represent biodiversity at the ecoregional scale, while functionally operating at the county level where many planning decisions take place.
The California Biodiversity Project is being conducted by the Center for Biodiversity Analysis and Management (CBAM) at the University of California, Santa Cruz, and is funded by the National Biological Service.
Introduction
The California Biodiversity Project is designed to create and use geographic
information system (GIS) databases on potential urban growth and development and
link this information with data on biodiversity. These databases are then
used to forecast the development and locations of the worst biodiversity
conflict points over both the short-term (5-10 years) and medium-term (20-40
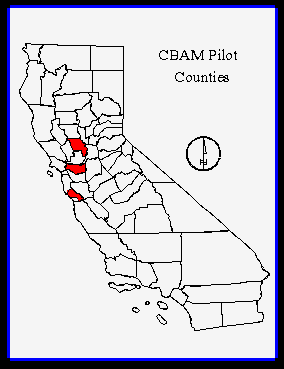
years). The project operates at the county scale, using three counties in
California as pilot areas (Figure 1). Yolo County, which is largely
agricultural, offers several interesting opportunities for biodiversity
planning in cooperation with the farming community. Contra Costa County
contains a mix of agriculture interests in the east, and dense urbanization in
the west adjacent to San Francisco Bay. Santa Cruz County, alongside Monterey
Bay and the Pacific Ocean has many coastal influences, and large areas of
private land currently managed in semi-natural conditions. The three county
project is in progress, and we welcome the opportunity for collaboration with
other interested parties.
Ecosystem Health
"Ecosystem health" is a metaphor that attempts to compare the
quality, fitness, stability, and sustainability of an ecosystem to animal or
human medical health. As a first step, assessing ecosystem health requires
the identification of indicators (such as the presence of particular species,
or soil nutrient utilization efficiency). Later, this information can be
aggregated into composites (e.g. species richness) of data which when combined
with historical and other information, can provide us with insights to the
overall performance or health of the system. This approach does not indicate
a reliance on single species indicators, which are inadequate because they do
not represent complexity of ecosystems, instead it is necessary to use of
several types of available information if ecosystem health is to be assessed
correctly. Basic indicators such as single species population levels,
nutrient loadings, or toxic release data provide us with very precise
information which is relatively easy to interpret, however they are not in
themselves extremely powerful in describing the general status of the
ecosystem. Unfortunately, as we aggregate our indicator data, and incorporate
additional information, we begin to bring in less precise data, increasingly
including data derived from, or at least biased by our own value systems
(Figure 2).

Indicators of Biodiversity Conflicts
We begin our project with an analysis of biodiversity at the ecoregional
scale. We are using ecoregions as defined by Jepson (1993) though there are
several other definitions that could work equally well in other states (e.g.
Bailey 1995, Omernik 1986). This is a coarse scale measure to give the county
information an ecoregional context. Species and habitats do not stop at
county lines, and our analysis needs to incorporate this regional information.
The ecoregion data can be thought of as measures of risk (habitat in the
ecoregion not managed for biodiversity) and responsibility (the percentage of
ecoregion habitat within the county). This information can then be calculated
for each polygon or grid cell in the county. Conceptually, this information
forms the first part of our biodiversity algorithm which is described as:
Polygon or grid cell value = Ecoregional (Risk and Responsibility)
Analysis of Within County Biodiversity Elements After an overview examination of the major biodiversity factors at the ecoregional scale, we then proceed to incorporate information on the county species and habitats of special importance. This data is well known in each county, and is the subject of much attention by state and federal biologists as well as local parties. Examples of these "rare", "threatened", and "endangered" species and habitats include vernal pools, hibernacula, and species of special concern. These indicators are not predictive, they represent current problems. These known problem areas are essential to include in an overall biodiversity assessment, as they represent our most critical "hot spots" of land management concern.
This information on county elements is then incorporated into our biodiversity algorithm:
Polygon/grid cell value
= Ecoregional (Risk+Responsibility)
+ Features of Special Concern
Species Habitat Assemblages
Of particular importance to our model is information on species and habitats
within particular counties which appear to be relatively healthy and have not
yet been found to be under stress from anthropogenic effects. This data
contributes strongly to the predictive power of our model, because at this
step we are working with a group of species that are not yet in any special
category of concern. By comparing a known list of species to the habitat
needs for each species, overall habitat loadings can be calculated for each
habitat type in the county. Species are selected in consultation with local
experts based on known presence, with additional selection and possible
weighting based on guild, keystone effects, and umbrella species.
The biodiversity algorithm thus far:
Polygon/grid cell value
= Ecoregional (Risk+Responsibility)
+ Features of Special Concern
+ Sum (species value * proportion of species
dependence on habitat)
Landscape Factors
Landscape effects are also an important component of our model. These can include
both "positive" and "negative" weighting. For example, an
area of oak woodland should be penalized at a certain distance from
incompatible development, so a plot of oak woodland surrounded by high density
housing receives a different weighting than protected habitat. Small habitat
patches are another example of candidates for negative weighting, with
exceptions for habitats like vernal pools. Positive weighting could occur if
an area is a component of a wildlife corridor, or is adjoining protected
habitat. We may be able to incorporate an existing, field-tested set of
landscape measurement tools, like the CA Dept. of Forestry's FRAPP Program
landscape measurement tools, which calculate changes in patch number, size,
and distribution, as well as percentage change in different landcover types. As
an example, one way to account for distance to incompatible management is to
use a distance weighting function to adjust the biodiversity value of a
polygon. There are some issues on how to achieve this with irregular
polygons, however it offers the advantage of incorporating a logarithmic decay
function with distance rather than the simple binary result achieved with the
use of buffers. For example, if a polygon is known to be 2.3 hectares but we
wish to reassess its biodiversity value because it is only 4 km from a highly
developed area, we can use the following formula:
U2 = U1 * y
where:
x is the distance in km from the developed area (i.e. 4 km), and
y is the adjusting multiplier for the original area (U1=2.3)
With this distance, the functional polygon area decreases from 2.3U to 1.8U (where x=4, y=0.78)
The biodiversity algorithm thus far:
Polygon/grid cell value
= Ecoregional (Risk+Responsibility)
+ Features of Special Concern
+ Species/Habitat Assemblage
+ Landscape Factors
Restoration Potential
In areas such as eastern Yolo County, the majority of land for biodiversity
management are situated in areas of agricultural landuse. The potential biodiversity
value of these lands can be improved assuming some restoration is possible. For example,
in some locations the strips of land between fields or riparian areas can be slightly
widened and replanted with native vegetation.
The final biodiversity algorithm:
Polygon/grid cell value
= Ecoregional (Risk+Responsibility)
+ Features of Special Concern
+ Species/Habitat Assemblage
+ Landscape Factors
+ Restoration Potential
Socioeconomic Models
After we have gone through and assessed each area within the county using
our model, we have an index of biodiversity to work from. With the addition of
various urban growth models, we can then compare alternate strategies as they are
proposed. One such model has already been developed by Bradshaw, Muller et. al.
for the American Farmland Trust (1995). These and other growth models (e.g. Landis
1995) are well suited to work in conjunction with our efforts to predict biodiversity
impacts under hypothetical growth scenarios. More immediate development proposals can
also be incorporated into the model. For example, local planners may with to assess
the biodiversity impact of a single proposed development, and compare location options.
Intended Users of Predicted Biodiversity Information
Our model is intended to be flexible, with parameters that are adjustable by
the user. This will permit a certain degree of abuse of the data, yet it also
offers a powerful tool which can help provide information about biodiversity
loss from various development proposals. The products of this project will
not only be useful for County Planners, but also to general plan authors,
habitat conservation plan (HCP) users, and others who are interested in
proactively protecting biodiversity interests in California counties.
Acknowledgments
This project is a collaborative effort by many individuals and organizations.
Special thanks are given to the county planners of Yolo, Contra Costa, and
Santa Cruz, the many experts from the California Department of Fish and Game,
and the National Biological Service. I am also grateful for the assistance of
Dr. Frank Davis and Dr. David Stoms of the California Gap Analysis Project.
References
American Farmland Trust. 1995. Alternatives for future urban growth in
California's central valley: the bottom line for agriculture and taxpayers.
American Farmland Trust, Davis, Calif. 61pp.
Bailey, R.G. 1995. Description of the ecoregions of the United States 2nd ed., rev. and enl. Mar. 1995. Washington, DC : U.S. Dept. of Agriculture, Forest Service. Series title: Miscellaneous publication (United States. Dept. of Agriculture) ; no. 1391.
Costanza, R. 1992. Toward an operational definition of ecosystem health. In Ecosystem Health: New Goals for Environmental Management. Costanza, Norton, and Haskell (eds.) Island Press, Washington D.C. 269pp.
Jepson, W.L. 1993. The Jepson Manual: higher plants of California. J.C. Hickman, editor. Berkeley CA 1400pp.
Landis, JD. 1995. Imagining land use futures - Applying the California urban futures model. Journal of the American Planning Association, 61:438-437.
Omernik, J. M. and Gallant, A.L. 1986. Ecoregions of the Pacific Northwest. U.S. Environmental Protection Agency, Environmental Research Laboratory, Corvallis, OR.
Author Information
Christopher B. Cogan
Environmental Studies
214 College 8 Academic
University California, Santa Cruz
Santa Cruz, CA 95064
Fax: (408)459-3518
cogan@time.ucsc.edu