Roger Fletcher
A Dynamic Electric Utility GIS Database
Electric utilities have been around for over 100 years, but changes are always occurring. Some changes are caused by deregulation and others due to technology. Change forces the utility Electric GIS object types and associated information needs to need modification. This paper presents a database design which allows new object types and associated information needs to be configured dynamically as needed. Changes to the database structure and or software are not required.
Introduction
The design of the dynamic electric utility GIS database was realized over several years . The initial effort started in 1986 and was targeted for the implementation of an Automated Mapping / Facilities Management (AM/FM) system for Puget Sound Power & Light Company (Puget). There are some main processes which helped lead the development to the current design and are important in showing the features of the design.
Electric Component Discovery
To determine the AM/FM requirements of the distribution segment of an electric utility, an electrical component discovery process was done. This was performed by reviewing legacy utility facility management databases (automated and manual) and by talking to users of these databases. Lists of electric devices and their attributes were compiled and definitions of each were written. A sample listing of some of the components and some of their attributes is shown in Table I.
                      TABLE  I
        Electrical Components and Attributes

   COMPONENT NAME          COMPONENT NAME
     Attribute Names         Attribute Names

  CONDUCTOR OH* PRIMARY   CONDUCTOR UG* PRIMARY
    Circuit ID              Circuit ID
    Conductor Type          Conductor Type
    Date Installed          Cable Number
    Feeder                  Date Installed
    Impedance               Feeder
    Length                  Impedance
    Operating Voltage       Insulation Thickness
    Phase                   Length
    Size                    Manufacturer
    Work Order Number       Reel Number
                            Size
                            Work Order Number

  LIGHT                   POLE
    Billing Code            Class
    Customer Account        Date Manufactured
    Date De-Energized       Framing Type
    Date Energized          GRID #
    Date Installed          Height
    GRID Number             Material Type
    Lamp Type               Orig. Ground Level Circ.
    Lamp Watts              Original Treatment Type
    Luminaire type          Ownership
    Manufacturer            Pole Number
    Map Number              Species
    Owner                   U-Map Number
    Job Number              Work Order Number

  SWITCH                  TRANSFORMER
    Address/Location        Circuit ID
    Circuit ID              Company ID
    Company Number          Date Installed
    Date Installed          Date Manufactured
    GRID Number             GRID Number
    Initial Cost            Impedances
    Manufacturer            KVA
    Model Number            Manufacturer
    Serial Number           PCB Content
    Switch Number           Primary Voltage
    Voltage Rating          Secondary Voltage
    Work Order Number       Serial Number
                            Work Order Number

   * (OH = OverHead, UG = UnderGround)
Over 60 electric distribution components were initially identified. This list did not include nuts and bolts but components that are shown on maps and or are significant enough to be tracked.
The resulting lists showed that many of the components had some of the same attributes (i.e., Circuit ID, GRID Number, Work Order Number, etc.). Also, some of the component attributes had different names but were the same (i.e., Job Number and Work Order Number.).
AM/FM Systems
Puget evaluated two AM/FM systems (which are now not marketed) in 1986 and 1987. They were IBM's GFIS and Synercom's INFORMAP II. Each provided for layers of graphic data with each layer/component having its own set of attached attributes. IBM's system provided for physical and electrical relationships between each component. This provided background information relating to desirable types of AM/FM functionality. (Puget purchased part of IBM's GFIS system software and one workstation, which was used for demonstrations in summer of 1987 and then abandoned.)
Information Engineering
In late 1987, Information Engineering techniques were introduced to the development. Using these techniques and with the help of a consultant, Entity Relationship Diagrams (ERDs) were developed for the Electrical Distribution Components and some Transmission Components. Most of the components in the original list became Entities as well as some of the component attributes. Figures 1 and 2 show two of the many ERDs developed.
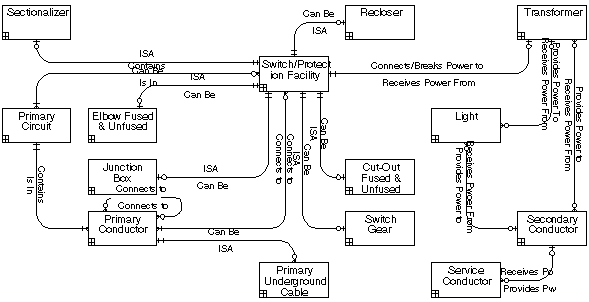
Figure 1 Distribution OH Structure ERD
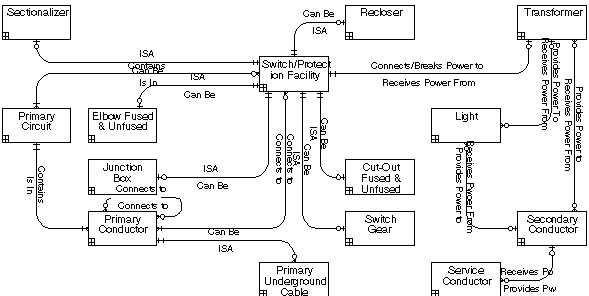
Figure 2 Distribution Electric ERD
These figures show some of the physical and electrical relationships that actually exist between the in-service components. If an AM/FM system's database has the capability to represent the electrical system completely, then all current and future application functions should be able to be performed.
ArcInfo
In 1988 Puget Purchased version 4 of ArcInfo. It was not an AM/FM system but a GIS. It could do what the AM/FM systems could do and more. It provided graphic layers (coverages) with each layer feature having its own set of attributes. Electric conductors could be represented with arc features and devices with point features. Spatial analysis functions between the features could be performed.
Our first AM/FM/GIS database design with ArcInfo consisted of almost one layer per entity. However, this design did not work very well. ArcInfo was slow switching between layers during editing. Some users stated that they could draw maps faster manually.
The second design put all of the electrical distribution entities into one layer. This solved the editing performance problem but created a data problem. This problem was solved by eliminating all of the attributes that did not occur on maps and generically naming attributes so they could be used to handle data for whatever entity was being recorded. This design was used successfully to do map conversion.
Integration
From the beginning of the development there had been a vision that an AM/FM/GIS database could be the hub or common connection between other corporate databases. Most legacy systems databases were islands with no defined interfaces to other systems. We did not want this AM/FM/GIS database to be an island too.
Our first AM/FM ERDs revealed many duplicate connection points to other systems (i.e., Work Order Number attribute occurred in each entity). This was not desirable. Multiple interface points for the same data would make interface application development between them complex. We wanted a simple interface for each corporate database.
During the electrical component discovery process, one user group provided us with the name of the interface point. But it was not realized and used until four years later. The user group was Plant Accounting of the Property Records department. The Utility Plant interface point was born. Figure 3 shows Utility Plant as the hub with other corporate databases around it and with one interface each.
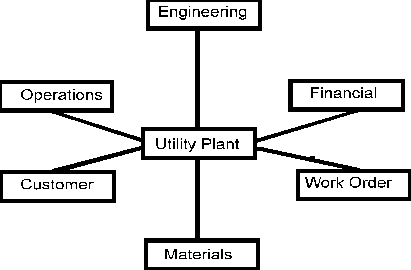
Figure 3 Utility Plant Integration
Utility Plant ERD
The electrical components now needed to be modeled in the Utility Plant framework. Figure 4 shows the first Utility Plant ERD. A Utility Plant Item (UPI) could be an Anchor, Capacitor, Conductor, Light, Pole, Switch, Transformer, Vault, etc. A UPI is characterized by what Utility Plant Item Type it is. Other entities were created and related to the UPI to provide the definition of data for the electrical components.
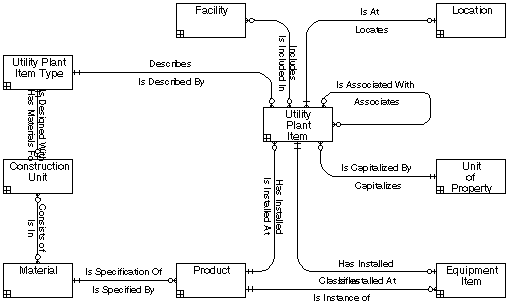
Figure 4 First Utility Plant ERD
The Utility Plant ERD was just a model; it had not been tested. Could the data of the legacy system databases fit into this model? In 1992 Reverse Information Engineering Techniques where applied to three legacy FM databases and to the ArcInfo AM/FM/GIS database. An ERD model was created for each. The four ERDs were merged to create a composite ERD model. Figure 5 shows the main parts of the Composite UPI Entity Model. The composite model had some changes but was very similar to the original UPI ERD.
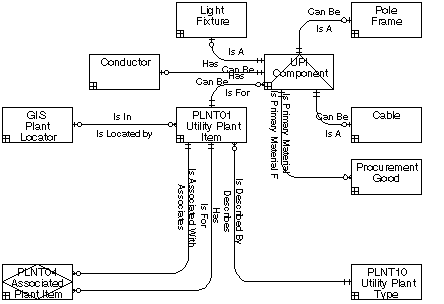
Figure 5 Composite UPI entity Model
Pilot Implementation
The UPI model was implemented in a pilot database and applications. ArcInfo version 6 and Oracle version 6 (a Relational Database Management System (RDBMS)) were used. The graphics were maintained and stored by ArcInfo and the data by Oracle. (ArcInfo Feature Attribute Tables could not be configured to support the UPI model. Also, INFO did not have the functionality and power that Oracle provides.)
The Pilot was a success, but it did show some weaknesses with the model in interfacing with ArcInfo. Some UPI occurrences were not shown graphically (i.e., on a map), but were related to those that were. A new entity was needed that would provide a one-to-one correspondence to each graphic or GIS Object in ArcInfo.
Dynamic Database
Figure 6 shows the main part of the Dynamic Database Design. Note that the ERD includes the one-to-one GIS Object entity.
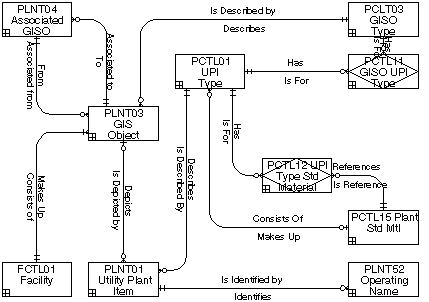
Figure 6 Dynamic Database Design
The model was implemented with ArcInfo version 7 with ArcStorm and Oracle version 7. Each entity in the model is an Oracle table. There is one electric layer in ArcStorm which has point and arc features which corresponds to the Oracle GIS Object table.
The database is made dynamic by having tables that contain rules, descriptive information and list of values which are used by the applications to control what can be done. Each electrical component type that is shown by a graphic is defined by a record in the GISO Types table. If a new electrical component type is needed it is just added to the GISO Types table. There are other control tables that are related to the GISO Types table. They define what graphic manipulations can be done, how annotation text is generated and placed, what data is required, what UPI Types can be attached to a GISO Type, etc.
The graphic is completely describe by the GISO data, the attached UPI type data and UPIs are described by a reference to a Plant Standard Material occurrence. Figure 7 shows a GISO, attached UPIÕs and each UPIs assigned material.
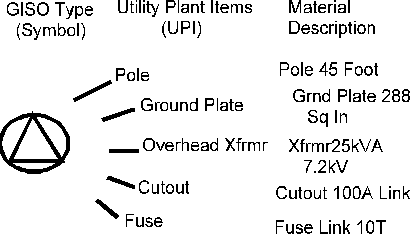
Figure 7 GISO UPI Material Relationship
The GISO Type is a Pole Mounted Transformer. It graphically represents at least one Pole and one Transformer, but it could represent two, three, four, etc. transformers. UPIs are attached to describe each electrical component whether it is graphically represented or not. The UPI is describe by what Material description is assigned to it.
Summary
The dynamic electric utility database provides the user the ability to easily add new electrical component types and their possible descriptions without modifying the database or software. The addition can be done in minutes compared to weeks or months with other designs where the database structure and software would need to be modified.
Roger Fletcher, Sr. Developer
Enghouse Systems USA, INC.
720 Olive Way, Suite 900
Seattle, WA 98101
Phone: (206) 262-1999 ext. 202
Email: rfletcher@enghouse.com
WEB site: www.Enghouse.com