The National Bureau of Surveying and Mapping (NBSM) of the People's Republic of China and the U.S. Geological Survey (USGS) of the United States of America have worked together on joint geographic information systems (GIS), remote sensing, and production management studies and projects. This presentation describes the production of terrain relief maps of China completed under the joint GIS research efforts of the NBSM and the USGS. The relief maps of China at scales of 1:2,500,000 and 1:4,000,000 were completed by the NBSM using techniques developed and tested jointly with the USGS. Black-and-white and color terrain relief maps were produced using NBSM 1:1,000,000-scale digital elevation models and other topographic data, a C language program, and ArcInfo's GRID and TIN modules. The maps can be used for geomorphic, geologic, and geographic analysis and in combination with other thematic data.
Any use of trade, product, or firm names is for descriptive purposes only and does not imply endorsement by the U.S. Government or the Government of the People's Republic of China.
           INTRODUCTION

           The National Bureau of Surveying and Mapping (NBSM) in the People's

           Republic of China and the U.S. Geological Survey (USGS) in the United

           States of America worked together to produce shaded-relief maps of

           China.  This project is in accordance with Annex II of the Protocol for

           Scientific and Technical Cooperation in Surveying and Mapping Studies

           between the two national agencies as outlined in the general objectives

           covering the period 1991 to 1996.  The NBSM and the USGS have

           worked together on geographic information systems (GIS), remote

           sensing, and production management studies and projects since the

           Protocol was established in 1985.  This paper describes the methods and

           procedures used in creating shaded-relief maps of China using NBSM

           1:1,000,000-scale digital elevation model (DEM) data, a

           1:1,000,000-scale cartographic data base, a C-language program, and

           ArcInfo.


           NATIONAL FUNDAMENTAL GEOGRAPHIC INFORMATION

           SYSTEM OF CHINA

           The National Fundamental Geographic Information System (NFGIS) of

           China (formerly known as the National Land Information System) is one

           of the largest national GIS data bases in China and a subsystem of the

           National Economic Information System of China.  It has been under

           development at the National Geomatics Center of China, an agency of the

           NBSM, since 1984.  The NFGIS provides China a common, basic spatial

           information system.


           The NFGIS is divided into two levels: the National Center System in

           Beijing and subsystems in each province.  At the national level the data

           are at scales of 1:1,000,000, 1:250,000, and 1:50,000.  The provincial

           subsystems maintain data at scales of 1:250,000, 1:50,000, 1:10,000, and

           larger.  The National Center System and the provinces work together to

           collect and maintain the data at each level.


           Several types of data bases make up the NFGIS: topographic, geographic

           names, geodetic control, and gravity data.  The topographic data base is

           at scales of 1:10,000, 1:50,000, 1:250,000, and 1:1,000,000.  Plans call

           for image data and raster scanned graphic data bases to be included in the

           future.


           The initial task in developing the NFGIS was to build the

           1:1,000,000-scale topographic, geographic names, and DEM data bases

           for the entire country and the gravity data base for the southwest part of

           the country.  Now, the 1:250,000-scale topographic and geographic

           names data bases are being built, and the 1:50,000-scale data bases are

           being planned.


           The main contents of the 1:1,000,000-scale topographic data base are

           surveying control points, hydrography, populated places, transportation,

           boundaries, hypsography, and vegetation.  The data are fully topologically

           structured and attribute coded.  The data category and attribute codes are

           used to describe features represented as a point, line, or area.


           DEM data were collected from more than 10,000 topographic map sheets

           at scales of 1:50,000 and 1:100,000.  About 25,000,000 elevation points

           were collected from map sheets at these scales to cover the entire

           country.  The elevation points are spaced at every 28.125 seconds of

           latitude and 18.750 seconds of longitude.  The ground resolution ranges

           from 800 by 600 meters in the southern latitudes to 450 by 600 meters in

           the higher latitudes.


           COLLECTING DEM DATA

           The NBSM uses several approaches to collect DEM data.  For the

           1:1,000,000-scale DEM's, data were directly read from paper maps at

           scales of 1:50,000 and 1:100,000.  Masks consisting of a 32- by 32-line

           grid were overlaid and registered on the 1:50,000-scale map sheets.

           Elevation values were visually interpreted according to the point's

           position relative to the intersection of the grid lines.  To avoid

           interpretation errors, two different technicians independently interpreted

           each point.  A computer program checked DEM data points to search for

           unusual elevation values.  A logical check of the data was done to identify

           all points larger than the highest elevation in China.  The data were also

           displayed to identify and correct errors.  The data were grouped and

           stored in blocks measuring 3 degrees of latitude by 2 degrees of

           longitude.


           The vertical elevation error allowed was one-half of the contour interval

           of the source map.  The DEM's root mean square error (RMSE) for

           various terrain is listed in Table 1.

           The 1:1,000,000-scale DEM data have supported the realtime monitoring

           of floods, research on long-term earthquake forecasting, and planning and

           management of radio, television, and FM frequency ranges.  The DEM

           data were also used to perform slope analysis, define geomorphic zones,

           plan agriculture and forest areas, and derive a 1:4,000,000-scale

           geomorphic map of China.  This map was the first of its type produced in

           China using DEM data and digital cartographic production

           techniques.


           SHADED-RELIEF MAPS

           A shaded-relief map is a thematic map that shows geomorphic and

           elevation change by using varying shades of gray corresponding to

           different slope and aspect values.  Before computer technology was

           available, relief maps were traditionally hand drawn by skilled

           artisan-cartographers, a time-consuming and difficult task.  The quality of

           the finished map was dependent upon the cartographer's imagination and

           artistic skill.


           Today, shaded-relief maps can be created by computer-based methods.  A

           GIS is used, and the relief map is created by mathematical calculation

           rather than by the cartographer's eye.   Parameters include cell size, light

           direction, and viewing angle.   The value of the gray scale (V) of each cell

           is a function of slope (S) and aspect (A):


           V = f ( S x A )


           Black-and-white relief maps are very similar to aerial photographs or

           satellite image maps, but without cloud or vegetative cover.  The gray

           values of cells can be changed by using different parameters to enhance

           the three-dimensional effect.   Cell size can be changed and smoothed to

           change the map detail.  The black-and-white relief maps of China at the

           scales of 1:2,500,000, 1:4,000,000, and 1:6,000,000 serve very well for

           showing the characteristics of geomorphic patterns of China, such as the

           three major geomorphic regions of the country, the Loess Plateau, the

           Sichuan Basin, and the desert regions.  The relief map could be used for

           geomorphic analysis and is a good background for certain kinds of

           thematic maps such as land cover and land use, weather, and geologic

           structures.


           CONVERTING THE DEM DATA

           Converting the DEM data into a useable format was the first step in

           compiling a shaded-relief map.  It was necessary to convert and resample

           the data for import into ArcInfo's GRID module, to reduce the

           number of data points from 25,000,000 to a more manageable number,

           especially since all the points were not necessary for display at small

           scales.  Because the data are collected and stored in 3- by 2-degree

           blocks, the tiles need to be mosaicked together to form a continuous

           coverage.  Two DEM conversion methods were developed and

           tested.


           The first method used ArcInfo's TIN module to convert, resample,

           and mosaic the DEM data.  The method was tested using a 6- by

           4-degree test area consisting of four 3- by 2-degree blocks of data.  This

           entailed creating an ARC point coverage with the DEM data points and

           converting the file into a GRID file using the TIN module functions of

           CREATETIN and TINLATTICE.


           The first step in this process was to rewrite each of the 3- by 2-degree

           blocks of DEM data into a new file readable by ArcInfo's

           GENERATE command and the format:

                elevation value     longitude      latitude


           This step also was used to mosaic four of the 3- by 2-degree blocks

           together into a block of 6- by 4-degrees.  The next step created an

           ArcInfo point coverage using the data from the previous process.

           The data were then projected into the Lambert projection commonly used

           in China to display maps of the entire country.  The next step was to

           convert the point coverage into a triangular irregular network (TIN)

           format.  The last step resampled the TIN file into cells with a ground

           resolution of 1,500 by 1,500 meters.  Although this method produced

           data at the appropriate level, the processing time for the test area was too

           long to use to process data for the entire country.


           In the second method, a C language program running under the UNIX

           operating system resampled and converted the data.   The first step read

           and mosaicked all the DEM data and projected them onto a Lambert

           projection.  The data were resampled using a weighted mean square

           distance algorithm (see figure 1).

Where Z is the new elevation point calculated from n number of elevation
points spaced a distance of d from each other.
In the next step the data were converted into an ArcInfo ASCII
format from which a GRID file was created. The process successfully
created an ARC GRID that could be used to generate the shaded-relief
map.
Both methods have advantages and disadvantages. The first method
tested uses only ArcInfo, which eliminates the need to write and
compile a separate program. The processing is very time consuming and
the interpolation formulas are limited to those available in ArcInfo.
The second method is more flexible because the interpolation method was
written specifically for the desired result. The processing speed is faster
and more efficient in the second method than in the first. The second
method was selected to complete this project.
CELL SIZE
The cell size of the 1:1,000,000-scale DEM varies depending on the
latitude. Since the elevation points are spaced every 28.125 seconds of
latitude and 18.750 seconds of longitude, the ground resolution ranges in
size from 800 by 600 meters to 450 by 600 meters. The appropriate cell
size used on a given map depends on several elements, such as the
original size and accuracy of the DEM, the geomorphic shapes of the area
displayed, map scale, and software limits. Generally, depending on the
scale, the smaller the cell size is, the better the results are. Nevertheless,
smaller cell sizes can result in large data volumes and long processing
times. The cell size should be appropriate for the map scale. Normally,
on the output product, the cell size of 0.1 to 0.25 millimeters (mm) is
appropriate for small-scale, page-sized maps and 0.3 to 0.5 mm is
appropriate for small-scale wall maps.
Two black-and-white shaded-relief maps were prepared as part of this
project at scales of 1:4,000,000 and 1:6,000,000. A cell size of 0.38 mm
was used for the 1:4,000,000-scale map and a cell size of 0.25 mm for the
1:6,000,000-scale map. This corresponds to a ground resolution of 1,500
meters.
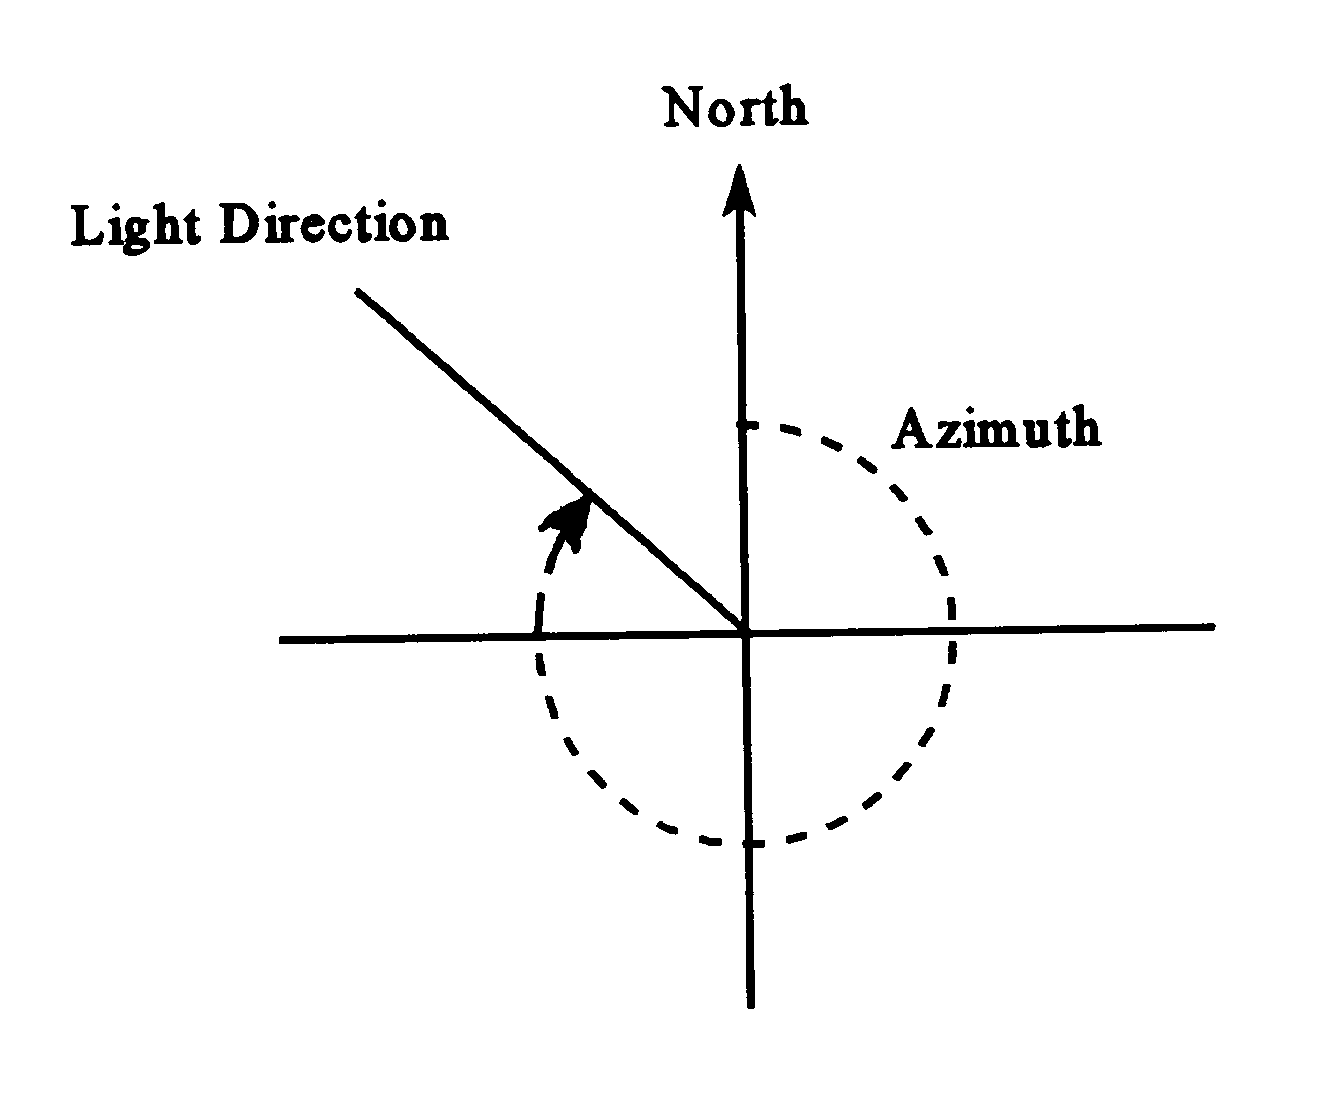
LIGHT DIRECTION AND ALTITUDE ANGLE
Shaded-relief maps can show light coming from any angle; two
parameters used include direction and altitude. To get satisfactory
three-dimensional visual effects, parameters were selected that do not
match the parameters for true sunlight. For this project sunlight came
from the northwest at an azimuth of 315 degrees (figure 2).
           The light angle is another parameter used to enhance the

           three-dimensional effect of the map.  In this project, 45 degrees of

           altitude was used.


           VERTICAL EXAGGERATION

           Vertical exaggeration means that the elevation value of each cell is

           multiplied a certain amount so that the changes in the vertical direction

           become more evident.  For displaying small-scale maps or flat terrain, it is

           useful to exaggerate the elevation values.  But, the higher the vertical

           exaggeration is, the longer the shadow will be when using a low-altitude

           angle for sunlight.  This can cause the adjacent geomorphic shape to be

           hidden within the shadow of a larger feature.  In this study, a vertical

           exaggeration of 5 was chosen.   The azimuth, altitude angle, and vertical

           exaggeration parameters need to be adjusted to get the best visual effect

           for each output product.


           MAKING THE BLACK-AND-WHITE RELIEF MAPS

           The contents of the black-and-white relief maps of China at scales of

           1:4,000,000 and 1:6,000,000 are created from the 1:1,000,000-scale

           DEM and vector features, including the major rivers, roads, railways,

           large cities, names, and boundaries selected from the 1:1,000,000-scale

           Cartographic Data Base of the NFGIS.


           The ArcInfo ARCPLOT module was used for designing the map

           symbols, colors, and structure.  The first step was to create the shade file

           from a GRID file.  Interactive editing can be done if necessary.  The

           shade file was cut using the Chinese national boundary.  In the next step,

           selected features from the 1:1,000,000-scale Cartographic Data Base of

           the NFGIS were transformed into the same projection with the surface

           shade file.  The features selected were national, provincial, and county

           boundaries and names, coastline, rivers, railways, and major roads.

           Symbols, legend, illustrations, and map names were then designed using

           ARCPLOT.  An ARC Macro Language (AML) program was used to

           overlay and register the raster and vector data and create the plot file.  A

           black-and-white version of the map was produced using a Calcomp

           electrostatic plotter (see figure 3 for an example).

           CREATING COLOR RELIEF MAPS

           Based on black-and-white relief maps, the color relief maps were created

           by adding color to each cell according to its elevation.  The original gray

           values of the black-and-white relief maps were used to assign value.  Hue

           and saturation of each cell were calculated with a color look-up table

           according to the cell's elevation value.  The three factors, value, hue, and

           saturation, for each cell were used to create different colors.  The DEM

           processing and plot generation procedures used to produce a color relief

           map were similar to those used to produce a black-and-white relief

           map.


           The principles of the color look-up table for the color design were as

           follows:

             1. The higher the elevation value of each cell is, the darker the color to

           be used.

             2. Color will change smoothly from blue to green, to yellow, to orange,

           and to brown as the elevation changes from sea level to plain, hills, and

           mountains.  Between every two adjacent colors, there is a gradual

           transition of one color to another to make the color change

           continuous.


           The color relief maps of China at scales of 1:2,000,000, 1:4,000,000, and

           1:6,000,000 were also overlaid with vector features, such as boundaries,

           roads, railways, major rivers, cities and counties, and geographic names.

           These maps have similar characteristics to the black-and-white relief

           maps.  In addition, it is easier to understand the terrain characteristics

           when using color.


           CONCLUSION

           The 1:1,000,000-scale DEM of the NFGIS can be used in many ways,

           ranging from analytical studies to the production of a shaded-relief map

           of the country.  Methods that were researched, developed, and tested

           were used to produce shaded-relief maps of China.  This research serves

           as an example of the benefits of the cooperative research on GIS

           technology between China and the United States.