Figure 1: Mojave Region and Participating Agencies.
Kristi L. Sayler
A geographically based image viewer was developed to provide Landsat thematic mapper (TM) image data on the Internet. The viewer was created as part of the Department of Defense's Mojave Ecosystem Database Program (MEDP). The purpose of the MEDP is to develop and compile scientific data layers in an ecosystem-wide geographic information system for the Mojave Desert and to ensure the widest access to and use of these data by making them available on the Internet.
The TM image viewer allows users to browse and select from a geographically referenced database of TM images. After users choose an area of interest from an index map created with ArcInfo, they obtain a list of the images containing the specified area. They can view images from the list and, depending on their web browsers, either print the data for a graphic reference or save the graphic file for inclusion in other text files or reports. In addition, a customer service link is included to enable users to order full-scene data sets. In the future, graphic file output will be augmented to allow for the transfer of georeferenced images with metadata that comply with the Federal Geographic Data Committee's standards.
The viewer is written in the C programming language with supplemental shell scripts. Additional capabilities will be incorporated into the viewer, and similar capabilities can be developed for topographic data or other remotely sensed data for any user-defined study area.
One of the most frustrating aspects of scientific research can be locating existing data that are required to conduct a study. The need for more efficient data search and retrieval mechanisms is growing in today's Internet/World Wide Web(WWW)-based world. Therefore, the clearinghouse concept -- which enables a user to determine what geographically referenced data exist, to evaluate the quality of the data, and to obtain the data -- is becoming more popular.
An image viewer was developed as part of the Department of Defense's (DoD) Mojave Ecosystem Database Program (MEDP). The purpose of this project is to develop and compile scientific data layers in an ecosystem-wide geographic information system that will facilitate the sharing, collection, storage, and analysis of these data among the scientific community. Using the Internet to accomplish this goal seemed to be the best method of ensuring the widest access to and use of these data, and so the concept and the design base for the Mojave Clearinghouse Network (MCN) were created.
Because the DoD is a major land holder in the Mojave ecoregion and is actively involved in land management, DoD staff have legitimate concerns about land management issues affecting the region. The data and derivative products from the MCN will directly support the DoD's military readiness missions conducted in the Mojave region. The MEDP also benefits the Mojave DoD installations by helping them anticipate problems that may be caused by increasing private and commercial land development into and within the region, loss of established military training grounds to nature preserves, or threats to the habitats of endangered species like the desert tortoise.
The MEDP is divided into phases. The first four phases established a framework for the project and provided procedures and resources to compile and deliver available data layers covering the Mojave ecoregion. The U.S. Geological Survey (USGS) had responsibility to define and oversee installation of the hardware, software, and network connections for the MCN. The USGS also developed a prototype "home page" on the WWW with interfaces to the participating DoD agencies. The prototype was developed at the USGS's EROS Data Center and then transferred to the principal MCN server site at the National Training Center, Ft. Irwin, California. One of the principal features of the Mojave home page was the prototype of an Internet image viewer for Landsat thematic mapper (TM) data.
The TM data used with the image viewer were obtained from the Multi-Resolution Land Characteristics (MRLC) Consortium. The Consortium consists of six Federal environmental monitoring programs that have formed a partnership (Loveland and Shaw, 1996). The goals of the MRLC Consortium include the generation of land cover data for the conterminous United States and the development of a flexible and functional land characteristics database that meets the diverse needs of the participating programs and Federal agencies (Loveland and Shaw, 1996).
The TM data make up just one set of the many data layers in the MRLC database. The TM data used in the image viewer have been processed using a standardized set of methods defined by the MRLC Consortium members. These methods include noise removal, radiometric calibration, geometric registration with terrain correction, and spectral clustering. The TM data may be stored in several different projections, but the Mojave prototype uses the TM data in the Universal Transverse Mercator (UTM) projection.
The Mojave region is shown in figure 1. The TM data covers the entire Mojave region with 14 path/row-defined scenes acquired between June and September 1991 and 1993. Each one of these 14 images contains six bands, has a 30-meter pixel resolution, and is stored as a binary, band-sequential image with a separate header file. The size of one image is approximately 325 Mbytes, which makes the Mojave TM data set approximately 4.5 Gbytes.
Figure 1: Mojave Region and Participating Agencies.
The Internet image viewer allows users to browse and select from a geographically referenced data set of TM images. The viewer's purpose, to provide a full-resolution viewing capability to the user, was accomplished by using computer programs written in the C programming language with supplemental shell scripts.
In order to make the large TM images manageable at full resolution, geographic indexing based on USGS 1:100,000-scale (100K) and 1:24,000-scale quadrangles was used to view smaller pieces of the images. The Mojave region is covered by 58 30- by 60-minute quadrangles and approximately 1,430 7.5-minute quadrangles.
The first web page of the image viewer contains a clickable image map of the Mojave region and shows the 100K quadrangle outlines (fig. 2). This image map was made using ArcInfo. When the user clicks on a quadrangle of interest, the map file sends the indexed USGS quadrangle number to a Common Gateway Interface (CGI) script written in the C programming language. This C program uses the 100K quadrangle number to search an index file containing 100K quadrangle numbers and names. After finding the correct name, the program creates the next web page "on-the-fly" by writing the HyperText Markup Language (HTML) directly to the browser. The HTML on the second page includes an image map of the chosen 100K quadrangle (fig. 3).
Figure 2: Image map of Mojave region with 100K quadrangle outlines
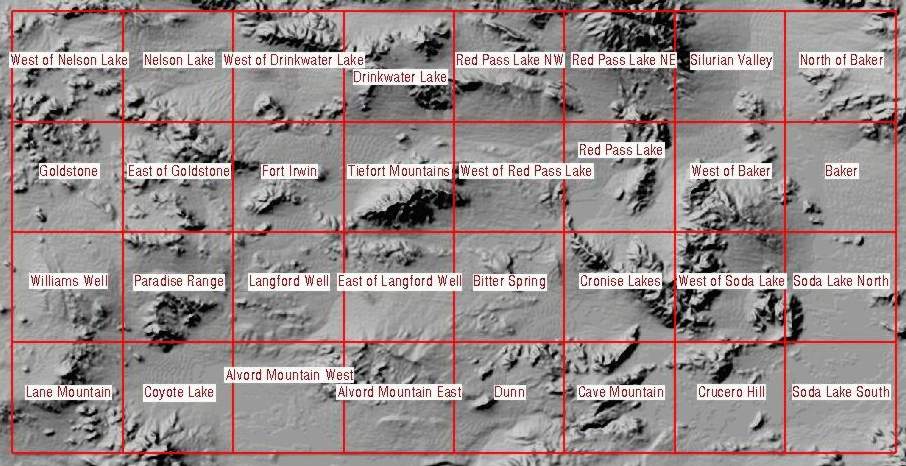
Figure 3: 100K image map with 7.5-minute quadrangle outlines
The 100K image maps were created using ArcInfo to shade a digital elevation model (DEM) and overlay the 7.5-minute quadrangle outlines. The image maps were then stored in a common directory and named according to the 100K quadrangle number (for example, 35116-A1.gif).
The image map on the second web page sends the 7.5-minute quadrangle number to another CGI script written in C. This program uses the number that is sent to the server to search an index file containing the 7.5-minute quadrangle numbers, the quadrangle corner coordinates for upper left (x,y) and lower right (x,y), and the quadrangle names. Once the quadrangle number is found, the corresponding corner coordinates and name are extracted. The corner coordinates are then used to search a TM index file for TM images that contain the 7.5-minute quadrangle of interest. The TM index file contains the list of TM images covering the Mojave region and their corresponding image corner coordinates for upper left (x,y) and lower right (x,y), image acquisition date, path/row numbers, and UTM zone number.
Once an image is chosen that contains the 7.5-minute quadrangle, the C program begins writing HTML code directly to the browser to begin the third page. The third page (fig. 4) is created on-the-fly and contains a link for each successive image that was found to contain the 7.5-minute quadrangle. The third page also contains links to the MRLC Consortium, to TM image information pages, and to the EROS Data Center customer services for ordering information. Each link for viewing a 7.5-minute quadrangle calls the final CGI script used for viewing the TM images.
Figure 4: Third page of image viewer with TM image links
The last script is also a C program. This program takes the information passed to the browser and extracts the 7.5-minute quadrangle area from the larger TM image. The area extracted is based on the computed lines and samples from the image and quadrangle corner coordinates. The 7.5-minute quadrangle image data are checked for zero fill and mapped by using a 2-percent truncation on each end of the histogram and then applying a linear contrast stretch to the data. The image is then written directly to the browser in the Graphics Interchange Format (gif) (fig. 5). By clicking on the image that is presented, the user can save the image as a gif or a postscript file. The user can then go back to the previous page and click on any other links found for the 7.5-minute quadrangle area chosen, or go back another step and choose a new 100K or 7.5-minute quadrangle.
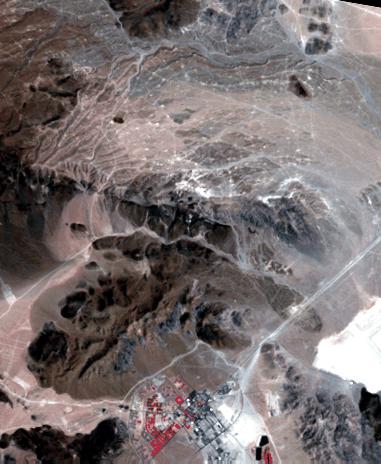
Figure 5: 7.5-minute quadrangle of TM image data
The Internet image viewer is one of the first tools to allow geographically referenced TM images to be viewed on the Internet and to provide them at full resolution. The image viewer may be accessed on the Internet at the URL http://mojave.army.mil/. The browse capability allows users to view and gain some familiarity with remotely sensed data. In the future, the image viewer will be enhanced to allow downloading of 7.5-minute quadrangle-sized pieces of the actual georeferenced TM image data. Downloading data will allow users to experiment with small areas before purchasing a full scene.
Other capabilities for future enhancements may also include providing the data in alternative file formats; providing FGDC-compliant metadata; displaying additional layers of data, such as USGS 1:100,000-scale hydrology and roads, in conjunction with the TM images; and allowing users to draw user-defined rectangular or polygonal areas. Some of these capabilities are being worked on through involvement with the MRLC Consortium that provided the TM images. In the future, the USGS may be able to extend this capability to view any region of the conterminous United States and, thereby, provide an Internet clearinghouse of TM image data.
Loveland, T.R., and Shaw D.M., 1996, Multi-resolution land characterization: building collaborative partnerships, in Scott, J.M., Tear, T.H., and Davis, F.W., eds., GAP Analysis: A Landscape Approach to Biodiversity Planning: Bethesda, Md., American Society for Photogrammetry and Remote Sensing, p. 79-85.
Any use of trade, product, or firm names is for descriptive purposes only and does not imply endorsement by the U.S. Government.
Kristi L. Sayler
U.S. Geological Survey
EROS Data Center
Sioux Falls, SD 57198
Telephone:(605) 594-6058
Fax:(605) 594-6529
sayler@edcsnw43.cr.usgs.gov