
Figure 1: The University Admissions Funnel
Traditionally, university admissions office activities have been both labor-intensive and oriented toward mainly intuitive evaluations of applicants by professional staff experienced with institutional standards, the characteristics of the feeder schools involved, etc. This paper develops an overall conceptual model of the admissions process and points out specific areas within this model where the intelligent application of modern geographic information systems (GIS) technology, linked to effective demographic and geographic analysis, can provide solutions to some of the problems currently faced by university admission offices.
We can set our discussion in context by looking at an analogous application of the technology in the retail store siting industry, which has a decades-old methodology for deciding how demographics and geography can be utilized to support their decision making
As desktop GIS packages have become more robust, consultants and retailers have become more ambitious about the techniques they utilize to obtain and process information to support their decision making. Demographic data, competitor locations, sister store locations, and individual customer locations are used in the analysis. By knowing where the competition is, and perhaps how the competition is doing in that area, a more informed siting decision is possible. It is not unusual for a retailer to evaluate the spending patterns of thousands of customers in a neighborhood when examining the effect of building a new store. The flexibility of GIS technology also allows various 'what if' scenarios to be examined until an acceptable plan is identified.
It is also not unusual for retailers to decide what kind of store would best fit the demographics of the proposed site. Such a decision rests heavily upon the past performance of similar stores built in similar demographic surroundings. Finally, more advanced site analysis uses GIS to bring other important corporate objectives into the decision making process, such as legal and zoning information and franchisee locations. Access to information has enhanced the decision making process based upon sensible application of GIS technology and modern spatial analysis. The question of 'where to build our next store?' has been answered more quickly and, with the proper methodology, more accurately.
Clearly, the GIS technology that is used does not make the strategic or tactical decisions for site analysts, but merely supports them. By representing numerous corporate objectives (profit, return on investment, legal, franchisee relations, expansion, construction cost) in a spatial, map-based context, GIS technology stands ready to present relevant and timely information to support strategic planning as well as day to day tactical decisions. Retailers who add GIS technology to their business process do not find a loss of control over their decision making, but rather a gain, since they are able to make more informed decisions based on information presented in more understandable formats.
In order to make such an evaluation of the potential utility of GIS technology, as well as other tools, one must have a firm conceptual view of how the university admissions process is carried out. The conceptual model outlined here represents our view, based upon significant interaction with college and university enrollment management staff, of this structure. While the details may vary from institution to institution, we are convinced that the basic structure is generally applicable to most U.S.-based situations.
Figure 1: The University Admissions Funnel
An ideal (and completely unrealistic) scenario would have all of the inquiries turned into graduates! Here the funnel becomes a cylinder with no loss taking place at any stage. While this ideal state cannot be attained, it is clear that a low, flat funnel with significant losses at each stage is far less efficient than one with steeper sides and fewer losses. Clearly one of the major challenges of modern admissions work is to find ways to move toward a steeper student recruitment funnel. It is here that modern GIS technology can be of substantial assistance. The role of technology in this instance is not to automate the university admissions process but rather to act as an extension of existing, scarce personnel resources and to lead more effectively to the desired results.
This funnel model suggests two major areas where modern social science technology can significantly enhance existing enrollment operations. The first of these involves the identification of likely prospects, a new and somewhat unusual role for the staff of many university admission offices. Here we are faced with tens or hundreds of thousands of unknown individuals and somehow we must identify among them those that we wish to reach out and contact. The second area focuses upon a significantly different situation. That is, one where instead of a large pool of unknown individuals, we have a much smaller pool where each individual is known to the institution (most likely through his or her submission of an inquiry or application) as well as their relevant attributes. Here the general problem is to decide if a specific individual, who meets admissions standards, is 'likely' to make a positive enrollment decision. So we have two problem areas, one fairly new within the university admissions context and the other quite traditional:
� Identifying those prospects who are most likely to become enrollees or graduates of the institution.
From the hundreds of thousands of prospects, usually unknown to us as individuals, how can the admission office decide which ones to approach? Traditional approaches, such as the acquisition of the names of those students who have taken standard college entrance tests (ACT and SAT) and have indicated an interest in the institution have proven helpful in the past. However even these restricted lists often contain tens of thousands of names and resources clearly do not permit the institution to deal with all of them. How can the admissions office winnow these potential contacts down to a set that appears to be both desirable from the institution's standpoint and that also is viable within the limited recruiting resources available?
� Improving the performance of subsequent stages of the admission process once a specific individual has been identified through their submission of an inquiry or application.
How can yield ratios of inquiries to applications and of applications to enrollees be improved? In which cases and in what amount should financial aid be provided? How will the provision of various levels of financial aid influence the individual's decision to enroll? Is there some way to identify those persons inquiring about the institution who are among those most likely to subsequently submit applications? Can we somehow identify those applicants who are most likely to enroll or graduate from those who have submitted applications and been admitted to the institution?
We will refer to the first of these two areas as the strategic enrollment planning problem and the second as the tactical enrollment planning problem. Different social science technologies are relevant to each. What are the elements of the overall process? How do the various elements fit together? Figure 2 provides an overall conceptual view of the university admissions process.
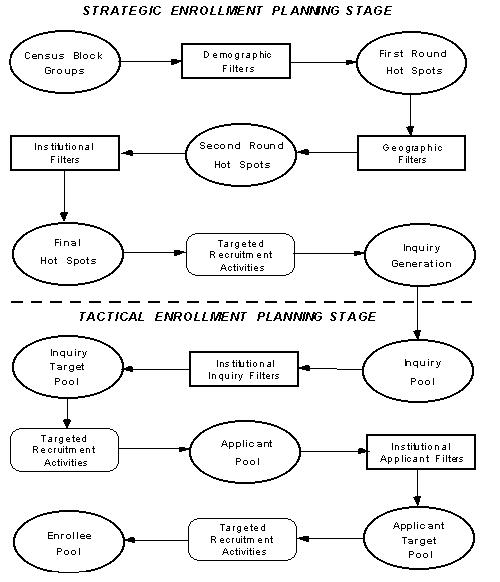
Figure 2: The Strategic Admissions Planning Model
Census block groups (urban) and block numbering areas (rural) are shown as the starting point since these represent the smallest statistical areas for which substantial amounts of standard socioeconomic data are available without violating Federal disclosure laws, and where the areas are also small enough (perhaps 200 households) so that relative homogeneity of the population within them may be assumed.
At times the use of other geographic statistical areas may be suggested, perhaps postal codes (ZIP codes in the United States) are the most common of these. The use of postal code areas, while often relatively easy to accomplish (most addresses already contain a postal code, but the assignment of an address to a standard Census statistical area involves geocoding), is dangerous because of their substantial lack of internal homogeneity and the temporal instability of their boundaries. Basically, postal codes were designed to improve the performance of the mail delivery system and their use as spatial statistical units is quite incidental to this primary function. The easy solution is, as is often the case, not the correct one.
The relevant population (e.g., those in the 14-17 year old range) residing in these small block group areas is defined at this point, and then selection of a subset of the areas, that we will refer to as hot spots, takes place through the application of a series of demographic, geographic and institutional filters. Such subset selection is a necessity since the number of potential students and the number of analysis areas are both quite large. For example, in the state of Ohio there are over 10,000 block groups and these contain nearly two-thirds of a million individuals in the 14-17 year old category.
The nature of the filters that are applied can range from the intuitive judgment of an admissions counselor to the application of a statistical model. The purpose of these filters, at the strategic planning level, is to determine where to direct admissions resources so that there is a joint, high probability of inquiry generation and subsequent conversion of that inquiry into a new enrollee. The demographic and geographic filters can be most effectively applied through the use of GIS technology. This technology is also capable of supporting many of the general institutional filters as well.
We will not examine this planning area in detail in the present paper except to point out two important things. First, that there are statistical procedures, widely used in the social sciences and other disciplines, that can assist in determining if a specific individual in one pool is likely to become a member of a subsequent pool (e.g., inquiries --> applications --> enrollees). The application of models of this sort has been discussed recently by a consulting firm (Hutchins and Bodfish, 1995) but their implementation is flawed since they attempt within a single model to cover both strategic and tactical variables without understanding the fundamental differences that are present.
Secondly, GIS technology can assist in tracking the progress of the admissions stream spatially and over time. For example, the administrator overseeing day to day, or tactical, operations might utilize a GIS application that displays comparisons between small area enrollment forecasts and previous recruiting performance with current enrollment levels. GIS application functions could clearly display whether current counts of admitted students correspond to predicted levels from, say, two weeks earlier or from the average of the two previous years and note any geographic trends in the difference, so that effective action can be taken as soon as the trend is observed. The effect of planned financial aid leveraging plans on the projected admissions pool could be examined as well if these filters include such considerations.
The use of GIS technology for tactical tracking of admissions activities places strong demands upon the records systems that the institution utilizes to record this information. Regretfully, 'timely' retrieval of admissions information is often a matter of weeks rather than days in many institutions. Until this is corrected, the use of GIS technology for 'real-time' tracking of admissions actions will not be effective.
The reader should also understand that if there is an effective implementation of GIS-based strategic admissions planning then those individuals that appear in, say, the inquiry pool should, as a result of preselection, be much more predisposed to make positive enrollment decisions at subsequent levels of the admissions funnel. That is, well structured strategic planning makes the admissions task more effective at all subsequent levels.
Figure 3 shows two student profiles, generated on the basis of the multivariate PRIZM clusters, created at the block group level by Claritas, from two clearly different institutions. From a demographic standpoint, the striking differences between the two profiles (the shaded area in Figure 3 vs. the vertical bars) are easily visible and we would expect that recruitment activities directed toward clusters of potential students making up the second profile would generally not be effective in generating students for the first institution. Either of these demographic filters could be applied to create a set of first round hot spot definitions for the relevant institution. We might, for example, create a simple filter by defining a small group of the Institution 1 clusters that account for, say, about 25% of their entering Freshman class. This filter could then be applied to assist in the identification of those block groups to be subsequently targeted for recruitment activities leading to inquiry generation.
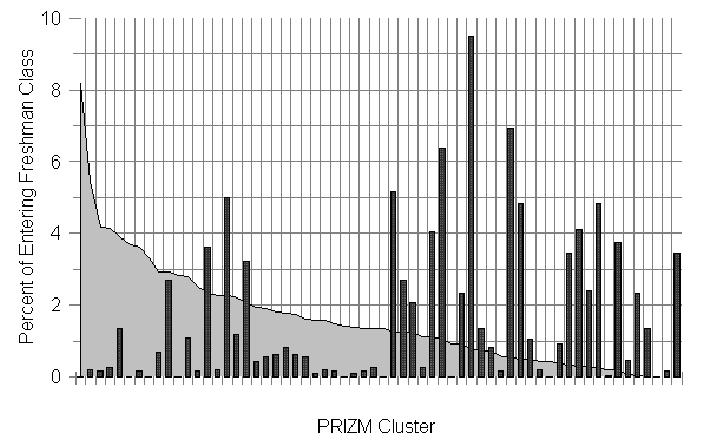
Figure 3: Freshman Class PRIZM Clusters
Years ago, some very simple notions were developed to measure relative geographic importance. A classic example, encountered in 1960s marketing, is the notion of fixed institutional drawing areas. These were circles of fixed radius (magic circles in the terminology of the day) and consumer behavior inside each one was supposed to be significantly different from that in the others. (See Figure 4) For example the primary drawing area for a service station was held to be a circle with a radius of one-half mile, without regard to any other factors. Cross the line, and everything was assumed to be different. Rich or poor, car owner or not, your reaction to the station was based upon the magic circle. We see this in some admissions work today where, for example, a primary drawing area for an institution may be set at, say 63 miles, because some set proportion of the enrolled students (perhaps two-thirds of them) come from within this distance.
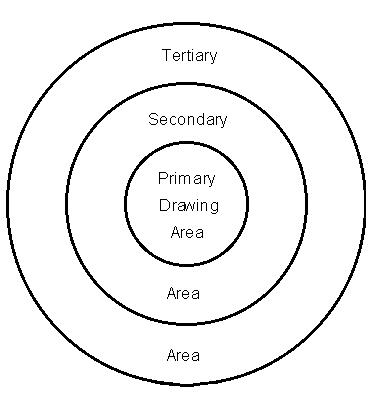
Figure 4: Drawing Areas
Today, and indeed for the last couple of decades, distance from the provider (the college or university in the present case) is generally treated as a continuous variable and its importance is known to vary significantly between demographic clusters. For example, Herries (1995) identified significant differences related to the role of distance to the recruiting institution between students at public vs. private secondary schools. It is also increasingly common to make use of the capability of the GIS to easily measure distance in terms of miles over the street network or travel time instead of simple airline distances.
Location of the potential student with respect to competing institutions is also a factor that must be taken into account. Again, previous work in business geographics supports the notion that different demographic groups may be expected to respond differently to geographic variables such as location relative to our institution and to competing ones. In a recent study (Herries, 1995) a production-constrained competing destinations model was effectively utilized in an examination of geographic factors impacting Freshman enrollment. The model was of the general form:
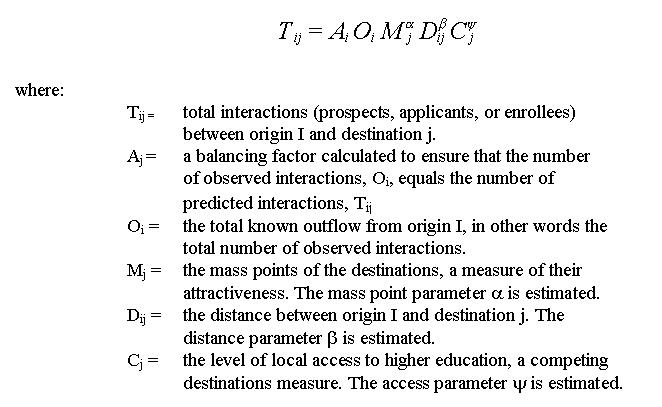
This model can be estimated for all students, public vs. private high school students, white vs. other racial/ethnic groups, etc. Following estimation of the parameters, the model provides a modern geographic filter that can be applied to the demographically defined hot spots in order to further refine the recruitment target areas.
� Identifying those small areas containing a relevant population (e.g., those who are 14-17 years of age) that exceeds a specified size.
� Identifying those areas that appear to be of high enrollment potential where a significant number of applicants or enrollees have not been produced in the past.
� Identifying, for financial aid planning purposes, small areas whose median household income lies above or below a specified threshold.
Many combinations of filters such as these are possible. The result of applying various institutional filters is the creation of a final hot spot list that becomes the basis for targeted recruitment activities. Most admissions offices have substantial experience with the effectiveness of recruitment activities including tele-counseling, direct mail, school visits, etc. The final hot spot list can form the basis for channeling these in a number of ways:
� A direct mail item may be prepared and sent to all households in the target areas. The content of the item may be changed to reflect the socioeconomic character of the specific block group. Addresses of these households are available from commercial sources.
� Telephone calls may be made to the households in the target areas. National telephone books are now available in digital form for under a hundred dollars.
� The GIS may be used to aggregate the target block groups by school district to provide counts of the potential target population in each district. This information can then be used to establish priorities for school visits as well as to structure the focus of these visits.
The combination of demographic, geographic and institutional filters implemented within the context of a GIS is capable of providing substantial assistance to strategic admissions planning and, if local data systems can support it, to tactical admissions operations as well.
GIS technology, when properly applied, can lead to increased awareness of the demographic and geographic structure of the institution's admissions stream. Awareness can then lead to action. Awareness that financial aid award acceptance levels vary significantly as distance from the university changes may prompt further investigation into the nature of competing awards in these areas. Any trends discovered may lead to a shift in recruiting priorities for those areas, e.g. new financial aid award strategies, or additional tele-counseling for students who reside in these areas.
A common GIS adoption path begins with the development of tools which display the geographic component of the big picture, i.e., enrollment yields by county, census tract, demographic cluster, school district, or recruiting territories. For the strategic enrollment planning stage, these high level displays often reveal previously unobserved trends that have been hidden in tabular reports. For instance, the urban - suburban - small town - rural components of the student body. GIS applications at this level are an excellent way to introduce the technology at an introductory level while providing information of real value to the admissions staff.
When the admissions staff has acquired some familiarity with basic GIS products, use of the technology can move to a higher level. Here more complex questions are asked such as the identification of target areas that are jointly of significant population size, with a high potential for enrollment, geographically well located, etc. A major factor in moving to this level is the development of the ability among the admissions staff to think spatially about their problems and to understand how geographic models can be used to address these problems. This cannot be accomplished without education of the admissions staff in these areas. Such education should not be confused with training in the operation of the GIS software.
The outcomes resulting from any GIS application to the recruiting/admissions function depend in large part upon the objectives and expectations established for such a system during its initial development. As mentioned earlier, the technology does not and indeed cannot automate the admissions planning process, but because it is an integrative technology, it offers many new opportunities to more effectively apply limited resources to prioritized objectives. The fact that no such 'admissions GIS kit' exists today in a shrink-wrapped package is not indicative of any limitation of its applicability to the admissions function, but rather that the necessary synthesis of an accepted methodology, related procedures, cost-effective geographically referenced data and software has yet to occur.
Boundary data is necessary to display county, school district and state boundaries for visual purposes. Most of these data are packaged with desktop GIS packages today, or are included with demographic data sets. In addition, many states have created geographically referenced data sources which can be obtained for little or no cost. For example, the Public Utilities Commission of Ohio (PUCO) has in the past kept an updated schools and school districts database which shows secondary school locations and district boundaries.
Demographic data is available on the open market to support the cluster-based analysis activities described here, but the open market currently prices such data in a manner which tends to be prohibitive to even the largest university admissions department (2). Some of the required data elements are available from the U.S. Census, but these do not include the socio-demographic clusters and the data ages rapidly after each decennial Census. Most institutions that currently make use of such data do so through consultants on an ad hoc basis, requiring that well-defined questions be formed and that the consultants be employed on an annual basis. The availability of useful and inexpensive demographic data to the individual admissions department could be accomplished in several fashions, including site licensing on a campus-wide basis that could spread the costs.
Finally, data relating to students and potential students is already being acquired by the universities or collected via recruiting activities. Generally included in these data are student addresses, that can be converted to latitude/longitude coordinates and assigned to standard Census statistical units through a process known as geocoding. Such coding is most effectively done through a service bureau that maintains an up to date matching database and normally does the work for a few dollars per thousand names(3). The value of this geographic coding becomes apparent when comparisons between a map of the most demographically suitable areas in the state for recruitment and a map of student inquiries shows little interest being generated in a number of the prime areas.
Several options exist for recruiters and university administrators with regard to using GIS technology. The first and simplest is to ignore it. It is our feeling that those that do so will find their competitive position considerably diminished. The second option, and the most expensive in the long run, is to employ consultants in piecemeal fashion in an attempt to solve specific, immediate problems, such as identifying specific targets among those students who might enroll for the Autumn term of the 1997-98 academic year. Unfortunately, this is among the more expensive approaches, as such ad hoc consulting work often is. The work that is carried out is often semi-generic with only minimal adaptation to local needs and special data resources. In addition, the institution generally has no continuing access to the data resources upon which the consultant's report is based.
Still a third option is for the institution to go it alone and to attempt to develop in-house the kind of GIS technology and analysis procedures necessary to support its decision making processes. The key to success here is to make use of the academic resources of the institution to provide initial guidance and support for the administrative activity - an approach seldom contemplated by college and university administrators. Several years ago one Big Ten institution that had within its Civil Engineering Department a world-class transportation engineering group ignored this resource and employed a consulting firm to create a master traffic plan for the campus. The resulting plan was expensive and unworkable since it had been based upon incorrect assumptions about the future actions of both the town and the university.
The college or university admissions department that considers local action to apply GIS technology to support strategic planning in the admissions area faces the need to address a number of technical and organizational issues. The use of the technology requires the development of new technical skills among the admissions staff as well as the acquisition of new equipment, software and databases. This is costly and immediate results are often difficult to obtain because of the steep learning curve. Our experience has shown that this is a difficult, but manageable process. However there is another cooperative approach that we feel would both ease the introduction of the technology and significantly reduce local costs.
This fourth option, the one that appears to us to hold the most substantial promise, involves key industry data and software providers working with universities or groups of institutions, such as all the state institutions of higher education in Ohio, to develop a common set of tools and data sources to support the methodology described here in a manner substantially less expensive to the individual institution than the 'go it alone' approach. Academic institutions do not appear to be as concerned about cutthroat competition for students as retailers are for clothing and food dollars. Also different institutions in the same general area, e.g., Ohio, often serve different demographic and geographic markets and such a cooperative venture could prove to be quite fruitful as well as less expensive to each institution.
A major shift in emphasis is found in this paper when compared to even the most progressive university admissions offices in the United States. While demographic factors are used to filter inquiries and to assist in financial aid decisions by some institutions, the explicit consideration of relative location and geography is clearly at least equally important although usually poorly addressed by consultants who do not clearly understand it.
Other industries have successfully applied GIS technology once they have established general methodologies for its application. A significant difference exists between the analogous retail site selection function and the university admissions functions. While both are interested in meeting the needs of the consumer in a manner which support numerous, sometimes conflicting organizational goals, the typical university admissions department has far less budget to adopt GIS technology than does the retailer. The retailer can measure the cost of not adopting the technology by calculating the cost of having siting done by outside sources. The cost of a university missing critical trends in its admissions streams is more difficult to calculate but is recognized as significant, not merely in terms of dollars, but also in opportunities lost for both the student and the university. Explorations to date with the application of GIS technology in university admissions have indicated that and enormous potential value for strategic and tactical admissions planning exists, but there is also some uncertainty about how that potential can be realized.
None of this need be an insurmountable barrier to the adoption of the methodology and associated GIS technology discussed here. The shared responsibility of educating the nation's college students should provide an impetus to foster cooperation among key universities, data providers, software developers and consultants to develop a tool kit for admissions planning and recruitment. The hardware, software, data and methodology exist. All that remains is leadership and cooperation among the parties involved.
Grimshaw, David J., 1994. Bringing Geographical Information Systems into Business. London: Longmans Scientific & Technical.
Herries, James P., 1995. 'The Land-Grant Public University in a Competitive Market: An Evaluation of Freshman Enrollment Attraction of The Ohio State University,' unpublished M. A. thesis, Department of Geography, The Ohio State University.
Hutchins, John C. and Scott Bodfish, 1995. 'Building a Comprehensive Model for Predicting and Shaping College and University Enrollment,' paper presented at the AMA's Sixth Annual Symposium for the Marketing of Higher Education, Chicago, IL.
Marble, Duane F., et al, 1994. 'A Geographic Information System for the OSU Office of Admissions and Financial Aid,' unpublished report, Geographic Information Systems Laboratory, OSU Department of Geography.
________, Victor J. Mora, and James P. Herries, 1995. 'Applying GIS Technology to the Freshman Admissions Process at a Large University,' Proceedings, 1995 Esri User Conference. Esri: Redlands, CA. Note: this paper is available as an HTML document from http://thoth.sbs.ohio-state.edu and from http://www.Esri.com.
Martin, D., 1991. Geographic Information Systems and Their Socioeconomic Applications. London: Routledge.
2. Claritas makes much of its basic data available to colleges and universities at a substantial discount. Although some restrictions apply, the database has been available for both academic and administrative functions within the institution.
3. In our work we have made use of the geocoding services supplied by Geographic Data Technology of Lebanon, NH. Matching rates have consistently run between 85 and 90% using address files that were prepared by a number of different individuals working without specific address formatting instructions.