Mark Wimer
Building and Using a GIS to Manage a
Breeding Bird Atlas
Abstract
Breeding Bird Atlases are intensive field projects to map breeding bird distribution over an entire county or state. A breeding bird atlas divides a state or county into manageable regions and a grid, e.g. 10 square miles, for volunteer surveying. In each grid cell or block, field volunteers survey a representative of each habitat to look for proof of breeding, such as birds carrying nest material. The goal of the Los Angeles County Breeding Bird Atlas is to publish an atlas, with distribution maps and a text summary for each of roughly 200 species. A second goal is to end up with a data set in digital format that can be linked to other existing and future natural resource inventories. GIS is an ideal tool for managing such a project at relatively low cost on a desktop computer. Including GIS in the design of the database and maintaining a link to a GIS during the project allows for visualization of progress throughout the project. Our Atlas Project is using ArcView maps to 1) demonstrate and evaluate progress, and 2) to ask questions about quality of the data during the project and therefore allow time for correction.
Introduction- the goals of a breeding bird atlas
The goal of the Los Angeles County Breeding Bird Atlas (LACBBA) is the documentation of breeding distribution of all bird species in the county, to be published in book and CD-ROM form as an Atlas. The timeline for this project is five years of field work (1995-1999), with analysis and writing to begin during that time. We plan to publish the Atlas a year after completing field work that includes the following objectives:
- To produce species distribution maps for each of the roughly 200 bird species breeding in the county, which will be a baseline against which to compare future breeding diversity.
- To present an analysis (in species accounts with the maps) of breeding distribution based on environmental features from overlays such as elevation, precipitation, and habitat features if possible.
- To create geographically correct maps that will be useful to other studies of natural resources in the county, and that can be linked to the other 18 atlas projects underway or finished in California.
- Generate an idea of species population density (within an order of magnitude) and of breeding chronology for each species account.
I will address LACBBA uses and setup of the GIS in coordination of volunteer effort, including: 1) choosing a grid system and dividing the county into regions, 2) setting up and linking the database (we use MS Access), 3) potential biases in data collection, and therefore in maps, 4) methods of getting digital data and software. Management uses of the GIS include: 1) visualizing progress by region and over the entire county, 2) assessing data quality and gaps in data collection, 3) demonstrating progress to volunteers to maintain levels of interest and coverage. The paper will also make recommendations for other fledging breeding bird atlas projects.
Building and Maintaining Our GIS
Choosing a grid system
A variety of grid systems have been used for Breeding Bird Atlases around the world, based on 2.5 km to 10 km, latilong grids, hexagons, or divisions of existing topos as our atlas used. Although setting up a grid based on UTM for every atlas is ideal, several factors make a uniformity impractical. One is the purpose of the atlas, for instance if you want general range maps over a larger area or layers you can interpret using habitat overlays. Numbers of volunteers, funding, and technical assistance all play roles in selecting a grid.
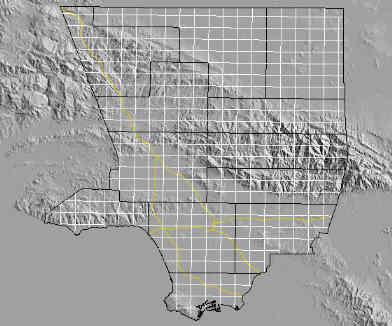
The LACBBA uses 1/6th of a topo sheet as an atlas block, based on ease of use and preparation. The size is not greatly different (about 5%) from other county atlases in California that are using 5km grids, although one small county (Marin) did their field work based on a 2.5 km grid.
The atlas blocks were also grouped into 12 regions (black lines above) for local coordination based on bioregions and access.
Software implementation and training
Many GIS projects are implemented using large budgets, intensive training, and multiple full time personnel. A breeding bird atlas at the county level is unlikely to get the funding necessary for such a large implementation. The finite time frame of the project makes the required commitment somewhat less anyway, and the simplicity of starting a useful GIS using ArcView meant that we could avoid a costly implementation.
The GIS was set up beginning several months into the project, and the database had already been built in Microsoft Access 2.0 on a Windows PC.
No money or time was set aside in the planning stages for GIS training. The Atlas project is entirely volunteer except one half-time paid coordinator, who was computer literate but had for GIS experience one recent University course in ArcInfo. The project was able to get off the ground with GIS because of donations of both GIS software (from ECP) and because someone very experienced in GIS donated our basic themes to get us up and running.
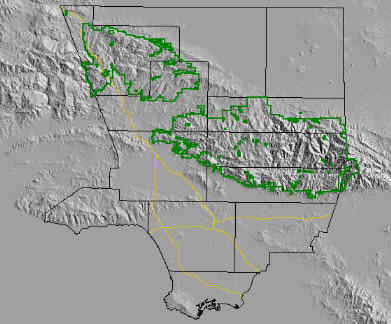
Some of our layers include roads, a tiff image digital elevation model, and landuse (green is the Angeles Forest boundary):
Data Entry and System Maintenance
A single database is used for all aspects of Atlas Project management, from species sightings to newsletter mailings. The database is in MS Access 2.0 and is set up as follows:
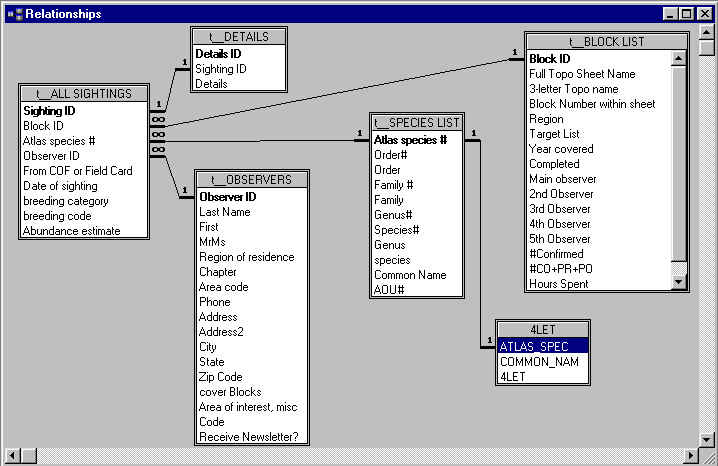
One maintenance cost that is easy to overlook in the planning stages is the cost of software (and hardware) upgrades. Our database software has gone through two upgrades since we started, and ArcView has also been upgraded to add tools such as Spatial Analyst. Also, a 486 DX2 PC seemed adequate when we started, but software upgrades demand greater processing power.
Maps and Data in Action
Visualizing Progress and Data Verification
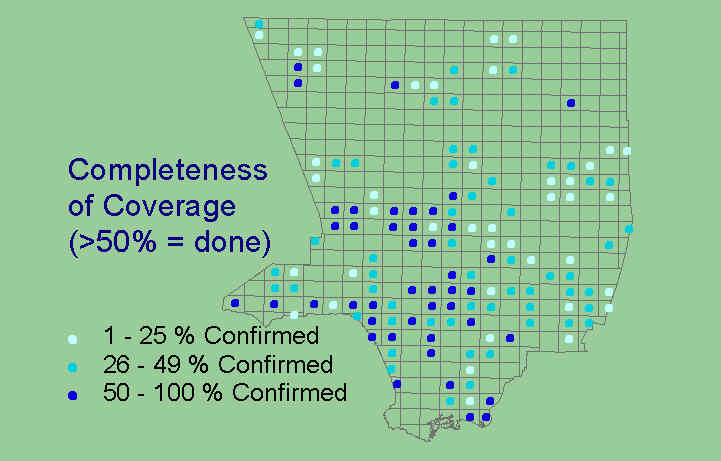
What we have after two years of data collection can be visualized in part as coverage maps and species maps. A coverage map: shows volunteer progress, areas of less volunteer activity.
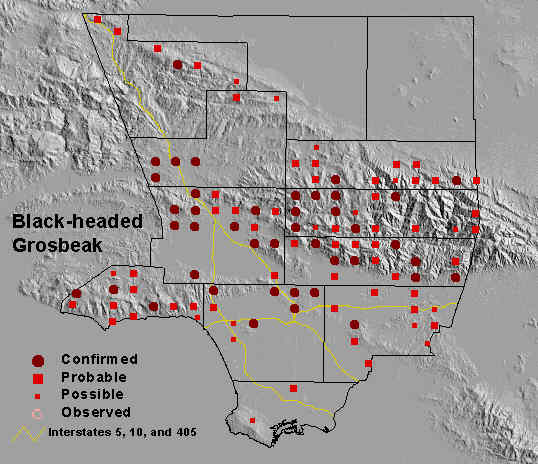
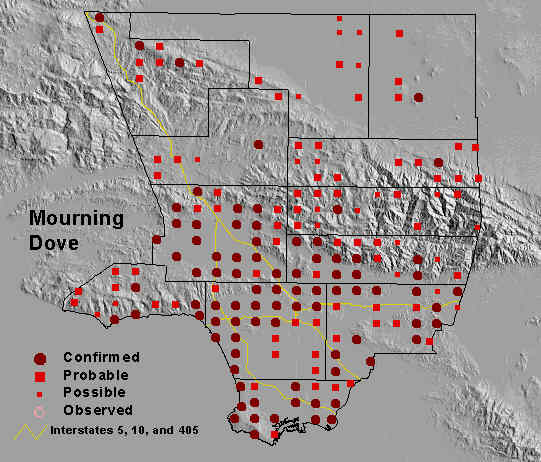
Sample species maps shows progress in another way. Volunteers can see their data being used and feel good about it. Coordinators can see where there are gaps, where neighboring blocks all have breeding evidence for Black-headed Grosbeaks or Mourning Doves but one volunteer block has similar habitats and has likely missed this species. (On the following map many blocks have not yet been covered however).
Major Uses of Atlas Data
Why is an Atlas Project a conservation project? The Atlas identifies areas of high bird diversity. The number of breeding species per atlas block so far in Los Angeles County ranges from 18 to 75. A researcher looking for areas of high species diversity worth protecting will have a good start with the Atlas. The atlases in California and other places are used in the process of determining which birds should be on the Species of Special Concern Lists. Also, the Atlas is a baseline ecological monitoring project. And it will help resource managers at the county level and below, conservationists, and developers make more informed decisions. Another conservation related activity of the Atlas is educational: it teaches the 200+ volunteers a basic tool for monitoring the environment, and gets them out into that environment to use the tool.
Here are some of the folks who have already requested Atlas data and maps include:
- University professors and students working on a particular species and wanting distribution information.
- Forest Service biologists wanting information to help manage certain areas.
- Biological Consultants working in a certain area, looking for endangered species.
- Local conservation groups wanting breeding evidence to help protect open space.
- Fish and Game and other agency biologists looking to amass statewide distribution information for a certain species.
A Few recommendations for fledgling atlas projects
These recommendations are GIS considerations only.
- Budget money for the necessary computer, software, training, and setup work for a GIS before the field work starts. Many local scale atlas projects suffer from too little funding, but volunteer efforts are diminished if their efforts cannot be monitored and demonstrated. Many larger scale atlasing or other GIS and biodiversity efforts have several staff members, such as one database person, one GIS person, and another to coordinate volunteers.
- If at all possible, include people in the planning stages of your atlas who have proven hands on experience with GIS and customization of software. While we have not had major difficulties using our software, making use of the full power of the applications takes more than just familiarity with the applications.
- If the project cannot include such a person, copy from a successful project that is already underway. This is only now becoming possible. Many previously published atlas projects hired full time programmers, sometimes over the course of years, to produce maps of larger computers. Most atlas projects completed to date are not in the .eOO format or other standard coverage formats, and are therefore less immediately useful.
Acknowledgments
The LACBBA gratefully acknowledges the help of volunteers who run nearly every aspect of this project. Also, the GIS portion of the LACBBA would not be possible without Esri software donated by the Esri Conservation Program, nor without the assistance of Rusty Scalf in setting us up with our basic grid, DEM and other themes.
Breeding Bird Atlas Web Sites -
Atlas projects and their uses on-line