What if? PSS is being jointly developed by LDR International, Inc. (LDR), Data Chromatics, Inc. (DCI) and Community Analysis and Planning Systems, Inc. (CAPS). LDR is a planning and urban design firm with an international practice and has developed award-winning comprehensive plans for cities, counties, and regions. DCI is a leading-edge computer technology that specializes in developing and applying new GIS applications. Richard Klosterman, President of CAPS, is a nationally known expert in developing GIS-based tools and computer solutions for a wide range of planning applications.
This paper describes the components of the What if? PSS system, the analysis procedures incorporated in the model, the general procedures for using the system, and sample model outputs. The paper includes three major sections. The first section, System Overview, provides a general overview of the What if? PSS system and the modeling process incorporated into the model. The second section, Using the Model, describes the major components of the system and the general procedures for using each component. Sample system screens and outputs are also described. The final section, Model Enhancements and Further Information, identifies sources for further information on the What if? PSS system.
o Viewing Information. What if? PSS's "Base Data" option allows users to select, view, and print maps and reports displaying currently available information on all aspects of the study area.
o Suitability Analysis. What if? PSS's "Suitability" option allows the user easily to select the environmental factors to be used in determining the relative suitability of different locations for different uses, and to specify the relative importance of alternative suitability factors and the ratings for the different factor types. These values are used to generate suitability maps and associated reports showing the relative suitability of different locations for different land uses.
o Projecting Demand. What if? PSS's "Growth" option employs user-specified growth factors to determine the projected demand for different land uses in each projection year. Growth characteristics which can be specified by the user include: projected population and employment growth at ten-year intervals, the characteristics of future housing, assumed employment densities, and desired quantities of agricultural, forestry, and environmental protection land. The projected demands are converted into the equivalent demand for different types of land which can be viewed in summary reports.
o Allocating Projected Demand. What if? PSS's "Allocation" module allocates the projected demand for land to different locations on the basis of their relative suitability for alternate uses and user-specified land use controls and infrastructure expansion plans. The model outputs predicts future land use patterns at ten-year intervals for the study area and for sub areas such as political jurisdictions. These outputs can be viewed in maps and report formats.
UAZs are created by using GIS overlay functions to combine all of the relevant layers of information to define the UAZs to be used in a study area. The map layers can contain information on natural conditions (e.g., slopes, soils, and scenic vistas), existing and proposed infrastructure (e.g., the proximity to intersections or major roads and the availability of sewer and water service), and land use controls such as zoning districts and planned land uses. The PSS combines these layers to produce UAZs which contain information from each of the constituent layers, i.e., each UAZ contains information on the slope, the availability of sewer and water service, planned land use, and so on for all points lying inside of it.
What if? PSS projects future land use patterns by balancing the supply of, and demand for, land suitable for different uses at different locations. Alternative policy choices can be incorporated into the model it two ways. First, different map layers can be added to represent alternate policy choices, e.g., alternative land use or infrastructure expansion plans. Policy choices can also be incorporated into the model by applying them directly to the appropriate UAZs, e.g., by increasing or decreasing the allowable development densities for all of the UAZs located in a particular township or municipality.
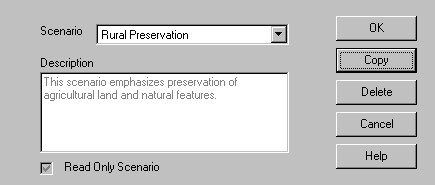
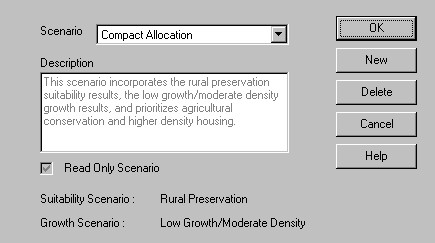
User-defined alternative visions for the area's future can be easily explored by defining alternative suitability, growth, and allocation scenarios. For example, one scenario could determine the effect of continuing current development policies. Another scenario could consider the impact of policies that severely limited growth in scenic areas and on land highly suitable for agricultural uses. Still another scenario could determine the implications of allowing growth to continue until it reached specified density levels for all developable parcels in the study area. Which UAZs are developable would be determined by policy assumptions specified by the user. These alternatives express in concrete policy term's alternative development scenarios which can be referred to by user-defined labels and text descriptions.
The modeling process is iterative in that, for a particular scenario, users start with a set of assumptions about land use suitability and another set of assumptions about projected growth demands. When these assumptions are combined with assumptions about land use controls and infrastructure plans in an allocation scenario they may find that there is insufficient land for a particular land use. This, in turn, would require that some suitability, growth, or allocation assumptions are changed. Users must then re-run the model to see if the new set of assumptions produce a more appropriate allocation.

The following description of What if? PSS's Suitability option is divided into four sections. The first section provides brief definitions of the terminology used to describe the suitability analysis process. The second section discusses the general procedure which the model uses to determine the relative suitability of different locations. The third section reviews the forms which the system provides for entering the required suitability data. The final section describes What if? PSS's suitability outputs.
Suitability Factors. "Suitability Factors" are the characteristics of the land that will be considered in determining the relative suitability of different locations for alternative uses. The factors to be used for a particular land use are specified by the user and can include the full range of natural features including slopes, soils, wet lands, aquifer recharge areas, flood plains, scenic areas, and hazardous areas.
Factor Weights. "Factor Weights" are numerical scores indicating the relative importance of the different factors used to determine the relative suitability of different locations for a particular land use. Thus, for example, the Slope factor could be given a factor weight of 2 and the Soils factor could be given a factor weight of 1 to indicate that slope is considered to be twice as important as soils in determining a site's suitability for a particular land use.
Factor Types. "Factor Types" are the set of possible values for a particular factor. Thus, for example, there could be five different slope types in a particular location, e.g., Less than 10%, 10% to Less than 15%, 15% to Less than 20%, (4) 20% to Less than 25%, and (5) 25% and above.
Factor Rating. "Factor Ratings" are numerical values indicating the relative suitability of locations with a particular factor type for locating a specified land use. Thus, for example, factor ratings can be specified for each of the five slope types listed above to indicate the relative suitability of each slope type for locating industrial land uses. What if? PSS allows the user to rate each factor type on an five-point scale. Zero values can also be used to exclude development from areas corresponding to a particular factor value (e.g., all areas with a slope of 25% or more).
Suitability Score. The "Suitability Score" is a numerical value indicating a location's overall suitability for a given land use when all of the factors are considered. The suitability score for a particular UAZ is determined by: (1) multiplying the UAZ's factor rating for each factor by the corresponding factor weight; and (2) summing these products. Suitability scores are computed for all UAZs and all land uses.
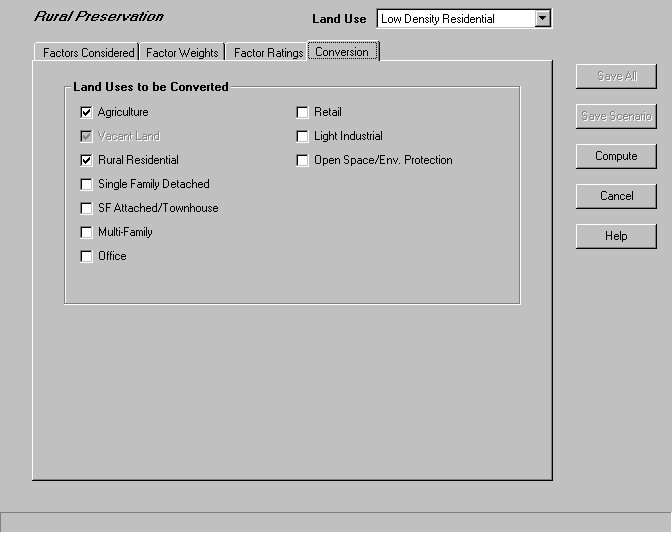
Land Use Conversion. "Land Use Conversion" refers to situations in which an area's land use changes during the development process from one land use to a different land use. Thus, for example, an area which is currently is devoted to agricultural uses may be converted to industrial uses during the growth allocation process.
Identifying Suitability Factors. The user must first identify the suitability factors to be considered for a particular land use. Different factors may be selected for different land uses; for example, distance from freeway interchanges may be important for locating retail and office establishments but not important for locating single-family developments. As a result, suitability factors must be selected for each land use considered in the study.
Specifying Factor Weights. Next, the user must specify the factor weights, i.e., the relative importance of each factor in determining a UAZ's suitability for a particular land use. Factor weights are assigned on a five-point scale from 1 (low) to 5 (high). Factor weights must be assigned for all suitability factors land uses considered in the analysis.
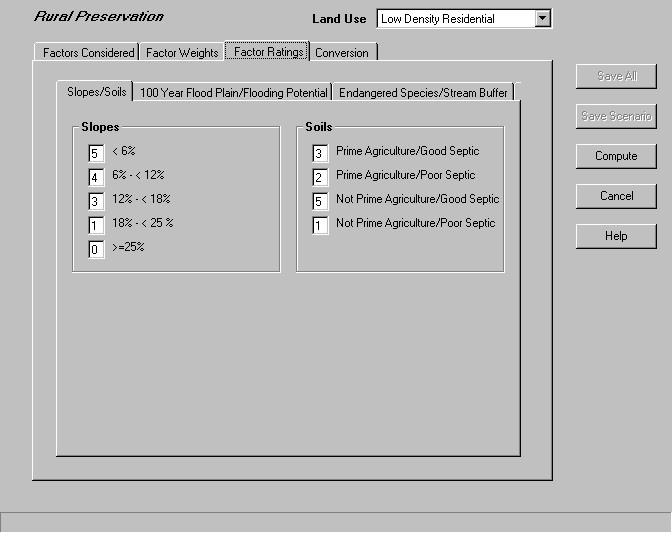
Specifying Factor Ratings. The user must then specify ratings for each factor type, e.g., for each slope type, each soil type, and so on. The factor types are rated on an six-point scale: 5 (High), 4 (Moderately High), 3 (Moderate), 2 (Moderately Low), 1 (Low), and 0 (Excluded). As its name suggests, the Excluded category identifies areas from which development is to be excluded, regardless of its rating on other factors. For example, the user can specify that development is to be excluded from the 100-year flood plain, regardless of an area's suitability with respect to the other suitability factors. Factor ratings must be specified for all of the factor types land uses considered in the analysis.
Computing Suitability Scores. The model then computes the factor scores for each UAZ by multiplying the factor weights by the corresponding factor rating and summing these values. The resulting suitability scores are then used to prepare suitability maps and to allocate projected demand to alternative sites, as described below.
Command Buttons. The Suitability Scenario Assumptions form contains the following five buttons: (1) the Save All button is used to save the scenario assumptions and suitability analysis results; (2) the Save Scenario button is used to save the scenario assumptions but not the suitability analysis results; (3) the Compute button is used to perform the suitability analysis but does not save the scenario assumptions or analysis results; (4) the Cancel button returns the user to the main What if? PSS form, abandoning any changes to the assumptions; and (5) the Help button is used to access the system's on-line help.
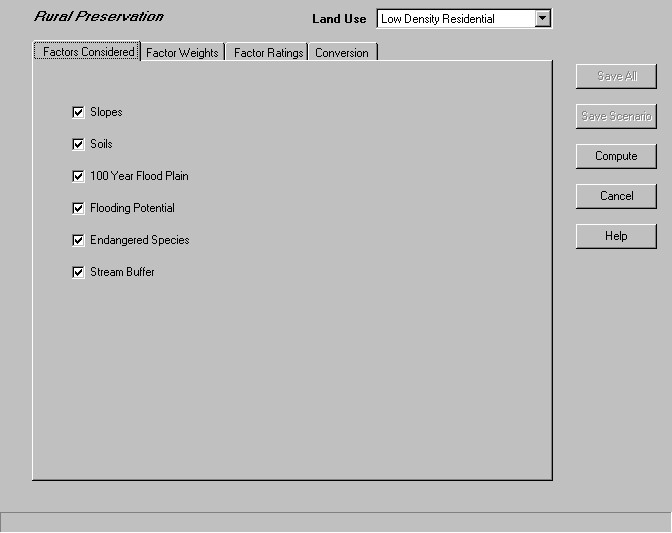
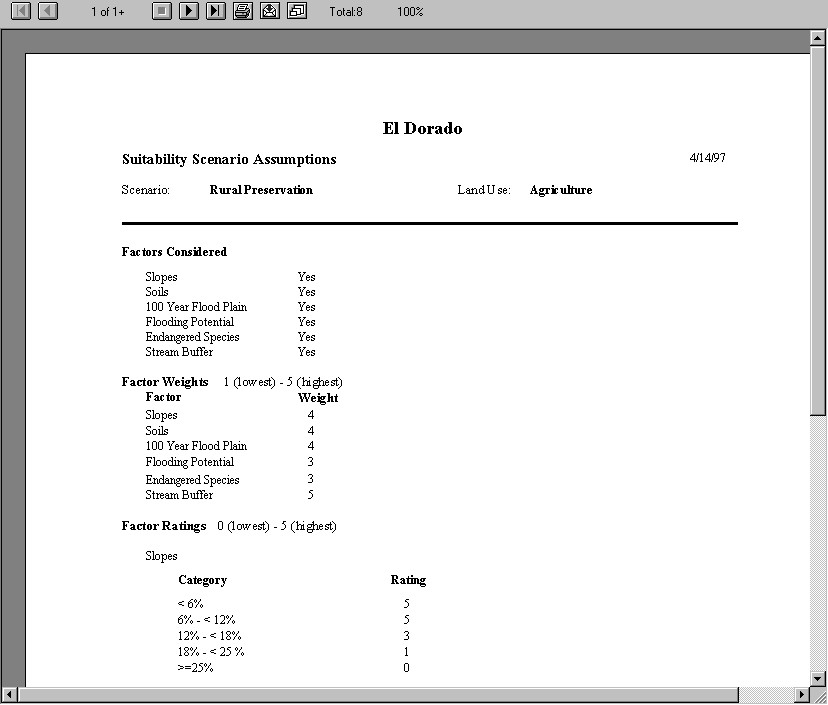
Factors Considered Sheet. As shown in Figure 3, the Factors Considered sheet contains a series of check boxes which are used to specify the suitability factors to be considered for a particular land use for the current suitability scenario. Thus, for example, in Figure 3 the user has specified that all of the suitability factors should be considered in determining the most suitable locations for low density residential development. Suitability factors must be specified for each land use.
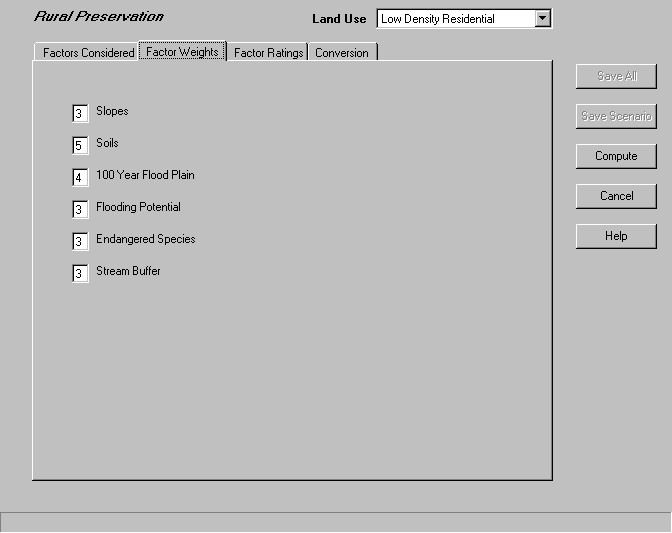
Factor Weights Sheet. As shown in Figure 4, the Factor Weights sheet is used to specify the weights to be assigned to each factor. The factor weights are used to reflect the user's perception of the relative importance of the suitability factors selected on the Factors Considered sheet; the values can go from a low value of 1 to a high value of 5. Thus, for instance, Figure 4 indicates that the user feels that Soils is the most important factor for locating Low Density Residential land; the 100-year flood plain is the second most important factor; and the remaining factors are less important. Factors which were not selected on the Factors Considered sheet are dimmed out, indicating that factor weights should not--in fact, cannot--be specified.
Suitability Analysis Maps. As shown in Figure 7, What if? PSS's Suitability View Scenario Maps option generates a map showing the relative suitability of different locations for each land use considered in the model. Each location's suitability is scaled from "unsuitable" to "high" based on the factor weights and ratings for the selected suitability scenario. Suitability maps for each land use can be viewed by selecting the desired land use category from the drop down list and clicking on the Render Map button.
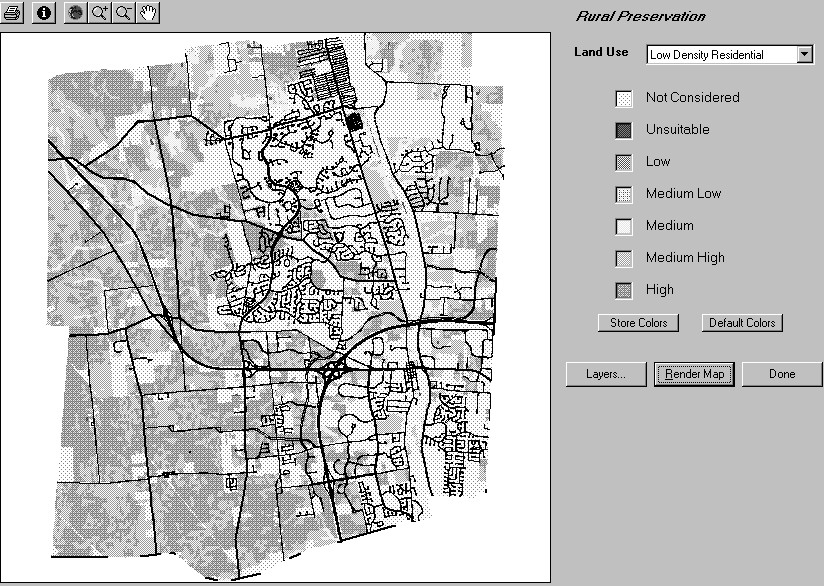
A default color is provided for each suitability category. The user can change any color by clicking on the colored box in the map legend. The user can also display additional map layers by clicking on the Layers... button. The user can select the color, weight and fill style for each of the layers.
After selecting colors for each suitability category and appropriate fills and styles for the map features, the user can display the map by clicking on the Render Map button. The maps can be sent to the printer by clicking on the printer icon. The map display also includes the standard information, map extent, zoom in, zoom out, and pan buttons. Clicking on the Done button returns the user to the main menu.
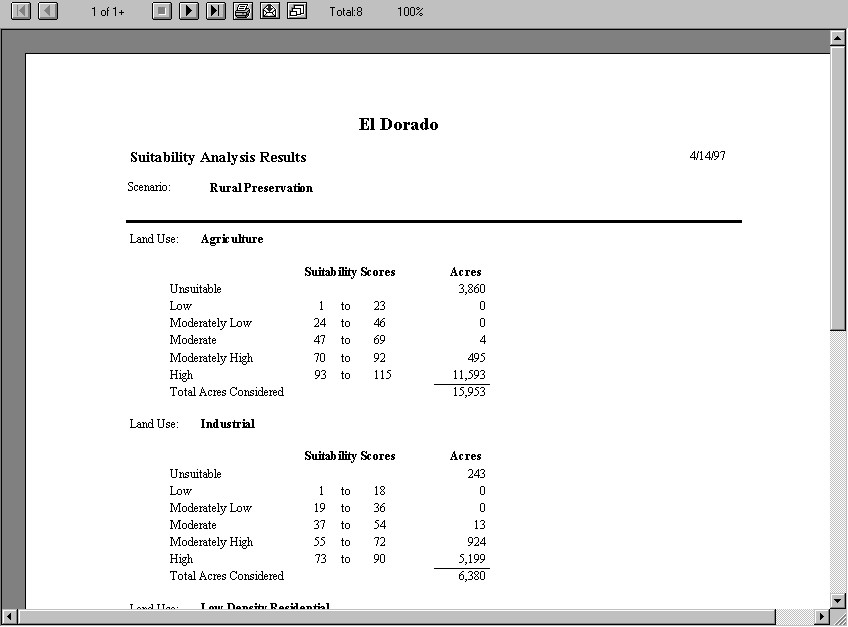
Suitability Analysis Report. As shown in Figure 8, What if? PSS's Suitability View Scenario Report option generates a report which identifies the number of acres within each suitability class for all land uses for a specified suitability scenario. The report can be reviewed on screen or printed by clicking on the printer icon.
The following discussion of What if? PSS's Growth option is divided into three sections. The first section describes the general procedures that are used to compute the four different types of land use demand. The following section considers the forms that are provided for entering the required information on the different types of demand. The final section discusses the outputs provided by What if? PSS's growth option.
The projected number of households in each projection year is multiplied by user-specified values for the proportion of the new housing units for each housing type (e.g., large-lot residential, multi-family, and so on). User-specified values for the assumed vacancy and loss rates are used to convert these values into the projected number of housing units that will be required in each year. Subtracting the number of existing housing units from this value and dividing by the assumed housing densities yields the projected demand for additional residential land for each housing type in each projection year.
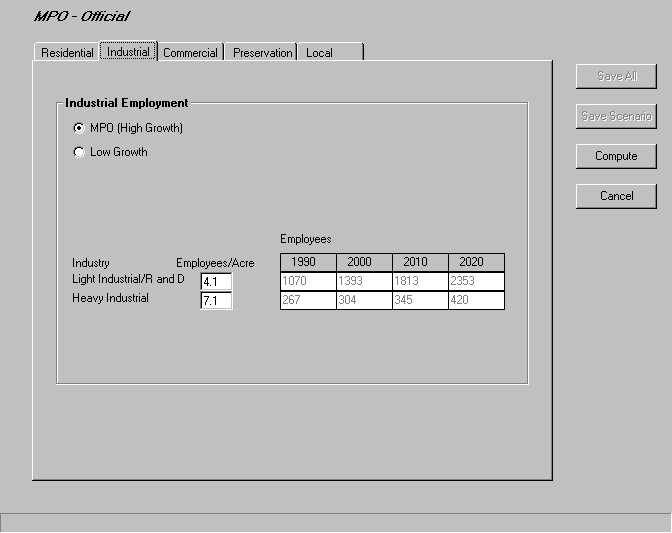
Computing Regional Business Land Use Demand. The procedure for computing the projected demand for regional business (industrial, regional retail, and office) uses begins by allowing the user to choose between independently developed projections for the employment for each business use in each projection year. The user then specifies the assumed employment density (employees per acre) for each land use category. The system then subtracts the existing employment in each category from the projected values and multiplies this value by the assumed employment densities to compute the total number of additional number of acres that will be required in each projection year for each type of regional business demand.
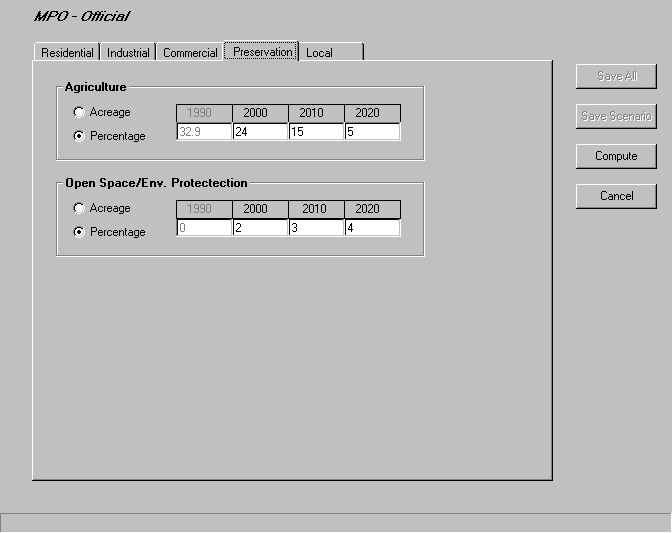
Computing Preservation Land Use Demand. What if? PSS includes procedures for specifying the amount of land to be preserved for environmentally-oriented uses such as agriculture, forestry, and open space/environmental protection. The system permits the user to specify the amount of land (either the number of acres or the percentage of the study area's land) to be preserved for each preservation use in each projection years. These values are stored as land use demands in the system along with the other land use demands.
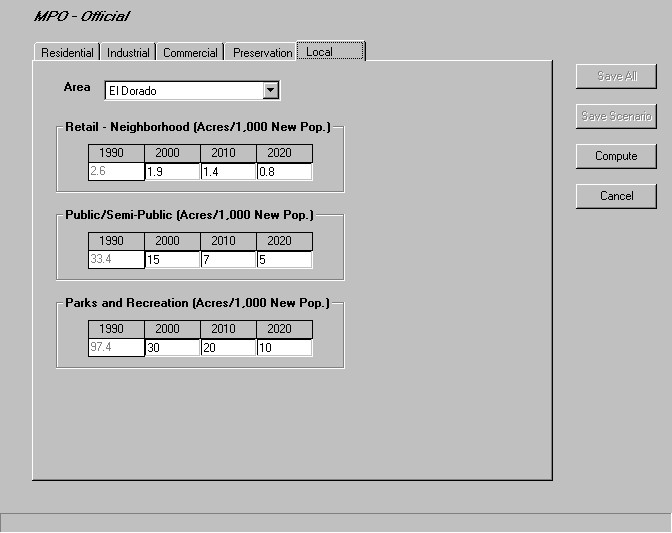
Computing Local Land Use Demand. What if? PSS also provides procedures for computing the future demand for local land uses such as parks and recreation areas, local retail uses, and public and semi-public land uses. These uses are incorporated into the model in the form of user-specified standards for the required amount of land per thousand persons for each land use. These values are multiplied by the projected population for each political jurisdiction in each projection year to compute the total amount of land that will be required for the local land uses in each projection year.
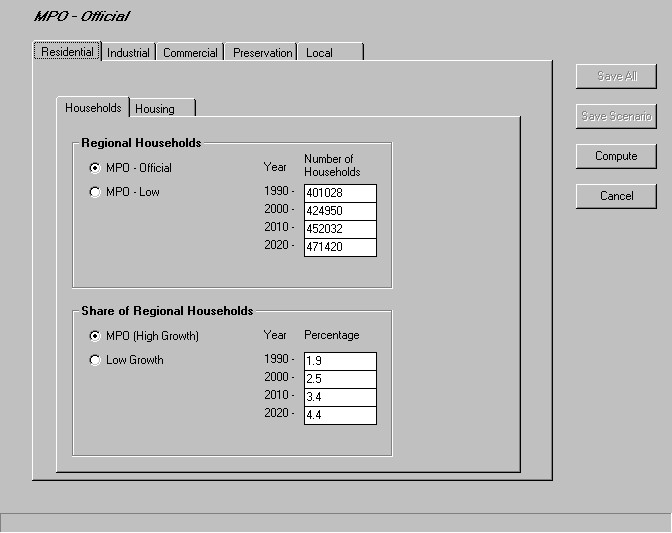
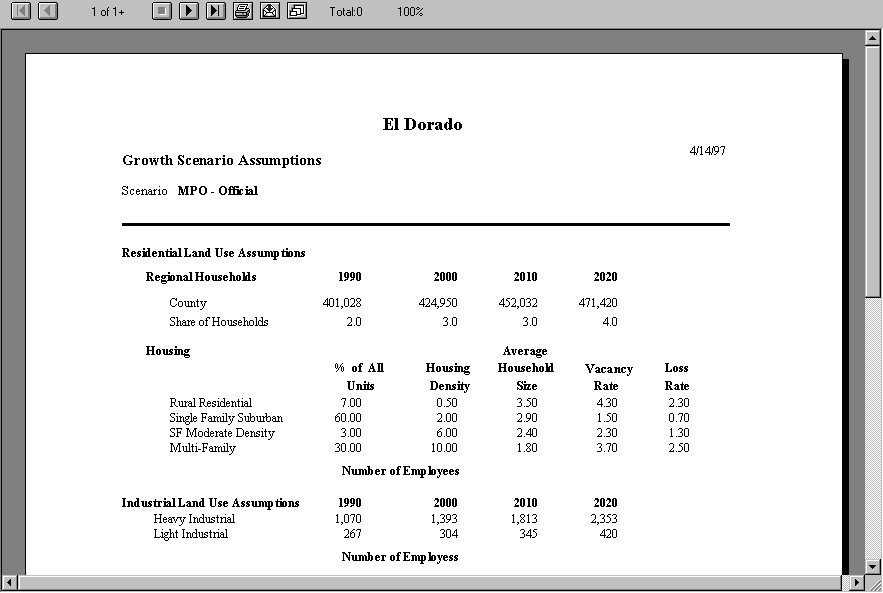
Residential Sheet. As shown in Figure 10, this sheet contains two tabbed sheets which are used to specify the factors which will be used to determine the projected demand for residential land. The first sheet, labeled "Households" allows the user to select between up to five independently developed projections for the total number of households in the region (e.g., county) in which the study area is located. It also allows the user to choose between up to five independently developed projections for the study area's share of the regional population. These two values are multiplied to compute the projected number of households in the study area in each projection period.
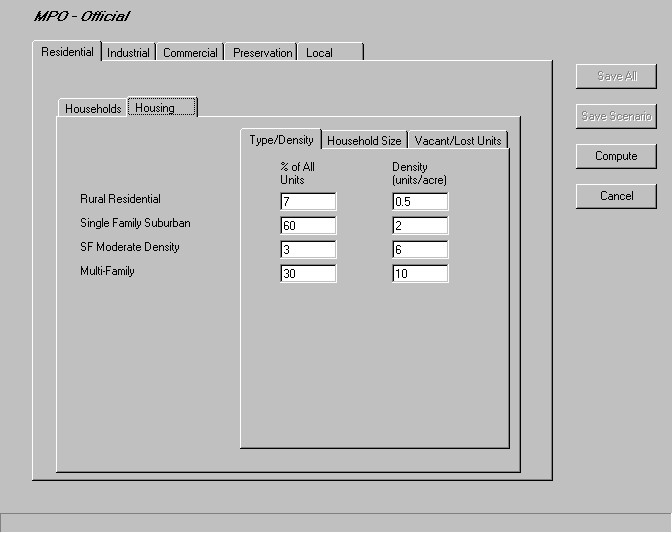
The second Residential sheet, labeled "Housing," allows users to specify their assumptions about the new housing units which will be built in the study area. The first sheet, shown in Figure 11, allows the user to specify the assumed breakdown by housing type for new residential construction and the assumed housing density for each housing type. The second Housing sheets is used to specify the average household size for each housing type. The third sheet is used to specify the assumed residential vacancy rate and the assumed proportion of existing housing units that will be lost to demolition, fire, and so on during each projection period.
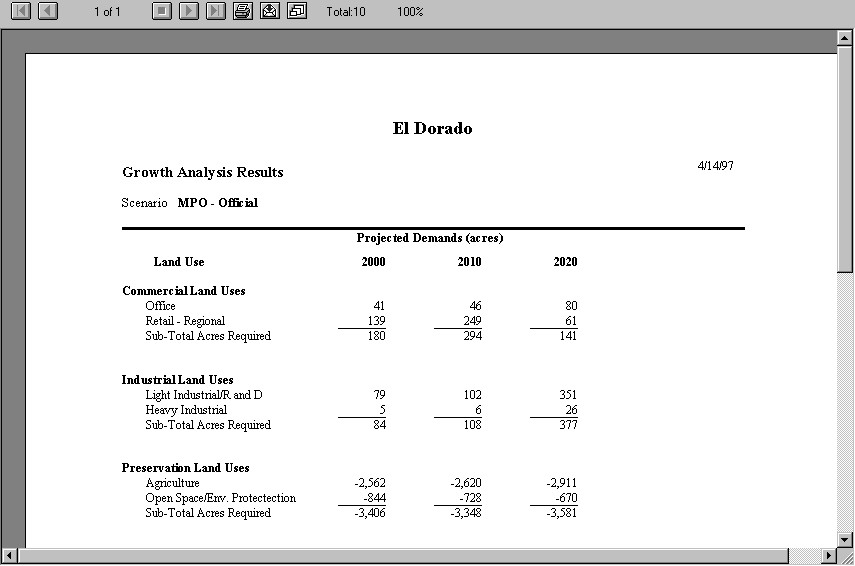
Growth Analysis Results Report. As shown in Figure 15, What if? PSS's Growth View Scenario Report option generates a report that identifies the projected demand for each land use in each projection year. The report can be reviewed on screen and printed by clicking on the printer icon.
The following discussion of What if? PSS's Allocation option contains four sections. The first section describes the general procedures used to allocate projected land use demands to suitable locations. The second section describes the forms that allow users to provide the information needed for the allocation process. The third section describes the What if? PSS allocation outputs. The final section discusses adjustments that can be made to modify the model outputs, for instance, made if the projected land use demands exceed the quantity of land of available suitable land.
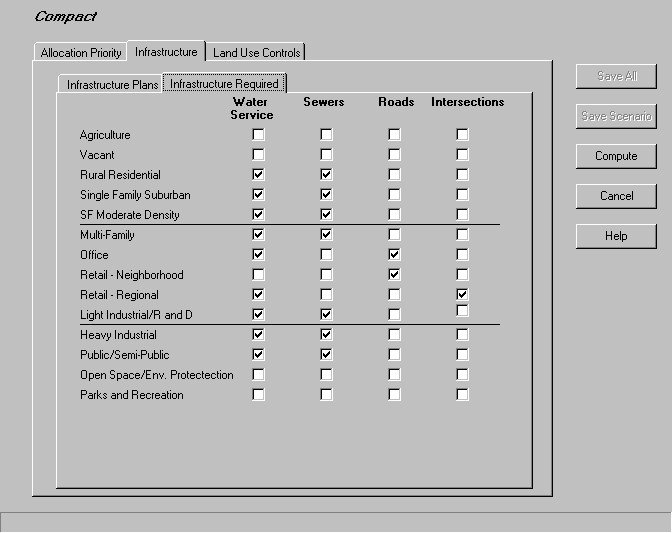
What if? PSS allocation process is designed to incorporate proposed changes to the area's infrastructure such as the construction of major roads or the expansion of sewer and water service areas. To do this, users must first specify a previously defined sewer or water service expansion plan which indicates areas that will and will not be served in each projection year. Next, the user must specify land uses which require, or must be near to, a particular type of infrastructure. Thus, for example, higher-density residential land uses can be assumed to require sewer and water services while agriculture and parks/recreation can be assumed to not require them. Similarly, regional retail outlets might be assumed to be located nearby interstate interchanges and major intersections; local retail can be assumed to be located in close proximity to major roads; and other land uses may not need to be close to either. This information is used by the system to allocate land uses to only those areas which the selected infrastructure plans indicate will have the required infrastructure availability or accessibility.
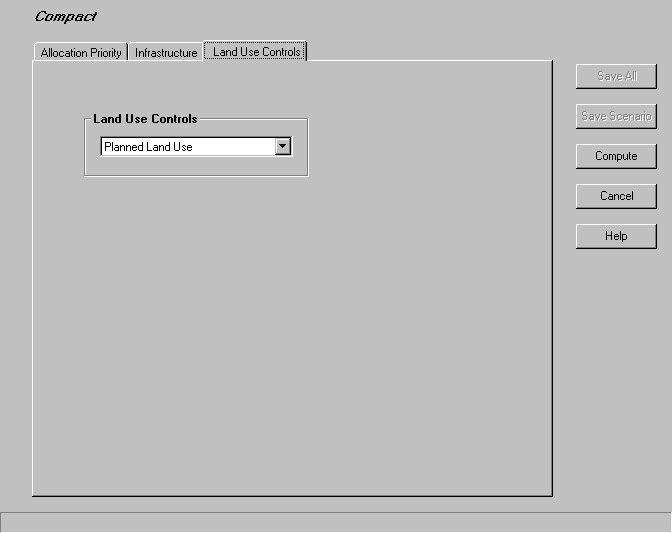
Similarly, What if? PSS incorporates user-selected land use controls by only allowing the projected land use demand to only be allocated to areas in which the land use is permitted or planned. That is, for example, the projected demand for industrial land can only be allocated to areas which are planned or zoned for industrial uses.

Allocation Priority Sheet. As shown in Figure 18, the Allocation Priority sheet is used to specify the order in which projected land use demands are to be allocated, i.e., the land use demand to be satisfied first, the demand to be satisfied second, and so on. The allocation priority list can be revised by selecting a land use label (not the number) from the list and dragging it to its preferred location in the list. Thus, for example, in Figure 18, the user has specified that the Open Space/Environmental Protection demand should be satisfied first; the Agriculture demand should be satisfied second; and so on.
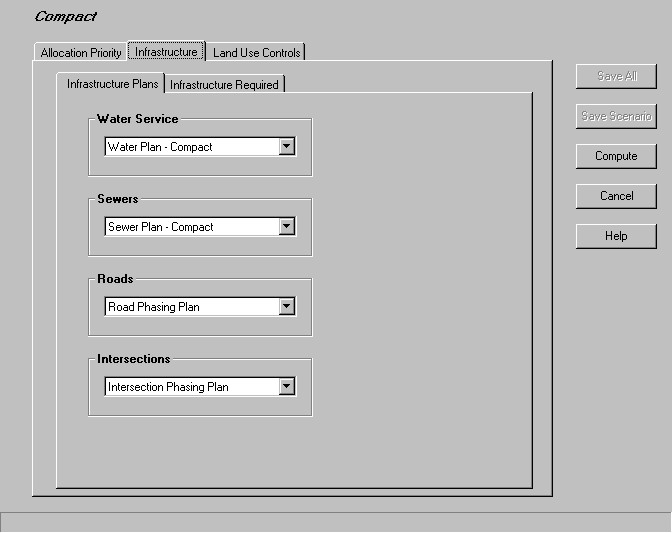
Infrastructure Sheet. As shown in Figure 19, the Infrastructure form has two tabbed sheets. The Infrastructure Plans sheet is used to identify the infrastructure plans which are to be used to guide the allocation process. For instance, in Figure 19, the user has specified that the compact water and sewer service plans and road and intersection phasing plans should be used in the allocation process. If no infrastructure plans are selected, all of the land uses will be located in their most suitable locations, regardless of the availability of sewer and water service or their proximity to major roads or intersections.
Allocation Map. As shown in Figure 22, What if? PSS's Allocation View Scenario Map option generates a map showing the projected land use in each allocation year. The "Year" pull down menu can be used to specify the projection year for which the projected land uses are to be shown. The allocation map displays the current or projected land uses in the default colors. The user can change any color by clicking on the colored box in the map legend.
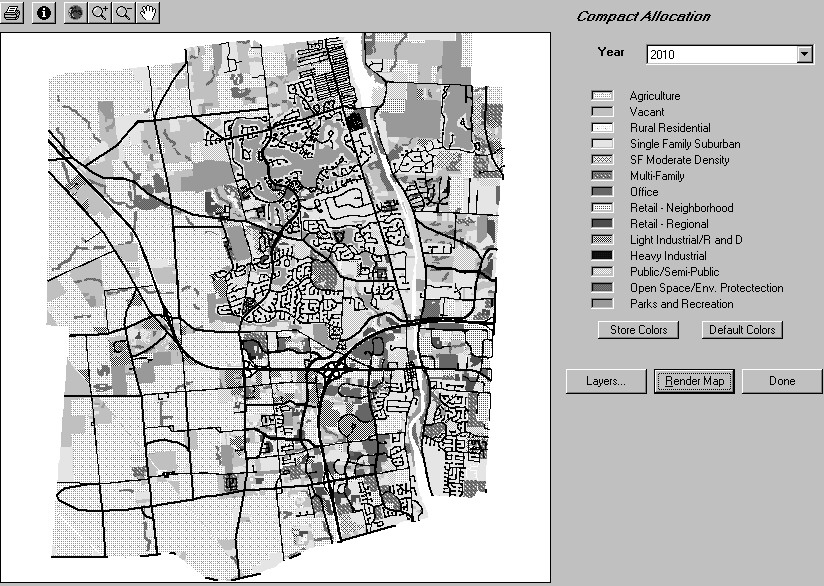
After selecting colors for each suitability category and appropriate fills or line styles for the map features, the user can display the map by clicking on the Render Map button. The maps can be sent to the printer by clicking on the printer icon. The map display also includes the standard information, map extent, zoom in, zoom out, and pan buttons. Clicking on the Done button returns the user to the main menu.
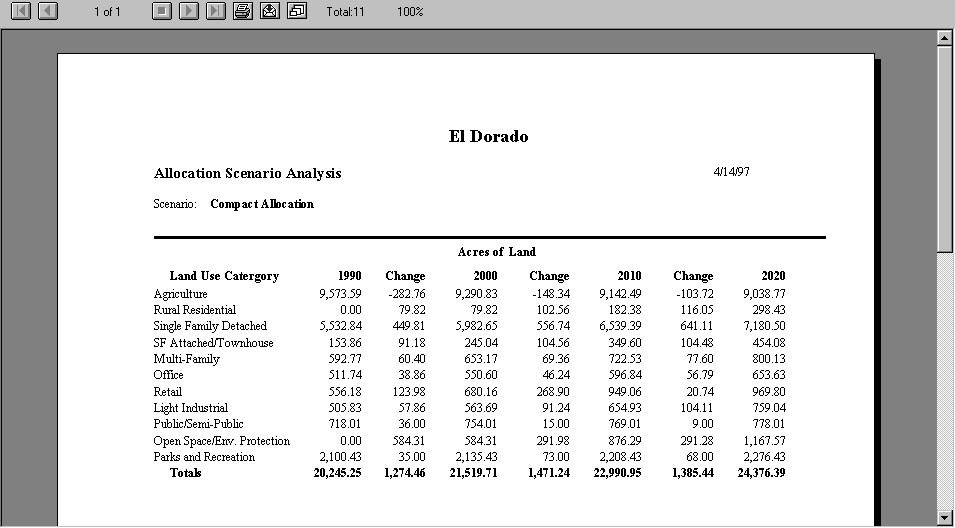
Allocation Report. As shown in Figure 23 What if? PSS's Allocation View Scenario Report option produces a report which records the projected quantities of each land use in the study area and each political subdivision in each projection year. The Allocation View Scenario Assumptions option also provides a printed report recording all of the assumptions which underlie an allocation scenario.
This process is necessarily iterative as a user will, first, create assumptions about the suitability of land in a suitability scenario. Next the user creates assumptions about the projected demands for land in a growth scenario. Third, the user defines assumptions about the allocation order and infrastructure and land use controls that will guide the allocation process in an allocation scenario. The allocation option then does the allocation, matching the available suitable land against the projected demand, subject to the specified infrastructure and land use controls. If there is insufficient demand, then one or more of the earlier assumptions must be modified.
There are several ways to increase the availability of a particular land use. The first is to increase the amount of land that can accommodate future demand for this use. This can be done by using the Conversion sheet on the Suitability Assumptions form to specify that additional land uses can be converted to a particular land use. For instance, if not enough land is available to satisfy the projected demand for, say, industrial uses, the user can specify that other current land uses, say agricultural land, can be converted to industrial uses. This will increase the pool of land in which the projected industrial demand can be located.
Problems of not having sufficient land to accommodate projected demand can also be dealt with by modifying the growth assumptions. Lowering the assumed growth rates for the housing units, industrial employment, or commercial employment will clearly reduce the demand for the available land. Unfortunately, these growth rate are determined by factors outside of the model and users should use realistic values. The projected demand for land can also be reduced by increasing the assumed densities at which future development will occur.
A third way to increase the availability of land to satisfy a particular type of demand is to upgrade the order in which that demand is considered during allocation process. A use that has a higher allocation order, will be considered first; as a result, this increases the likelihood that enough land will be available to satisfy that use. However, revising the allocation order means that another use will necessarily have a lower allocation order and enough land may not be found to fulfill the demand for that use. As a result, the user may have to experiment with different allocation orders to satisfy all of the required land use demands, given the available quantities of suitable land.
The availability of land can also be increased by modifying the infrastructure and land use controls specified in the allocation module. For example, the user can select alternative infrastructure plans which increase the supply of land provided with required sewer and water service. A less restrictive land use plan or zoning ordinance can also be selected to increase the number of locations in which future development is permitted to occur.
A second way to influence the spatial distribution of the allocated land is through the allocation order specified in the allocation option. A higher allocation order means that a particular land use will be allocated before other uses. Other things being equal, this will this tend to disperse the allocation of this use because more locations are available for satisfying the specified demand. On the other, if the use is given a lower allocation priority, it will tend to located in fewer areas because areas which might have accommodated this use have already been absorbed by previously allocated uses.
The What if? PSS web site, http://www.dcigis.whatif/whatif.htm also provides an interactive executive summary of the product and additional information, including pricing. For additional information call Plan it! at (410) 880-4845. Version 3.02 of the software is available to the first twenty users of the software under a special arrangement.