At the time, the task of integration relied on traditional tools and human limitations in handling multiple variables. Today, emerging new technologies like geographic information systems (GIS), global positioning systems (GPS), remote and in situ sensing, and satellite communications provide tools needed to integrate diverse data sets and perspectives to meet the demands of comprehensive coastal management.
What are the public's interests in the coasts? Knecht et al. (1996) recently analyzed state coastal management programs using four major categories: 1) protecting coastal resources, 2) managing coastal development, 3) providing public access, and 4) managing hazards. Wisconsin's Coastal Management Program, articulated through its state and local laws, identifies the public interest as: 1) air and water quality, 2) natural areas, wildlife habitat and fisheries, 3) erosion and flood hazards, 4) community development, and 5) economic development. Wisconsin also identifies two process-oriented public concerns: 1) government interrelationships, and 2) public involvement, equally important in GIS development. For simplification, three categories of public interest, air and water quality, special areas (to include an array of special geographies), and coastal development will be used as the structure for future GIS educational efforts.
In addition to defining the issues of public concern, the laws that define coastal management help define the functionality needed in GIS programs. For example, to determine the minimum lot width of 100' and minimum lot size of 20,000 sq. feet as mandated in subdivision regulations requires that GIS software have the capability to measure straight-line distances and areas. Defining a setback of at least 75 feet from the ordinary high water mark calls for buffers of lines or areas. Correlation can be made to other functions such as merging data sets, nearest neighbor searches, map overlays, etc. Functions that integrate map-related information, zoning ordinances, photography, and metadata, as well as those that add orthophotos, raster images, etc. are equally important. Facilitating government interrelationships and public involvement will require yet other GIS and decision support tools.
We also know from previous studies (Larsen et al., 1978) that the majority of land use data are collected at the local level and the primary authority for land-related decision resides with local governments. Yet when looking at applications of that data for general land management and specifically for coastal management one finds that documented coastal applications at the local level are few and far between. Rickman and Miller discovered when compiling their 1995 coastal GIS bibliography, that only 10 of 283 citations (2.6%) originated from a local unit of government. To some extent the limited documentation of local coastal applications results from the fact that local technical staff typically do not publish to the same extent as individuals in universities, or state and federal government agencies. However, presentations at state or regional conferences should give some indication of local activities and only minimal local input is found at these forums as well.
Evidence exists that a range of obstacles can impede successful implementation of GIS. Specific obstacles have been identified through individual case studies that appear in conference proceedings or trade publications. Croswell (1991) completed a content analysis of 39 of these sources to develop a matrix of common system implementation problems. The obstacles were coded into 11 groups and ranked based on the number of times the obstacle group was identified as a major or secondary obstacle in the articles. The top three obstacle groups include organizational coordination and conflicts, data and software standards/data integration, and planning/management support. Ventura (1995) more closely examines issues associated with the use of GIS in local government. A key observation is that early system use in local government is often limited to inventory applications, based on simple query and display functionality of GIS software. Very few local governments have advanced to analysis and management application which take advantage of the spatial analysis and modeling capabilities associated with GIS software. Campbell and Masser (1995) explored the question of whether GIS have been effective in practice. They reported that only 3 of 12 systems which had been in place for a minimum of two years in British local government were operational. The remainder were either still in development (7) or had been discontinued (2).
Given this background, a partnership was formed in 1995 between the University of Wisconsin Sea Grant Institute and UW-Madison's Land Information and Computer Graphics Facility (LICGF) to improve local coastal decision-making by teaching the use of GIS software and its application to coastal issues.
Training workshops and teaching models of GIS coastal applications form the core of the project. Coastal GIS training workshops are designed to first teach local professionals the fundamental use of GIS tools, and then teach the application of those tools to address coastal issues. The 16 hour workshops are held at the Land Information and Computer Graphics Facility (LICGF) on the University of Wisconsin-Madison campus. Participants are lodged at the Friedrick Center located a few blocks from LICGF. Enrollment is limited to 12 people and consists of the instruction as well as food and lodging during the workshop. GIS professionals have repeatedly stated that training funds are almost non-existent and with tight budgets at all levels of government, training is a low priority. This package enables all counties to take advantage of the training. The obligation of the participants is the cost of transportation and food en route.
Workshop participants spend the first day and one-half learning the basic functionality of desktop GIS software under a certified instructor. Specific exercises cover data input and integration, linking attribute data and spatial data, spatial query and analysis, map creation, address matching, and integration of vector and image data.
Application of GIS to coastal issues is taught through illustrative "teaching models", prototype coastal GIS applications built from local databases, that may contain fictitious data to illustrate a concept in addressing an issue, or to demonstrate functionality of the GIS software. The goal is to illustrate the application of GIS to the array of coastal issues described above. Teaching models provide a detailed step-by-step process of applying GIS to common coastal problems. A manual of detailed instructions to build the application "from scratch" is provided for each specific application. The manual will also be placed on Sea Grant's coastal GIS web site for use by others. All local GIS professionals can then access the instructions on the web as a self-teaching tool.
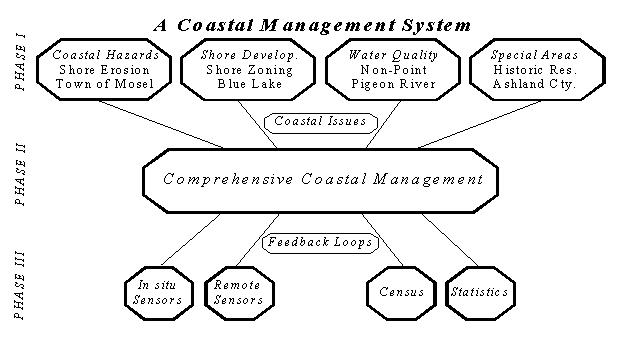
The overall project is structured into three phases, each increasing in complexity of coastal management and computer functionality as illustrated in Figure 1 below.
Air and Water quality
Special environments
Shore development
As in phase one, models will be developed to illustrate concepts. During this phase, many new tools may evolve to interrelate issues, as well as communicate outcomes to GIS users.
The coastal GIS applications project will rely on evolving ideas from throughout the professional GIS community. Developing new tools is not the primary purpose of the project. The focus is to teach the application of GIS tools to coastal management. Doing so will accelerate the rate at which emerging technology is transferred to Wisconsin's local coastal governments and citizens.
 All land in Wisconsin within 1000 feet of the ordinary high water mark (OHWM)
of navigable lakes, ponds, or flowages or 300 feet from the OHWM of a navigable river or stream
(or to the landward side of the floodplain if that is greater)
is subject to shoreland zoning. GIS has been
utilized to improve the administration and enforcement of zoning ordinances. This
section reviews the development of a GIS application for shoreland zoning and associated
lake management concerns on an inland lake in northern Wisconsin.
The site of the application is Blue Lake in
northwest Oneida County near Minocqua, Wisconsin. The application was developed
using ArcView 3 software produced by Environmental Systems Research Institute
(Redlands, California). Software functionality utilized in the application includes data
import and integration, linkage to a relational database management system, thematic
mapping, spatial analysis and query, image interpretation, and inter-application
connectivity.
All land in Wisconsin within 1000 feet of the ordinary high water mark (OHWM)
of navigable lakes, ponds, or flowages or 300 feet from the OHWM of a navigable river or stream
(or to the landward side of the floodplain if that is greater)
is subject to shoreland zoning. GIS has been
utilized to improve the administration and enforcement of zoning ordinances. This
section reviews the development of a GIS application for shoreland zoning and associated
lake management concerns on an inland lake in northern Wisconsin.
The site of the application is Blue Lake in
northwest Oneida County near Minocqua, Wisconsin. The application was developed
using ArcView 3 software produced by Environmental Systems Research Institute
(Redlands, California). Software functionality utilized in the application includes data
import and integration, linkage to a relational database management system, thematic
mapping, spatial analysis and query, image interpretation, and inter-application
connectivity.
Development Pressures. Development in Oneida County has increased over the past several decades. There has been a boom in construction of both seasonal recreational homes and permanent residences. The number of new building permits has increased from 1,112 in 1989 to 1,643 in 1993. A total of 825 new sanitary permits were issued in 1993, up from 557 in 1989. Much of the new construction activity has taken place on lakefront property. Of the single family homes constructed in 1993, 52 percent were on lakefront properties. The 1990 census indicates that 11,263 of 25,173 total housing units in the county (45 percent) are seasonal. Developable lakefront property is becoming scarce and, as a result, shoreside property values have risen dramatically.
Commercial development is also active in Oneida County. The county is a major tourism destination, with over 300 lodging facilities offering approximately 3200 rooms; 37 campgrounds with over 1500 total campsites; and seventeen recreation camps serving approximately 2,800 people. Lodging occupancy information and visitor surveys indicate that Oneida County serves an average summer seasonal population of over 55,000 people, which is almost double the 1990 permanent population of 31,679.
The History of Rural Zoning in Oneida County. In May 1933, Oneida County enacted the first comprehensive rural zoning ordinance in the United States. In the early 1930's, most northern Wisconsin counties were facing financial difficulties stemming, in part, from difficulties in converting cut-over forest lands to agriculture. The purpose of the rural zoning ordinance was to restrict settlement in remote areas. The Oneida County Board of Supervisors was concerned about the high costs of transporting school children and the construction and maintenance of roads in remote areas. The ordinance eventually became a model for other counties in Wisconsin and promoted the creation of county forest preserves across northern Wisconsin.
Since that time, the nature of zoning in rural Oneida County has changed. The County adopted a Shorelands Protection Ordinance in November 1970 based on state enabling legislation. The ordinance has since been revised several times. It is now identified as the Oneida County Zoning and Shorelands Protection Ordinance. Amendments to the ordinance include provisions on mining, signage, non-conforming structures, and placement of mobile and manufactured homes.
Protecting Water Quality and Aesthetics. Given the increasing development pressure in the county and the fact that much of the new development is located on the county's fragile lake ecosystems, regulation of shoreland development is very important. Failing septic systems, construction site soil erosion, runoff of lawn fertilizers, and other sources represent non-point sources of pollution that impair water quality. Water quality impairment threatens fish and wildlife habitat and aesthetics. Various structural violations of the shoreland ordinance requirements may also threaten the water quality and natural beauty of the lake resources.
To address these concerns, Oneida County has initiated a comprehensive revision of the zoning and shoreland protection ordinance. The overall goals of the project are to improve compliance rates of new and existing shoreland development, and to protect shoreland and lake ecosystem quality. Funding for the multi-year effort comes from local sources and a state lakes protection grant. The scope of the project includes: (1) an assessment of shoreland zoning compliance and resource problems; (2) revision of mining provisions in shorelands and floodplains; (3) comprehensive revision of the zoning and shoreland protection ordinance to improve its administration; (4) community education on the revised regulations; and (5) creation of a program to monitor and enforce the revised ordinance.
Spatial Information Technologies for Enforcement of Shoreland Zoning. Oneida County has an active land records modernization program and is exploring methods to incorporate GIS/LIS technology to assist in administration and enforcement of the zoning and shoreland protection ordinance. Specific activities include creation of digital parcel maps, development of parcel identification numbers (PINs) to link property attributes to the parcel map, development of digital orthophotos on a regular time frame, and incorporation of aerial or boat based videography to help detect property changes and zoning violations.
The first set of images examine thematic mapping of attributes from property assessment and ownership files. Despite the relatively straight-forward nature of the software tools used to join these databases with parcel maps using unique parcel identifiers, the resulting maps represent products that were difficult and time-consuming to generate before the advent of automated mapping and GIS. The first two images examine assessed value of the land (Figure 2) and assessed value of the land per square foot (Figure 3) of lakefront properties. One can see that there is a wide variation of assessed values surrounding the lake, with lakefront properties containing improvements showing the highest assessed values of land per square foot. Figure 4 shows classes of property ownership based on the zip code of where the tax bill is sent.
Figure 2: Assessed Value of the Land
Figure 3: Assessed Value of the Land per Square Foot
Figure 4: Property Ownership: Wisconsin vs. Out-of-State
The second set of images examine tools to aid the administration of the shoreland zoning ordinance. The lighter green area in Figure 5 represents the area of the jurisdiction of the shoreland zoning ordinance within 100 feet of Blue Lake, while the darker green area is the area impacted by the 75 foot setback requirement. Figure 6 shows the results of two theme on theme selections. The first identifies all structures within the 75 foot setback (in yellow) and the second shows the parcels that intersect with the selected set of buildings (in purple hatching). Figure 7 shows a section of a hypertext-linked help file of the Oneida County Shoreland Zoning Ordinance. The help file was created using RoboHelp software from Blue Sky Software (LaJolla, CA). Linking the zoning ordinance text and maps within the same environment have the potential the make the administration of shoreland zoning more effective, particularly when working directly with permit applicants.
Figure 5: Shoreland Zoning Jurisdiction and Shoreland Setbacks-Entire Lake
Figure 6: Shoreland Setbacks-Blue Lake Island
Figure 7: Shoreland Zoning Ordinance in Hypertext Help File
State regulations in Wisconsin require that septic tanks be pumped every three years. Oneida County is a rural county with over 1100 lakes. Notifying property owners of septic pumping requirements using manual methods has been a burdensome responsibility for county officials. These images show how a septic tank notification application might be designed using GIS. The tank locations and associated attribute data are fictitious, but illustrate the principles. A spatial query selects all septic tanks last pumped in 1994 or before. A theme on theme selection intersects the selected set of septic tanks with the parcel theme and allows access to property ownership information. The mail merge capabilities of a word processing software package can then be used to prepare form letters and labels to automate the notification process.
Figure 8: Fictitious Septic Tank Locations with Query
Figure 9: Form Letter for Septic Tank Maintenance Notification
The following collection of images illustrates a hypothetical site selection process for a lakefront county park. A series of theme on theme selections and spatial queries are used to identify an "optimal" location for the park. The first query identifies all developed parcels and then reverses the selection set to start with all undeveloped parcels (Figure 10). The next criterion is that the site must have lake frontage (Figure 11). After that, sites that border developed parcels are eliminated so that the future park site is "remote" and will minimize nuisances to neighbors (Figure 12). Next, a minimum size restriction of two acres is imposed (Figure 13). Finally, any remaining sites that include wetlands are eliminated (Figure 14), leaving the "prefered" site. A benefit of this approach is that, if the County Board wished to modify the selection process, the criteria could be changed with relative ease.
Figure 10: Lakeside Park Site Selection (Step 1)-Vacant and Developed Parcels
Figure 11: Lakeside Park Site Selection (Step 2)-Lakeside Parcels
Figure 12: Lakeside Park Site Selection (Step 3)-"Remote" Parcels
Figure 13: Lakeside Park Site Selection (Step 4)-Parcels Greater Than 2 Acres
Figure 14: Lakeside Park Site Selection (Step 5)-Non Wetland Parcels/Preferred Site
Digital orthophotos used in conjunction with Digital Raster Graphs (DRGs) represent a means of integrating image data into the shoreland zoning/lake management application (Figure 15). DRGs are scanned, geo-rectified U.S.G.S. 7.5' topographic maps. The image legend editor in ArcView allows the individual colors of the DRG to be changed or made transparent. Figure 16 shows the brown color (contour lines) on the original DRG turned to yellow and all other colors turned to transparent (Figure 16). Many of the lakes in northern Wisconsin are very clear. A recent Secci depth reading for Blue Lake was 23 feet. In the bay depicted in Figure 17, one can see many interesting patterns of what appears to be submerged aquatic vegetation. In addition, the digital orthophotos may be displayed together with vector themes showing structures and parcel boundaries. Since the digital orthophotos were produced after the digital planimetric maps, they may be used to identify recently constructed buildings.
Figure 15: Digital Orthophoto and Digital Raster Graph
Figure 16: Digital Orthophoto with Contour Lines from DRGs
Figure 17: Digital Orthophoto with Buildings to Identify New Construction
Oneida County is interested in the use of visual imagery such as photographs or boat-based or aerial-based videography to aid enforcement and administration of the county shoreland ordinance. Figure 18 shows the use of hot links to relate scanned photographs of structures to their location on the shore of Blue Lake.
Figure 18: Visual Inventory of Structures on the Lake (Hot Links)
Croswell, P. 1991. Obstacles to GIS Implementation and Guidelines to Increase the Opportunities for Success" URISA Journal. Vol. 3, No. 1, pp. 43-56.
Knecht, R.W., B. Cicin-Sain and G. Fisk. 1996 "Perceptions of the Performance of the State Coastal Zone Management Programs in the United States". Coastal Management. Vol. 24, pp. 141-163.
Larsen, B., J. Clapp, A. Miller, B. Niemann and A. Ziegler. 1978. Land Records: The Cost to the Citizens to Maintain the Present Land Information Base, A Case Study of Wisconsin. Madison, WI: Department of Administration, State of Wisconsin.
Rickman, T. L. and A. H. Miller. 1995. A Categorized Bibliography of Coastal Applications of Geographic Information Systems. Madison, WI: University of Wisconsin Sea Grant Institute and Land Information and Computer Graphics Facility, University of Wisconsin-Madison.
Ventura, S. 1995. "The Use of Geographic Information Systems in Local Government" Public Administration Review. Vol. 55, No. 5 (September/October, 1995), pp. 461-467.
Wisconsin, Department of Administration. 1987. Wisconsin Coastal Management Program for the Great Lakes: 1987 Update.
David Hart
Coastal GIS Specialist
Land Information and Computer Graphics Facility
University of Wisconsin-Madison
Room B102, Steenbock Library
550 Babcock Drive
Madison, WI 53706
Telephone: (608) 263-5534
Fax: (608) 262-2500
Email: dhart@macc.wisc.edu
WWW: http://www.lic.wisc.edu/~dhart/dhart.htm
Allen H. Miller
Assistant Director, Advisory Services
University of Wisconsin Sea Grant Institute
1800 University Avenue
Madison, WI 53705-4094
Telephone: (608) 262-0644
Fax: (608) 263-2063
Email: ahmiller@seagrant.wisc.edu
Bernard J. Niemann, Jr.
Director
Land Information and Computer Graphics Facility
University of Wisconsin-Madison
Room B102, Steenbock Library
550 Babcock Drive
Madison, WI 53706
Telephone: (608) 263-5534
Fax: (608) 262-2500
Email: bniemann@facstaff.wisc.edu
Stephen J. Ventura
Associate Director
Land Information and Computer Graphics Facility
University of Wisconsin-Madison
Room B102, Steenbock Library
550 Babcock Drive
Madison, WI 53706
Telephone: (608) 263-5534
Fax: (608) 262-2500
Email: sventura@macc.wisc.edu