
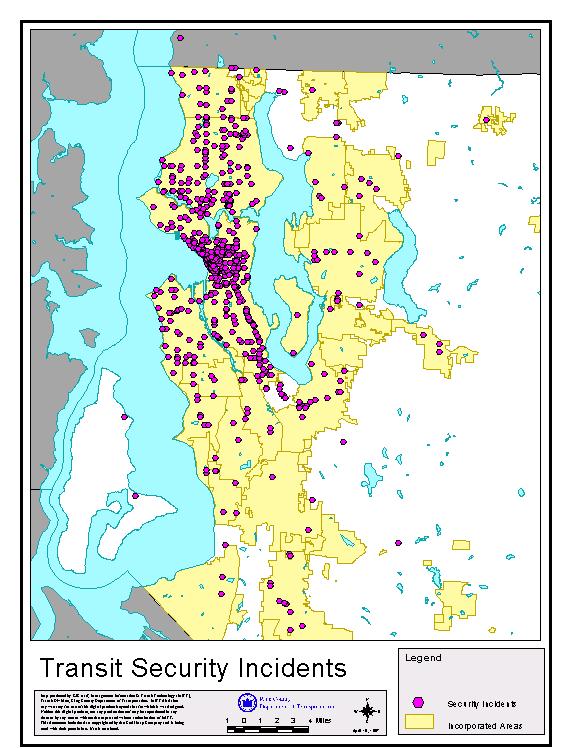
Figure 1
As part of a federal grant to provide specialized Geographic Information Systems (GIS) desktop tools to the agency, the Transit GIS group developed a new Transit security incident data entry, analysis, and reporting application. This application incorporates GIS technology using MapObjects and Microsoft Visual Basic with standard database querying capabilities via Microsoft Access to provide an efficient analytical tool for accomplishing the goals of Transit Security. It allows Security personnel to ask a variety of spatial and non-spatial database queries in an easy to use graphical user interface. In addition, it assists Security personnel in providing more informative map-based reports to operations staff and the Transit Director. Finally, this application can easily be adapted to provide spatial and non-spatial database analytical tools to other groups within the Transit Division, such as Transit Safety and Facilities Management.
Between 1992-1993, the King County Department of Transportation's Transit Division developed a Geographic Information System (GIS) program to sustain mission critical systems. These systems support a transit infrastructure which currently includes approximately 10,000 bus stops, 1,800 miles of routed streets, 65 miles of electric overhead wires for trolley buses, and facilities such as park and ride lots, bus bases, transit centers, and a one-mile long underground tunnel (Figure 1)1. This transit system is in operation 24 hours a day, 365 days a year serving more than 1000 square miles in the Central Puget Sound Region, including the city of Seattle. The handling, recording, tracking, maintaining, reporting, and evaluating of security incidents involving transit facilities and personnel is critical to providing safe transportation services for the more than 76 million passenger trips that occur annually (Management Information and Transit Technology 1996).
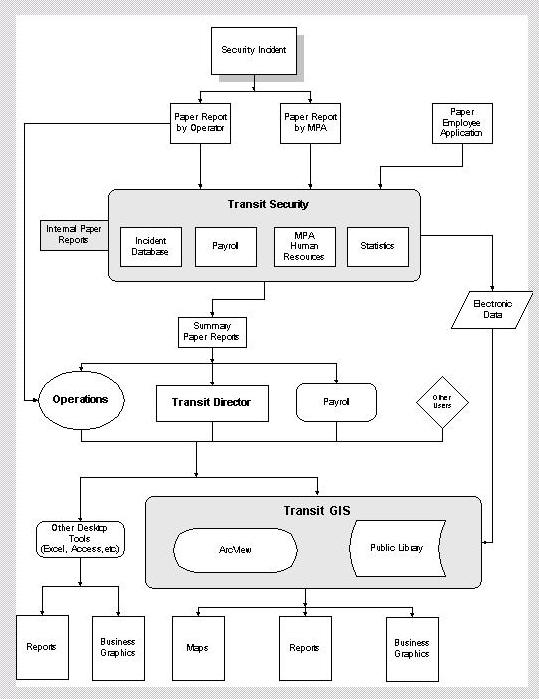
In the past, Transit Security tracked and reported on more than 3,000 security incidents per year using an MS-DOS based database management system (Figure 2). This system consisted of a Paradox database and in house developed Paradox scripts to manage transit security information. The system supported a diverse set of data, from security incident attributes to payroll information, with specific functionality including data entry and report production. The purposes of this system were to assist Transit Security in maintaining security for drivers and passengers, identifying systematic patterns in the occurrence of security incidents in order to optimize the deployment of security agents, providing timely information on security-related incidents, and providing historical information in support of planning special event coverage. Although one of the safest transit systems in the country2, the King County Transit Division's Paradox-based security incident reporting system was unable to combine spatial analyses to optimize the placement of security personnel. Questions such as "Show me a breakdown of security incidents by type that occur within one-quarter mile of all park and ride lots," were not possible. Similarly, incidents were tracked by route, but Transit Security could not identify groups of spatially coincident routes that have a high security incident frequency to more efficiently deploy resources. The Paradox-based incident tracking system was functionally inadequate to perform the expanding spatial and non-spatial analytical requirements of a modern transit security system.
The Transit Division -- with financial assistance from a Federal Transportation Administration grant to provide specialized GIS desktop tools to the agency -- developed a transit security incident tracking, analysis, and reporting application. This application replaces the Paradox MS-DOS-based system with an Access database and a user friendly Windows interface developed using Visual Basic and Esri's MapObjects. The application provides comprehensive incident tracking services to the Transit Division's Security Section, including incorporating geographic tools to place incidents and to analyze spatial patterns that will improve the deployment of Security resources. This paper describes that application.
OLD SYSTEM ISSUES
Transit Security tracked and reported security incidents using an MS-DOS based Paradox database management system (DBMS), and in-house developed Paradox scripts to facilitate data entry, editing, and reporting tasks. Incident details are recorded on paper documents primarily by transit operators, and include incident type, on-street, cross-street, route, date and time of occurrence, property loss description, and others (Figure 3). In addition, this form includes graphics for identifying a suspects location on the coach, and points of damage on several different types of Transit vehicles. These data were transcribed daily into the Paradox database by Transit Security personnel through an on-line form menu, and the system assigned a unique identifier to the incident for future reference. Details indicated by the vehicle graphics were translated to textual descriptions. Incidents in the database were also modified through the same form menu as new information was received. Ad hoc queries of recorded incidents were only available through the native Paradox interface.
In addition to data entry and modification, the system provided a variety of standard reports to various clients throughout the Transit Division. These reports were available in the Paradox interface from a list of hard-coded reports that query the incident database. They are used for internal analyses for the Transit Security unit, base-specific monthly reporting to base chiefs, agency-wide monthly reporting to Transit Operations, and summary reporting to the Transit General Manager. Essentially, these reports consist of lists of incidents with counts summarized by specific variables, and when combined with earlier reports, demonstrate temporal trends in incidents throughout the county. They contained no spatial component, however. Incident locations were geocoded using ArcView creating a spatial database, but these data were not tied to the Paradox system, and required separate updating procedures.
The Paradox-based Transit Security system also recorded payroll information on Metro Police Agents, field incident reports submitted by those agents, and tracked incidents as they progressed through the judicial system. All this information including incident attributes, however, could only be stored, reported, and analyzed for a single year. The unique incident identifier which was used to reference these data was composed of the year and a four digit counter (e.g., 970001, 970002, ...). At the end of a year, it was necessary to archive the data, clear the database, and modify the Paradox scripts to accommodate a new range of unique security incident identifiers based on the current year.
Although the Paradox-based system served Transit Security for a number of years, there were several arguments in favor of its replacement. First, this system was developed in MS-DOS Paradox. Although state-of-the-art at the time, the MS-DOS version of Paradox used by Transit Security does not facilitate interaction with Windows-based applications such as ArcView. In addition, this older version of Paradox (4.0) lacks many of the latest DBMS capabilities available in more recently developed tools. Second, the scripts developed for this system lack adequate documentation for maintenance and updating. This makes modifications to database design in response to changing business needs impractical because the scripts are not easily updated to reflect these changes. In addition, the lack of documentation has made it nearly impossible to add new reporting capabilities to the system, such as an ad hoc report generator, or modify existing standard reports to more tightly fit the needs of specific users. Finally, the system is not capable of handling spatial data effectively, nor is it able to take full advantage of the GIS capabilities recently installed in the agency. Although Transit Security could use the Paradox database with ArcView, this would necessitate that non-technical Security staff become familiar with completely different interfaces in different operating systems -- one for data entry and the other for spatial analysis. This would also not resolve ad hoc reporting and documentation requirements lacking in the Paradox-based system.
NEW SYSTEM HIGHLIGHTS
The Transit Security incident tracking system developed by the GIS team is an Access database with data entry, analysis, and reporting driven by Visual Basic and MapObjects. Operators continue to submit paper forms to Transit Security for each incident. In addition, Metro Police Agents submit field incident reports, and Transit Security receives employee information from the Transit Human Resources (HR) Division. All these paper forms are transcribed into different modules of the Transit Security system from which various standard and ad hoc reports are generated for internal use and distribution to Operations, Payroll, and the Transit Director. These reports may include maps, business graphics, and spatial analyses. The primary spatial analysis tool used by Transit Security is identifying spatial trends within proximity to existing Transit facilities such as routes, stops, and park and rides. This information is used to efficiently deploy Transit Security resources. Users of the system can obtain a breakdown of incidents by type within a specified distance from these facilities or within selected polygons in other data layers.
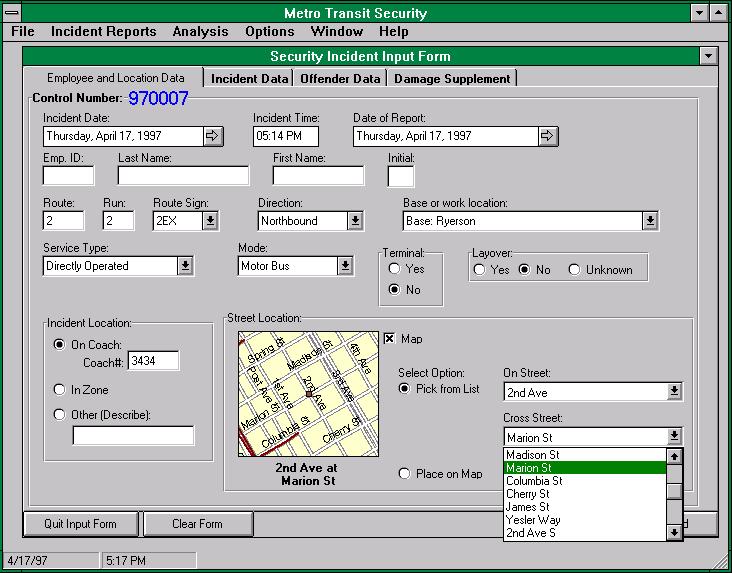
Specific improvements over the old system include wide use of drop down boxes for all non-continuous attributes including on-street and cross-street (Figure 4). For example, the on-street drop down box consists of a list of over 9,000 street names. When the street name is selected, the cross-street name list is automatically updated to provide only those valid cross streets to the selected on-street. A node database of over 80,000 street intersections is queried with no perceptible interface delay.
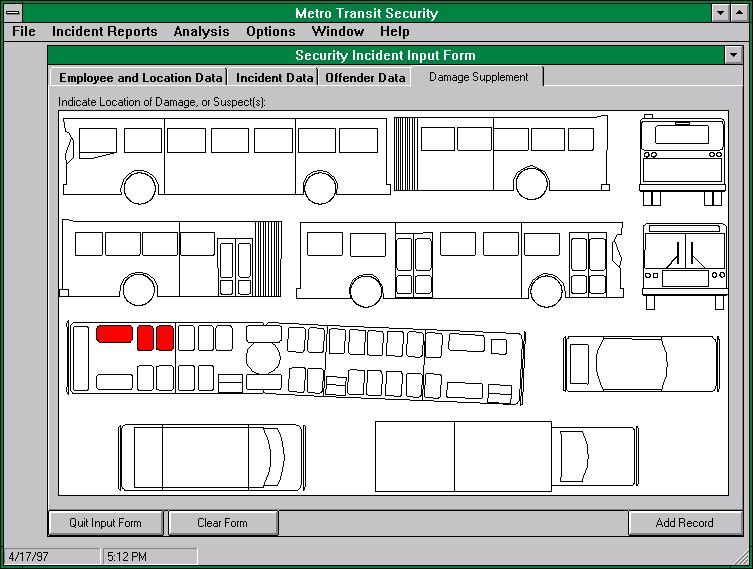
The new system also reduces the amount of textual information entered which often contains valuable details, but tends not to be consistent or used in any analytical queries. One panel of the data entry screen includes scanned images of the vehicles comparable to those that appear on the paper forms. In the Paradox-based system, Transit Security translated this information into text stored in a comment field. In the new system, staff can record specific locations of vandalism on the vehicle directly in the data entry form which can be later queried (Figure 5). This is useful to target placement of undercover Metro Police Agents on the vehicle if patterns of vandalism are indicated.
Finally, the new system interface adapts when specific key fields are selected. For example, when Transit Security staff indicates that an assault occurred during the incident, and additional assault information section appears in the interface tab. Also, the system populates operator name and work location fields automatically based on the operator identification number. This information is queried directly from the systems Human Resources information database. Whereas in the old system these databases were stored separately, the new system interconnects them allowing staff to use the data stored in one module for populating fields in another.
Transit Security also provides GIS with monthly extracts of public attributes and x-y coordinates for incidents. These are published in the GIS library for access by all Transit staff. From here, users outside of Transit Security can produce maps, reports, and business graphics using generalized tools such as ArcView, native Access, Excel, or other desktop database management tools which are already in place for the broader Transit community.
DEVELOPMENT ISSUES
First, it was necessary to accommodate Transit Security and various Transit Security clients in a more rigorous fashion than typical. Collecting, recording, and analyzing security incident data are high profile tasks within the Transit Division. The system output also has financial implications ranging from providing paying customers with adequate security to accurate Federal Government reporting for grant qualification. To accommodate these issues within Transit, the GIS team researched the old system, interviewed Transit Security personnel, operations staff, and individuals responsible for Federal Government reporting, developed a Scoping Document, Alternatives Analysis Document, and a 70 page detailed Requirements Document, held regular meetings with the head of Transit Security, and presented status reports to Senior Staff. These tasks delayed programming a comprehensive prototype, but were critical to smooth system development. The written documents also provided historical system documentation during early project development, and became a template for comparable systems developed for Transit Safety and Transit Planning.
The second non-technical issue overcome by the GIS team was that the Transit Security application was the first of several application development projects that were primarily non-GIS in nature. That is, the Transit Security applications includes data entry of primarily non-spatial information, tabular summaries of incident attribute data, and management of payroll and other employee information. It was necessary for the GIS team to recognize at the outset that we were developing a Transit Security information system with a small, albeit important GIS component. The component of the system, therefore, that consumed a great deal of our initial programming resources was the data entry screen (Figure 4). The first tab of this screen has only a minor map component. Incidents are located using the on-street and cross-street from the paper incident report form as with the old system. The on-street and cross-street are selected from drop down lists of street names derived from GIS but stored in an Access database. After selecting the on-street and cross-street, the map automatically zooms to that location and an x-y coordinate pair is obtained and stored for the incident. This map can also be used to manually place the incident, but this operation only occurs in less than 1% of the recorded incidents. There was also a limited need of a spatial component in reporting, payroll, and incident tracking through the justice system. This is one of the reasons MapObjects was chosen over ArcView for the Transit Security application, so that the spatial component could be used only when necessary. Rather than attempt to do this with ArcView in which the spatial component is an integral part of the software, we chose a non-spatial programming interface -- Visual Basic -- and limited our injection of the MapObjects mapping component to specific spatial analytical questions and for the production of maps.
Although in the future, it may be more driven by the spatial component, Transit Security presently uses GIS as a secondary tool to enhance its primary functions rather than as a new model for doing business. We believe this is true of many Transit information systems such as Safety, Facilities Management, Vehicle Location, Passenger Counting, Ridematch Services, and Trip Planning. This challenged the GIS team to develop an efficient information systems application which utilized databases populated from the GIS library (e.g., street names), but which limited GIS functionality to key analytical tools.
SUMMARY
In summary, the GIS team has developed a complex integrated information system for recording, storing, analyzing, and reporting Transit security incidents. Incident attributes and shapes are published in the agency's GIS for access throughout Transit. System development included extensive scoping, alternatives analysis, and requirements development to ensure a successful application which is primarily non-spatial in nature.
Management ensured successful completion of the spatial component by assigning development responsibility within the GIS team. We were, thus, challenged with maintaining the non-spatial nature of the application with an innovative database design to accomplish tabular queries of the street network and controlled use of MapObjects. We anticipate that Transit information systems are generally moving in this direction, requiring GIS developers to become more proficient in non-spatial interface design and database management, and, most importantly, to increase knowledge of daily business operations.
We would like to thank Guido Riley who read earlier drafts of this paper. We would also like to thank the staff of the Transit Division for their helpful suggestions and patience.
END NOTES
1. All maps in this paper were prepared using AvMaps (Berman et al. 1996).
2. American Public Transportation Association Bus Safety Award Winner 1983, 1986, 1988, 1991, 1992, 1993, 1994.
REFERENCES
Berman, Michael J., David Kreinheder, and Tamara Davis, 1996, Automating Map Production in ArcView. Paper presented at the 1996 Northwest ArcInfo User's Conference, Portland.
Management Information and Transit Technology, 1997, 1996 Year-End Ridership Report, King County Department of Transportation.
MS-DOS, Windows, Excel, Access, and Visual Basic are trademarks of Microsoft Corporation. MapObjects and ArcView are trademarks of Environmental Systems Research Institute, Inc. Paradox is a registered trademark of Borland International, Inc.
Michael J. Berman, GIS Administrator
David Kreinheder, Senior GIS Analyst
Tamara Davis, GIS Analyst
Robert Wade, Research Associate
Management Information and Transit Technology
Transit Division
King County Department of Transportation
821 Second Ave.
MS 53
Seattle, WA 98104-1598
Telephone: (206) 689-3732
Fax: (206) 684-2059
E-mail: michael.berman@metrokc.gov