Joseph K. Berry, David J. Buckley, and Kevin McGarigal
The ArcInfo system is a powerful GIS that is widely used by natural resource agencies, organizations and companies. FRAGSTATS is an extensively used program that derives a comprehensive set of useful landscape metrics. Communication between the two programs, however, has been left to end-users and requires considerable programming knowledge of both systems� syntax, file types/formats, custom conversion programs and operating system procedures. The intimidating and confusing "mechanics" of the linkage has severely limited the effective use of landscape analysis in natural resource management. This paper describes a fully integrated link between ArcInfo and FRAGSTATS using a single user interface that controls program specifications, data table generation, and output display. This "seamless link" provides a user-friendly graphical menu consisting of scroll lists, toggles and buttons to facilitate program specifications and automatically generate appropriate tables, charts and maps for enhanced interpretation of the results. The FRAGSTATS Interface provides such an environment by controlling 1) the selection of maps, 2)direct access of ArcInfo maps, 3) selection of FRAGSTATS indices, 4) program execution, 5) generation of attribute tables containing FRAGSTATS results, and 6) display of results in a variety of tables, charts and map displays. The follow-on FRAGSTATS Extensions software will provide additional landscape structure indices and new capabilities for generating custom queries and rapid comparison of FRAGSTATS output.
The developing field of landscape ecology provides a strong conceptual and theoretical basis for understanding landscape structure, function and change. These factors can be specifically defined as (Forman and Gordon 1986):
The ability to quantify landscape structure is prerequisite to the study of landscape function and change. For this reason, considerable emphasis has been placed on the development of landscape metrics (O�Neill et. al. 1988; Li 1990; Turner 1990; Turner and Gardner 1991). Many of these relationships can expressed by indices derived through analysis of the shape, pattern and arrangement of landscape elements spatially depicted as individual patches (e.g., vegetation polygon), classes of related patches (e.g., polygons of the same type/condition), and entire landscape sets (e.g., all polygons).
Landscape analysis provides the techniques for the study of landscape patterns, the interactions among patches within a landscape mosaic, and how these patterns and interactions change over time. Geographic information systems (GIS) technology provides capabilities for computer encoding, storage, processing and display of the spatial data. To date, the successful marriage of the science of landscape ecology and GIS technology has been sporadic. Much of the difficulty has arisen from the procedural complexity of linking the two systems in a common environment that scientists and managers can easily use.
LINKING GIS AND LANDSCAPE ANALYSIS CAPABILITIES
FRAGSTATS (McGarigal and Marks 1995) is an extensively used program that derives a comprehensive set of useful landscape metrics. The ArcInfo system (Esri 1992) is a powerful GIS that is widely used by natural resource agencies, organizations and companies. Communication between the two programs, however, has been left to end-users and requires considerable programming knowledge of both systems� syntax, file types/formats, custom conversion programs and operating system procedures. These intimidating and confusing "mechanics" of the linkage has severely limited the effective use of landscape analysis in natural resource planning and management.
SEAMLESS LINK BETWEEN ArcInfo AND FRAGSTATS
A fully integrated link between ArcInfo and FRAGSTATS requires a single user interface that controls program specifications, data table generation, and interactive output query and display. A "seamless link" provides a user-friendly graphical menu consisting of scroll lists, toggles and buttons to facilitate program specifications and automatically generate appropriate tables, charts and maps for enhanced interpretation of the results. The FRAGSTATS Interface develops such an environment by controlling:
The FRAGSTATS Interface allows the user to select the ArcInfo coverage(s) for input, landscape metrics for calculation, output forms and processing environment control. These specifications are accomplished through a cascading menu bar with a "look-and-feel" similar to most Windows programs. The menu is organized into eight topics which follow the natural processing order:
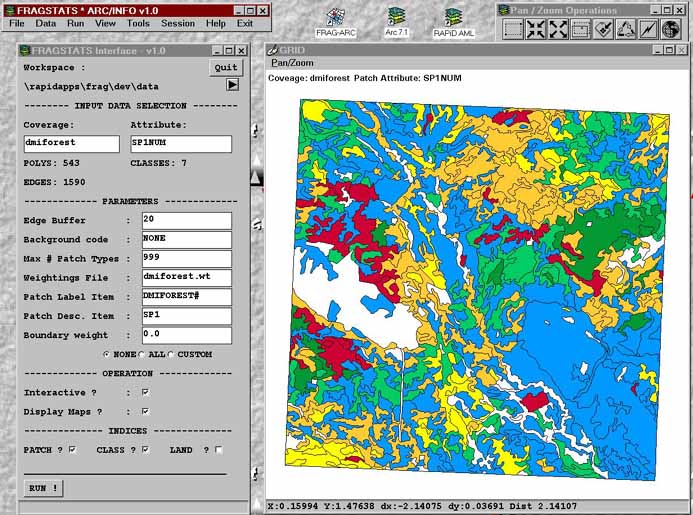
The specifications entered via the pull-down menus and pop-up dialog boxes form an AML (Arc Macro Language) command file which controls the data management and calculations. Figure 1 shows the FRAGSTATS Interface pull-down menu (extreme upper left), the Pan/Zoom Tool Bar (extreme upper right), the FRAGSTATS Run dialog box (left side), and the plot of the selected coverage attribute (right side). The upper portion of the Run dialog box enables specfication of Workspace and Input Data Selections. The Parameters section allows the user to easily modify program defaults via secondary pop-up menus or direct field entry. The lower portion of the Run dialog box sets the processing mode and indices for calculation. Completion of the specifications in the menu are accomplished by selecting, toggling, specifying or accepting defaults of menu items, with contextual guidance at each step and little or no contact with the keyboard.
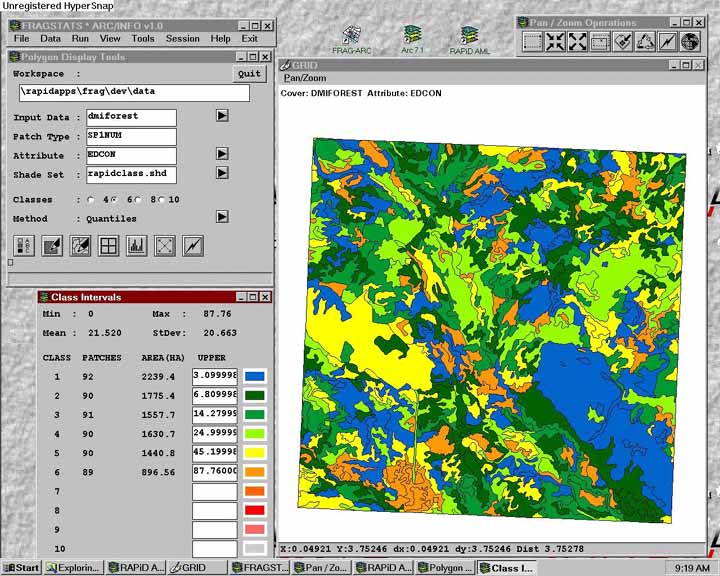
Upon program completion the calculations are stored as a series of INFO tables linked to the specified coverage. Figure 2 shows a Thematic Map display of the edge contrast index. The top left menu is completed by the user to identify the coverage, attribute for display, and map type. The lower left box contains the automatically generated legend linking the six quantile (equal count) levels requested by the user to the default color palate (darker tones indicate less edge contrast). Users can easily switch to another color pallet by
selecting one of several standard sets in the Shade Set scroll list, or designing their own. The number of display classes and thematic mapping method can be "toggled" and the display/legend is refreshed "on-the-fly." The display window (right side of Figure 2) can be automatically partitioned for simultaneous viewing (Multiple Windows Tool) of up to twelve different map displays of indices, mixing geographic areas, management scenarios, or summary graphs and tables.
Normally, FRAGSTATS output is limited a single formatted report which simply lists all of the indices for all of the polygons forming the input landscape coverage. Three tabular options are available in FRAGSTATS Interface: Listing of user-selected indices for on-screen review or export to other programs, Standard FRAGSTATS Formatted Report, and Custom Tabular Reports. The custom report generator in FRAGSTATS Interface outputs formatted tables containing user-defined sub-headings and statistics, such as the total Area and average Shape Index by Vegetative Species.
GRAPHICAL INTERFACE AND COMMON ENVIRONMENT
The FRAGSTATS Interface provides a common processing environment and graphical interface for running FRAGSTATS within a workstation ArcInfo configuration. User specifications for input maps, FRAGSTATS analysis parameters and ArcInfo output options are made by toggling options in a screen menu. The menu consists of scroll list of maps within the user�s active workspace, index level toggles (patch, class and landscape), verification fields, and display option toggles. During execution, the specifications automatically transfer the selected maps from ArcInfo to FRAGSTATS (export), calculates the specified
indices, transfers the results to a fully structured ArcInfo coverage (complete with related INFO tables), and generates the desired output products.
The FRAGSTATS Interface enables scientists and managers to interact with both FRAGSTATS and ArcInfo without extensive procedural knowledge of either system. It "seamlessly" integrates both systems in a friendly environment allowing users to directly concentrate on ecological planning and management implications, without the distracting "mechanics" of program control and output generation. Within the program, each vegetation polygon (i.e., patch) is identified by a Patch ID followed by a 2-column listing of the calculated metrics. The patch ID serves as the link between the tabular listing (attribute data) and the map displays of the polygons (spatial data) in the construction of fully structured ArcInfo tables containing the landscape indices.
The optional ArcInfo Query and Display module contains a graphical interface for constructing and automatically displaying database selections, such as selecting all "aspen (Aw) vegetation parcels > 15.00 hectares with a shape index > 2.00," then thematically mapping the relative Edge Contrast Indices for the selected parcels. The module provides several display options, including automated thematic mapping, generation of frequency plots, and multi-window screen partitioning. Figure 3 depicts the query and thematic plot described above with the map display, frequency plot and tabular summary in three partitioned windows. The Query menu on the left was activated simply by selecting Query & Display item from the Main Menu
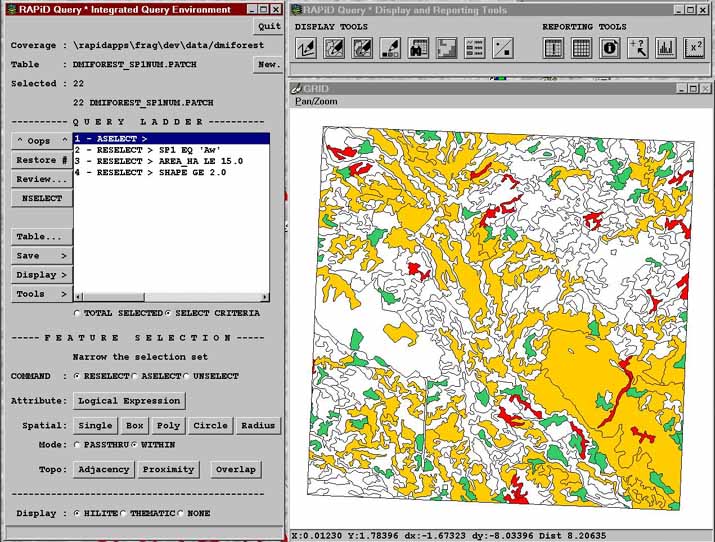
pull-down. By default, the current FRAGSTATS table is identified, or the user can select a new one from a pop-up scroll list of available tables. The Query Ladder tracks the sequence of queries entered by the userusing the Feature Selection buttons. For example, the second step in the ladder (RESELECT > Sp1 EQ �Aw�) selects the Aspen polygons (Aw) from all species polygons (Sp1) based on the logical expression of attribute equivalence (EQ). Spatial query (e.g., as all locations within .25 miles) and topological query (e.g., adjacent to) are available. Users can move up and down in the query ladder as they investigate different assumptions, then save their spatial reasoning (AML macro) to a file for later use. The Display Tools in the extreme upper right portion of Figure 3 allows users to quickly modify map displays and generate reports of query results.
Users of earlier versions of FRAGSTATS were required to pre-process ARC/.INFO vector coverages, such as DISSOLVE polygon boundaries, BUFFER edges, and UNION buffer and dissolve boundaries. Program interaction was restricted to command mode operation of AML macros with arguments, without the flexibility of a GUI interface. The output was restricted to formatted output files which was difficult to integrate with other programs, such as spreadsheets and databases, with no return linkages to ArcInfo for map display of the calculated indices or further GIS modeling. The major features provided in the FRAGSTATS Interface beyond the older versions of FRAGSTATS include:
EXTENDED INDICES, CUSTOM QUERIES AND RESULTS COMPARISON
A FRAGSTATS Extensions project is underway to provide additional landscape structure indices and new capabilities for generating custom queries and rapid comparison of FRAGSTATS output. Figure 4 identifies the conceptual approached in the seamless link of ArcInfo and FRAGSTATS with the highlighted portion depicting the map comparison extension. It will enable a user to launch several FRAGSTATS analyses, then generate comparative statistics and output these results as a variety of tables, charts and map displays. For example, a user might compare three harvesting scenarios for an area to determine which indices significantly change and output the results as a map of affected landscape units. In addition, support will be extended to the PC versions of FRAGSTATS and desktop mapping systems, such as ArcView and MapInfo, as well as a custom Esri MapObjects interface (GIS platform independent software). Several new indices and modifications, such as the lacunarity index and various other texture metrics, will be incorporated within the FRAGSTATS Interface/Extensions environment. The original FRAGSTATS code will be restructured to take advantage of the linked environment and allow direct access to individual indices.
INTEGRATING LANDSCAPE STRUCTURE AND FOREST GROWTH
A companion project is underway to investigate links to forest growth models. The FVS Interface is a prototype version seamlessly linking ArcInfo and the Forest Vegetation Simulator (FVS) program developed by the U. S. Forest Service (Wykoff et. al., 1982). FVS is a distance-independent, individual tree, forest growth model used extensively by many public and private organizations. It contains modules for growing trees, predicting mortality, establishing regeneration, predicting non-tree vegetation development, performing management activities, calculating tree volumes, and producing formatted reports on stand structure, species composition, and forest products. It allows the simulation of various management scenarios which generate predictions of forest dynamics at user-defined time steps for the vegetation units (polygons) within a chosen landscape. Earlier versions of the FVS program are difficult to use, require user manipulation for data file transfers, generate fixed formatted reports and does not have return linkages to for GIS processing. Like the FRAGSTATS Interface, the FVS Interface prototype extends the earlier version by providing a series of GUI menus for data handling and program control, with the results captured as ArcInfo tables for map query and display. The FVS simulated coverages are available to FRAGSTATS Interface for analysis of differences in landscape structure resulting from different management alternatives and driving variable assumptions used in the for3est growth model simulations.
CONCLUSION
The quantification of landscape structure provides a new set of tools for understanding the complex spatial patterns and interactions among landscape features. They promise new approaches for the visualization, formulation and solving of real-world problems. However, the tools must be integrated into a system designed for use by resource managers, scientists and other end-users with minimal procedural knowledge of the programs involved. The FRAGSTATS Interface and Extensions projects achieve this integration by seamlessly linking the ArcInfo and FRAGSTATS programs into a common graphical user environment for storage, processing and displaying of mapped data used in landscape analysis.
Acknowledgments
Three groups are collaborating on the FRAGSTATS Interface and Extensions projects. The authors of FRAGSTATS, Kevin McGarigal and Barbara Marks, provide ecological expertise, algorithm design and computational code development. Innovative GIS Solutions (IGIS) are experienced ArcInfo developers and provide expertise in linking the two programs. Berry and Associates // Spatial Information Systems (BA_SIS) provides project coordination and expertise in GIS modeling and spatial statistics. The projects described extend the original FRAGSTATS effort supported by the Coastal Oregon Productivity Enhancement Program of which the USDA Forest Service Pacific Northwest Research Station (PNW) is a major partner. Examples and further information on the FRAGSTATS Interface, ArcInfo Query and Display module, future FRAGSTATS Extensions, and related software are available on the World Wide Web at http://www.innovativegis.com
References
Esri, 1992. Understanding GIS: the ArcInfo method. Redlands, California: Environmental Systems Research Institute.
Forman, R.T.T. and M. Gordon. 1986. Landscape Ecology. New York: John Wiley & Sons. 619 p.
Li, , H. 1990. Spatio-temporal pattern analysis of managed forest landscapes: a simulation approach. PhD. Thesis, Oregon State University, Corvallis, Oregon. 166 p.
McGarigal, Kevin and Barbara Marks. 1995. FRAGSTATS: spatial pattern analysis program for quantifying landscape structure. Gen. Tech Rep. PNW-GTR-351. Portland, Oregeon: USDA Forest Service, Pacific Northwest Research Station. 122 p.
O�Neill, R.V., J.R. Krummel, R.H. Gardner, G. Sugihara, B. Jackson, D.L. DeAngelis, B.T. Milne, M.G. Turner, B.Zygmunt, S.W. Christensen, V. H. Dale, and R.L. Graham. 1988. Indices of landscape pattern. Landscape Ecology 1:153-162.
Turner, M.G. 1990. Spatial and temporal analysis of landscape patterns. Landscape Ecology 4:21-30.
Turner, M.G. and R.H. Gardener (eds.). 1991. Quantitative Methods in Landscape Ecology. New York: Springer.
Wykoff, W.R., N.L. Crookston, and A.R. Stage. 1982. User�s guide to the stand prognosis model. General Technical Report INT-133. Ogden, UT: USDA Forest Service, Intermountain Forest and Range Experiment Station.