Abstract: The Florida Department of Transportation (FDOT) Work Program GIS Application (WPAGIS) is a custom application utilizing ArcView Ò GIS Version 3.0 by Environmental Systems Research Institute, Inc. Ò (Esri Ò ) of Redlands, CA, and was developed using Avenue Ò , the object-oriented programming language for ArcView. This application employs techniques such as automated data replication, client/server network architecture, dynamic segmentation, and Structured Query Language (SQL) connection to an ORACLE Ò database server using Open Database Connectivity (ODBC) protocols.
This paper provides an historical background concerning the FDOT Work Program and provides information as to why a GIS was needed. It also provides a description of the application that was developed to meet this need and describes key aspects of the implementation methodology that are believed to be common to many large scale GIS implementation efforts.
Background
The FDOT plans and finances its improvements to the state transportation system through its Five-Year Work Program (WP). This includes the maintenance and expansion of the entire state-supported system for the current and next five fiscal years. This process is part of the Transportation Improvement Plan (TIP) that is required by the federal, state and local governments.
The WP planning and financing process goal is to provide a consistent, equal and efficient use of funds. The most intense activity involved in this process takes place during what is known as the "annual gaming cycle" which begins each September and lasts until March. During this time, the WP staff constantly manipulates funds and projects within financial limitations in order to adequately address the state transportation system needs. During this cycle, the WP data changes every minute. As the WP staff work through the gaming cycle, certain scenarios are set aside as possible alternatives. Once the final options are selected, they must be presented and approved within FDOT, by the corresponding Metropolitan Planning Organizations (MPO) and local governments, the public, and the legislature. So, in addition to needing an analysis tool to help with the WP process, it is necessary to be able to produce timely, accurate and easily read maps illustrating the WP scenarios.
The FDOT WP staff uses several different data sets. The main database that they use is the Work Program Administration (WPA) database. This database currently exists on a mainframe using DB2Ò . Each WP project contains descriptive data such as its identification number, the roadway identification number on which it occurs, its beginning and ending mileposts, and other descriptive data. For each project there exists multiple phases such as planning, preliminary design and engineering, right-of-way (ROW) acquisition, and construction. For each phase, there are multiple funding sources. In addition to the WP data, there is also data about the physical characteristics of the road system, bridge data, railroads, airports, and seaports. This leads to a very large and complex database involving one-to-many and many-to-many relationships.
Prior to the development of the WPAGIS, WP staff used reports, tables, spreadsheets, CAD, and numerous software programs running on different platforms to accomplish their job. The maps that were used are of two different types: a) CAD base maps with manual symbols (i.e. color markers, color tape, or manual CAD symbols noting type and location of projects) produced with help of the planning and production staff, b) GIS maps created at the central GIS support center in Tallahassee using GDS Ò . The manual ones were inaccurate, not easy to update, and were too labor-intensive. The GDS maps required approximately two to four weeks to receive due to data processing delays and the heavy workload of the GIS support center. In addition, the GIS support center was only able to map those projects on the intrastate highway system. Neither of these options was particularly attractive when dealing with data that changes daily.
Other pre-WPAGIS constraints and obstructions included:
What is the WPAGIS?
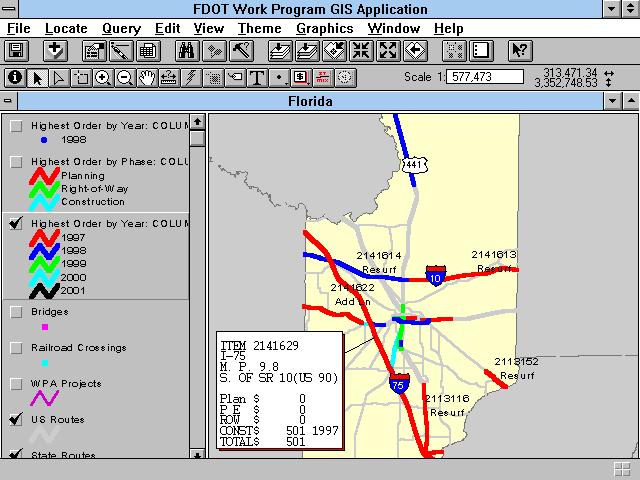
The WPAGIS was initially developed as part of a pilot study in three of the eight districts. It uses ArcView 3.0 running on desktop PCs using Windows NT. This application allows timely query, analysis and mapping of WP data by the WP staff. It was developed with close cooperation and teamwork between the consultants and the Department. Shown below is a snapshot of the application in action.
How does it work?
The WPA data is replicated in an automated fashion each night from the FDOT Central Office mainframe in Tallahassee to each of the three pilot districts via the Wide Area Network (WAN). The WPA is a hierarchical IMS/DB Ò mainframe database that has data subsets extracted out into a series of relational DB2 Ò tables. This data warehousing process of building this denormalized set of relational tables involves other databases besides WPA. Two software packages from Platinum Technology Ò, Fast Unload for DB2 Ò and Data Transport Ò, then complete the process. Fast Unload sweeps the DB2 tables and applies the district-specific selection criteria to create the district-specific data extracts. Then Data Transport establishes a connection with each of the district servers via TCP/IP protocols, transmits the data, and invokes an agent load process which then loads the data into ORACLE using the ORACLE load utility. There are approximately 100,000 rows of data per district replicated nightly. The receivers of this replicated data are relational ORACLE databases running on IBM Ò SMP Pentium Pro Ò Windows NT servers.
The clients (WP staff with ArcView and WPAGIS on their desktop PCs) access this attribute data via the Local Area Network (LAN) using the SQL Connect function of ArcView and standard ODBC protocols. This attribute data is then mapped "on-the-fly" onto an ArcInfo Ò route system using dynamic segmentation. This then allows full data integration with CAD and GIS graphic reference layers, the bridge database, the physical roadway characteristics database, and numerous lookup tables within one software program.
What can it do?
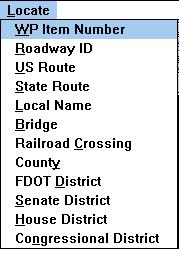
The WPAGIS includes an on-line customized Windows hypertext Help system and Data Dictionary with Metadata. The main custom functionality is available from two pull down menu choices from the ArcView View Graphic User Interface (GUI). The Locate menu choice gives the user access to twelve standard functions to locate, zoom and automatically label WP projects, roads, interstates, US highways, State roads, bridges, railroad crossings, counties, FDOT districts, and Senate, House, or Congressional districts.
The Query menu choice gives the user access to seven pre-defined analysis mechanisms. The WP project query performs the same operations as the locate tool, but also produces a detailed report in ASCII text format. This report is automatically displayed using Windows Notepad and provides details about the project specifics, calculates and summarizes total project spending, and breaks down spending by phase, fiscal year, program and fund. The Program Number query allows the user to map projects based on their program number, or type, (i.e. program number 3006 = Construction � resurfacing for non-turnpike roads). The Significant Projects query allows the user to map projects that cost more than a user-specified dollar amount (i.e. all projects that cost over $10,000,000). The System Type query allows the user to map projects that occur on a specific road system (i.e. all projects on the turnpike system only). The Highest Order Phase/Year query allows the user to map the highest order phase and fiscal year for WP projects. Highest order refers to the "highest", usually most expensive and important, phase of a project where order increases as a project moves from the planning phase, to preliminary design and engineering, to ROW acquisition, and finally construction.

For these queries, the user can specify report status (adopted, candidate, proposed, or several gaming scenarios) and an area of interest (any county or the entire district). In addition, the WPAGIS will always separate out all unmappable projects into their own table, this provides an automated QA/QC tool. It will also map any bridges, which fall within the bounds of a project, as point features.
Another query tool, termed "MAD DOG", that was added allows the user to specify multiple values for any combination of up to thirteen critical WP project variables and view/map the results. For instance, WP staff can query for all projects that: occur in fiscal year 1999/2000, have a construction phase during that year, are in Alachua and Marion Counties, are funded by a federal highway fund, occur on the Interstate system, and involve addition of new lanes. This highly flexible tool provides WP staff with an easy-to-use query tool to construct complex queries and eliminates the need to know SQL or some other type of query language. In addition, it presents graphic results on a map as well as the associated attribute table.

The WPAGIS also contains an automated map layout function that generates layouts based on user input of template choice, page size, page orientation, page margins, output resolution, title, and a map creator's name. There are also three specialized tools in the toolbar. The text box tool allows the user to generate a color-coded data-driven text box with a leader line that matches the color of a WP project and details descriptive project information as well as fiscal year and summarized financed amounts. The WP item/workmix tool allows the user to label any project with its WP identification number and workmix (the short description of project type, i.e. multi-lane reconstruction). The highway shield tool allows the user to automatically label any State Road, US Highway, or interstate with a shield symbol and number. As the user clicks on a roadway, the WPAGIS queries the database to find the number for the road, then selects the appropriate shield symbol. It then dynamically scales the shield symbol based on the number of digits in the number and places it in the view.
In addition to these scripted functions, the users have access to all of the default ArcView functions which allows them to use its easy-to-use Windows GUI to perform ad hoc queries, tabular and spatial analyses, summarize and aggregate data, and produce reports and charts.
The WPAGIS also allows the user to save a "snapshot" of the data they are using to their own PC's hard drive. This allows the comparison of historical data sets and allows the electronic presentation of this data at meetings and public hearings away from the office using portable PCs.
Where do we go from here?
The next phases of this project include:
Key Aspects of Implementation Methodology
There were several keys to the WPAGIS implementation methodology that have contributed to the project's success thus far. This section discuses the more important keys to success which are believed to be pertinent to many large scale GIS implementations.
Read-Only Data Duplication
Because the WPAGIS required timely data access from a variety of large FDOT databases, it was quickly determined that if the data was to be accessed from a central server, the amount of data traffic required to support the application would far exceed the capacity of the state WAN. Further, it was determined that hard drive space was more readily available, and cheaper, than bandwidth both on each district's LAN and on the statewide WAN. For this reason, data replication software was utilized which enabled FDOT to distribute all data to the location best suited to serve the users. When data updates occur to the main central server, the replication software distributes these changes to the appropriate locations of duplicate data. This automated update process not only improved the WPAGIS application's response times but it made the application viable without jeopardizing the integrity of the database.
It should be noted that only the WPA attribute data is replicated. All of the other attribute data and GIS reference layers, including the route system base map, is resident on each client's hard drive. This decision was made due to the different computing environments at each location and the need to maximize display performance. Another reason this was done is that these other data sets do not change as often as the WPA data, thus data replication is unnecessary. Also, some of these data sets are very large and the duplication process would become too large of a burden on the WAN. Certainly if a computing environment permitted, these could be loaded onto the local server and accessed via the LAN, this could also be true for ArcView and the WPAGIS program itself.
At this point, the entire WPA data set is replicated nightly. Future plans include a migration toward replication of only data that has changed. In addition, local data replication may also be used to update the base map, the WPAGIS application, and any of the other data sets from the WAN to the local server, and then across the LAN to each client. This would allow a "transparent" centralized application maintenance process.
Rapid Application Development
At the onset of the project, a user needs assessment was performed which led to the creation of a User Requirements Analysis document and an Application and Database Design document. These documents were useful in establishing the application framework and general functionality of the system, but the application really began to take shape as a result of weekly WPAGIS Task Work Group (TWG) meetings. The attendees of the WPAGIS TWG meetings included at least one individual from each pilot district as well as the GIS consultant and programming staff. Throughout the development process, these meetings were an excellent brainstorming forum for designing and evaluating the application in meeting the user's needs, expectations and performance requirements.
During each meeting, changes made to the application since the last meeting were demonstrated, comments and suggestions were discussed and documented, and potential new functionality was identified for future development. Also, each new function was given man-hour and cost estimates, this allowed the prioritization of the development of the functions. This process helped achieve the best product, in the least time, with the most functionality. It also proved an effective mechanism for finding a common ground amongst the different users, and helped to design an application that was acceptable by the entire TWG, since each of the members of the group contributed to the design of the application. Because the users were such a close part of the application development process, they knew exactly what it could and couldn't do, and helped to make them feel that it really was their tool. This cooperative process eliminated the surprises which often occur when a product is developed within a vacuum, with only a couple of documents and diagrams to light the way.
Single ArcView Project File Statewide
In order to keep the installation and subsequent updates simple and manageable, the application was designed to use a single ArcView project file. This was a difficult issue because the WPAGIS database at each district location included only that district's data, and this data changes daily. Thus single statewide themes and data tables could not be pre-installed. Instead, a large part of the application is loaded dynamically as a project startup script. Each dynamic segmentation event theme, each table, and many of the menus are data-driven and loaded at startup "on-the-fly".
Author Information:
Mr. Adam M. Carnow
GIS Director
GeoComm International Corp.
6610 E. Fowler Ave., Suite C
Tampa, FL 33617
(813)989-9550 TEL.
(813)899-2207 FAX
acarnow@geocomm.com E-mail
Mr. T.C. Herman
Vice President
GeoComm International Corp.
1811 E. John Sims Parkway
Niceville, FL 32578
(904)897-6778 TEL.
(904)897-1001 FAX
tcherman@geocomm.com E-mail