Abstract
The basic function of a municipal water utility is to ensure that acceptable water quality and quantity is delivered to the end user at the desired time. A major task of this function is to ensure the serviceability of the delivery system. As the distribution infrastructure ages, it becomes more and more of a challenge to assign limited capital expenditures to prioritize the repair, replacement, or rehabilitation of pipelines. Seattle Public Utilities has embarked on the development of a comprehensive Pipe Evaluation System (PIPES) application to evaluate its water pipelines. This application fully utilizes the Seattle Public Utilities’ extensive GIS database to create a user friendly interface to rank pipelines for prioritizing purposes. The PIPES application is developed based on an object oriented modeling approach. This approach allows for the addition of new models or parameters as they become available. The current system consist of a vulnerability model, a criticality model, and a deterioration model. All three models rely extensively on GIS analysis of the spatial relationship between pipelines and various data layers and attributes. With this application, the water utility engineers, managers, and decision makers will be better able to take a proactive approach in making informed decisions and prioritizing its capital expenditures to ensure the health of Seattle Public Utilities’ water delivery system.
Seattle Public Utilities has the largest water utility in the State of Washington and one of the largest in the nation. The water utility supplies high-quality water to nearly 600,000 people in the metropolitan Seattle area through direct retail service and another 625,000 people through 28 wholesale customers. The area served by the regional supply system covers 320 square miles. The water pipeline system consist of 160 miles of supply mains, 45 miles of feeder mains, and 1620 miles of distribution mains. The age of the pipeline system range from newly installed to over a hundred years old. Various different pipe materials were use throughout the years with varying installation quality and in as many different environmental conditions.
As the water distribution infrastructure ages, it becomes more and more of a challenge to assign limited capital expenditures to prioritize the repair, replacement, or rehabilitation of pipelines. There is a growing need by municipalities to find better ways to prioritize their future projects. Much research has gone into the process of water distribution system rehabilitation planning. The American Water Works Association (AWWA), American Society of Civil Engineers (ASCE), and other professional associations have published numerous texts regarding this subject. Results and recommendations from these research have been adopted by water utilities in varying degrees. Most water utilities have adopted some form of subjective ranking system to prioritize the rehabilitation of their pipelines. A smaller number of water utilities have done statistical analysis to predict failure of the pipelines and incorporate the results with a cost-benefit analysis. One of the main reason few water utilities have done statistical analysis to predict failures in their pipelines is due to the high cost of collecting good data to support such an analysis. But if data is available, the daunting task of data compilation and maintenance to support even a more subjective ranking system can be cumbersome, rigid, and usually not very user-friendly. Usage of computer programs written in second or third generation programming languages are usually left to a select number of analysts or engineers and results are shared through scrolls of hardcopy printouts.
With the tremendous growth of GIS implementations comes the demand to realize the benefits of such expenditures. The power of a GIS implementation to perform spatial analysis and its inherent function to store tons of data related to the spatial features makes it an ideal tool to support the evaluation of pipelines for all the purposes described earlier. Seattle Public Utilities has embarked on the development of a comprehensive Pipe Evaluation System (PIPES) application to evaluate its water pipeline system. This paper is an attempt to introduce the PIPES application and to share some of the experiences gained from the development process.
The PIPES application is a tool to assist users in evaluating Seattle Public Utilities’ water pipeline system. This application fully utilizes SPU’s extensive GIS database to create a user friendly interface to rank pipelines, to prioritize the repair, replacement, or rehabilitation of pipelines. The PIPES application is developed based on an object oriented modeling approach. This approach allows for the addition of new models or parameters as they become available. The initial system will consist of three models - deterioration model, vulnerability model, and criticality model. All three models rely extensively on GIS analysis of the spatial relationship between pipelines and various data layers and attributes.
The Deterioration Model is derived from a statistical analysis of the pipelines’ break history and how it correlated with direct or surrogate parameters associated with each pipeline. Examples of significant parameters that correlated to breaks include the length of pipe, diameter of pipe, static water pressure, pipe material, age of pipe, and whether a pipe is located on steep slopes. As a result of the statistical analysis, a number of equations were generated that will be used to calculate the probability of failure of the pipes. These equations are built into the PIPES application and will be accessed when the deterioration model is selected to evaluate the pipelines. Further discussion of the statistical analysis process is covered in the section on Objective Evaluation.
The Vulnerability Model and Criticality Model consist of a number of parameters that can be selected and ranked subjectively to evaluate the vulnerability or criticality of the pipelines. These two models will provide the answer to questions like "Which pipelines are in need of rehabilitation or replacement and which pipelines will cost us most if a break occurs?"
Examples of vulnerability parameters include soil corrosivity, corrosion protection, pipe material, age of pipe, type of landuse zoning the pipe is in, and whether the pipe is located in liquefaction zones or steep slopes.
Examples of criticality parameters include whether pipes are directly connected to hospitals, medical facilities, kidney patients, dialysis centers, community centers, schools, major water users, and whether the pipe is located in floodprone areas.
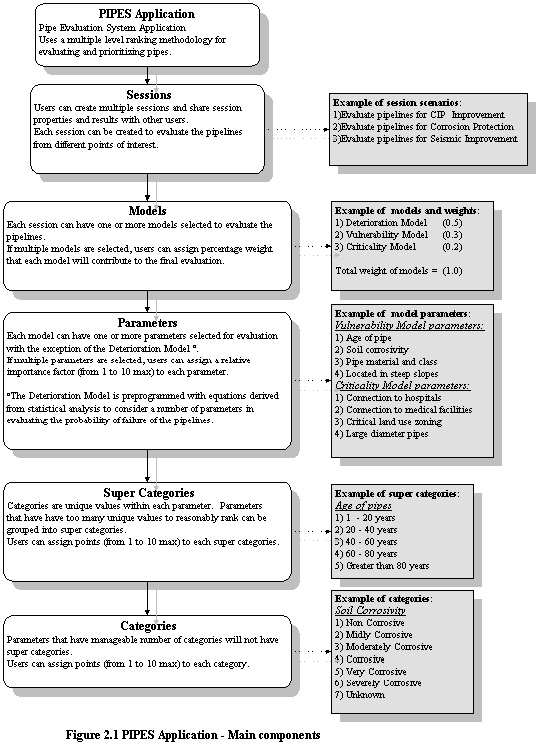
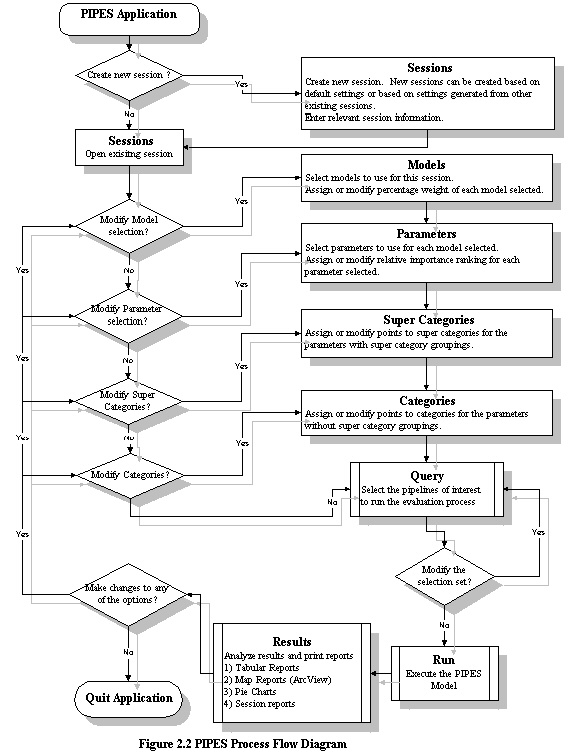
The application is designed with the flexibility to allow users to rank or prioritize pipelines from different points of interest. For example, the application can be used to rank pipelines for CIP improvements, or to prioritize pipelines for corrosion protection, or to prioritize pipelines to improve seismic reliability. This flexibility is achieved by allowing users to create "sessions" that are tailored to a specific point of interest. With each new session, the user will be able to select the models to use for evaluating the pipelines and within each model, the user can select the parameters to use. All the input information generated by a "session" created by one user is available to other users who wants to review the results or create new "sessions" based on those properties. Figure 2.1 provides an overview of the different levels that a user will need to interact with in order to prioritize the pipelines. Figure 2.2 shows the process flow for a user of the PIPES application.
The application does not store session results in the database, instead the application stores all the properties of a session. This include information on the models, parameters, categories, and all the ranking points assigned for the particular session. This approach reduces the storage space required since the potential for multiple sessions being created by multiple users to evaluate thousands of pipes in the system could quickly take up a lot of disk space if all the results are saved in the database. The advantage of storing only the session properties is that the same session can be re-executed periodically when enough changes in the pipeline attributes have taken place. The most frequent changes would occur as pipelines are rehabilitated or replaced in the system. Other parameters such as landuse zoning, soil type, and neighborhood areas are less likely to change much over time.
The use of statistical analysis to predict failure has a lot of benefit in the ranking or prioritizing process, especially since it is an objective evaluation, there is little interaction required by the end user. However, the process of ranking and prioritizing projects may involve much more complex issues such as politics and other areas that require sound engineering judgment. To consider these issues, a more subjective ranking system may be required. A more subjective ranking process is also required to consider events that may not have adequate historical data to support a statistical analysis. The evaluation methodology adopted in the PIPES application combines the benefits of the two approaches - an objective evaluation and a subjective evaluation.
The purpose of the statistical analysis is to determine if any combination of available data (e.g., pipe age, diameter, leak history, installation date, soil type, zoning etc.) could be used to predict the time and probability of leaks in water pipes. The final output of the model is a listing of main segments prioritized on the probability of failure for a given time period.
Data were collected from Seattle Public Utilities’ GIS and Seattle City Light (SCL) GIS. The data were formatted for use in the statistical software package S-PLUS (Version 3.1 for Windows). Quality control techniques were used to eliminate bad data, such as those pipes with leak dates prior to the installation date, and those pipes which could not be classified into categories of interest for this study
Standard regression analysis, whether linear or non-linear, is inappropriate for projects that contain censored data. Censored data, in the case of water pipes, are pipes which have not yet leaked. That is, they have not had a failure within the time period beginning with their installation and ending with the time of this study. Information on censored pipes is as important as information on pipes which have leaked within the study period. In a standard regression analysis, the time until first leak for these censored pipes would either have to be ignored (i.e., the data discarded) or the failure time estimated as some time in the future. Both methods would result in biased model parameter estimates, and poor predictions. For example, if censored data are ignored, the time until first leak will be grossly underestimated. Estimating the failure time for censored pipes (perhaps as the censored time plus a constant) could lead to bias in either direction. Failure time analysis is a statistical technique for estimating failure times when some data are censored.
Failure time analysis was used to account for the unobserved, or censored leak times, since most of the pipes in the study have never leaked. Standard regression techniques would model the time until first leak as some function of the independent variables. Failure time analysis models the probability that the pipe will fail before a certain time as some function of the independent variables. These probabilities for the first and subsequent leaks in water pipes were modeled using various techniques. The Weibull regression model was determined to be the most appropriate model, based on the available data.
The survival function for the Weibull distribution:
S(t|X) = exp[-(t/a (X)) d ],
where a (X) = exp(a 0 + a 1x1 + a 2x2 + …+ a kxk). A positive value of a i increases this survival function, the probability of surviving beyond time t.
For the first leak, the estimate for the Weibull scale parameter (a (X)) for each set of independent variables is:
a (X) = exp[(3.987) + (-0.0002) x length + (.0154) x diam + (0.0161) x epoch
+ (-.0035) x press + (-0.0738) x steep + (-0.0763) x mat + (-0.1429) x soil ],
where:
length = the length of the pipe in feet.
diam = the diameter of the pipe in inches.
epoch = the number of years between the installation date and 1996 (time of study - equivalent to age of pipe).
press = the pressure in the pipe in PSI.
steep = 1 if the pipe is on a steep slope, 0 otherwise.
mat = 1 if the pipe is made of galvanized iron, 0 otherwise.
soil = 1 if the pipe is located in TB or VL soil, 0 otherwise.
The variables length, epoch, material and press remained significant as predictors of second leak time. No independent variables were found to significantly affect the time of third or subsequent leaks.
The basis of a subjective evaluation is to provide the means to determine rational weightings between many attributes, factors, or issues that may influence the outcome of a judgment. Some rational weightings may require sound engineering judgment, while others may be more of a business policy. In order to prioritize or rank pipelines based on numerous different areas, a methodology to transfer subjective factors into a point system will be adopted. The point system adapted to rank the pipelines utilizes a multi-level multiplication approach.
The first level is in assigning the weight that each model selected will contribute to the final score. For example if all three models are selected - deterioration, vulnerability, and criticality models - a percentage weight that each model will contribute to the final score may be assigned such as 50%, 30%, and 20% respectively. The total weights from all models should equal 100%.
The second level of the point system is to assign a relative importance factor to each parameter selected form each model. Each model can have one or more parameters selected for evaluation with the exception of the Deterioration Model. The Deterioration Model is preprogrammed with equations derived from a statistical analysis that has pre-identified a few parameters as being significant in predicting the probability of failure of the pipelines. For the subjective models, the relative importance factor (from 1 to 10 max) will be used as a multiplier to calculate the final score. The most effective way to rank the parameters is to select the most important parameter and assign the maximum point to it. Then based on a relative importance scale in relation with the highest assigned parameter, rank all the other parameters. For example, four parameters are selected for the Vulnerability Model - a) age of pipe; b) soil corrosivity; c) pipe material and class; and d) whether a pipe is located in steep slopes. Now if the most important parameter that would determine the vulnerability is (d), then a value of 10 is assigned to this parameter. Next, the question is asked "How important are the other parameters in determining the vulnerability of the pipeline with relation to (d)?" If the answer for one of the other parameters is "half as important", then the relative importance is 5 points. If (d) is ten times more important, then the relative importance is 1. If (d) is a hundred times more important than a certain parameter, then perhaps that certain parameter is too insignificant and it should not be included in this evaluation. The user can easily add or remove parameters from selected models.
The third and final level of the point system is to assign points (1 to 10 max) to each category under each parameter. Categories in the PIPES application refer to the unique values that make up each parameter. For example, the soil corrosivity parameter consist of seven categories - a) Unknown b) Non Corrosive; c) Mildly Corrosive; d) Moderately Corrosive; e) Corrosive; f) Very Corrosive; g) Severely Corrosive. However, there are a number of parameters that have too many unique categories to rank them individually. For these parameters, the categories are grouped into super categories and the ranking points are assigned to these groupings instead. An example of a parameter with too many unique categories to logically rank is "Age of pipe." For this parameter the super categories would consist of pipe ages that are grouped into ranges: 0-20 years, 20-40 years, 40-60 years, etc.
The points system calculation are summarize by the following equations:
Pipe score from one model = Sum n [(Relative Importance) x (Category or Super Category Ranking)]
where n = number of parameters selected for this model
Total multi-model score = Sum m[(Pipe score from each model) x (Weight of model)]
where m = number of models selected
Total normalize score = [(Total multi-model score) / (Max score that can be obtained)] x 100
The backbone of the whole evaluation process rest on the GIS analysis and data processing to provide all the attributes of the pipelines as well as to find spatial relationships to other layers of information. To maximize the performance of the application, the GIS analysis step is done as a preprocessing step. All attributes identified as parameters to be used for statistical analysis as well as for ranking the pipelines are denormalized into a single table. The following are some of the GIS analysis and processing performed to compile the information for this application:
- Identify and compile essential attributes of the water pipeline from the GIS database and various other related tables.
- Combine segments of pipelines to produce pipe segments of similar characteristics that are more representative of City blocks. The combined pipe segments are more closely related to pipeline projects. In other words, a project to rehabilitate or replace pipelines will more likely be carried out on a whole City block than on individual pipe segments as capture in the GIS. Pipe segments captured in the GIS are split at all fittings and junctions to provide the most detailed information that would meet all usage requirements of the GIS database.
- Perform overlay analysis of the pipelines to capture layers of information that are represented by polygon features such as soil, water pressure zones, land use zoning, steep slope areas, landslide areas, liquefaction zones, flood prone areas, neighborhood classification, etc.
- Perform proximity analysis of the pipelines to capture layers of information that are represented by point and line features such as soil corrosivity points, electrical vaults, underground conductors, etc.
- Perform calculations of annual water usage by linking GIS pipeline data with external database that provides information on customer water usage.
- Perform calculation of static water pressure by relating pipelines to the elevation contour layer and the pressure zones that the pipelines fall within.
- Perform statistical summary on the number and types of service taps to the pipeline segments.
- Perform connectivity analysis of pipelines to critical services such as hospitals, medical facilities, dialysis centers, schools, etc.
- Compile and create additional data from other independent studies that would be beneficial to this pipeline evaluation process such as information about the seismic reliability of pipeline segments.
There are many advantages of using object-oriented techniques but the two most important reasons for using it in the analysis, design, and implementation of PIPES are:
- Extensibility: This is essential to add new models and parameters to the application with minimal effort and cost.
- Maintainability: This allows for the modification of the application functionality as the models are improved or changed without having a rippling effect on the rest of the application.
In the analysis phase use-case modeling technique developed by Ivar Jacobson et al. (1992) were used. The use-case model is an external view of a system. In a use-case model, actors represent roles that users can play and use-cases represent what the user should be able to do with the system. Each use-case is a complete flow of events in the system, as seen from the user’s perspective.
In a use-case model a stick figure represents an actor and an ellipse represents a use-case. An arrow between an actor and a use-case implies that they can communicate or cooperate with each other. When a use-case supplements another, it has an extends association with it. The extends association is represented in the use-case model by a dotted arrow with the word extends on its body. A uses association is used to show that descriptions of transactions are shared by several use-cases. The uses association is represented in the use-case model by a dotted arrow with the word uses on its body.
The following major use-cases were identified for the PIPES application:
In the design phase of the application object modeling was used to build the conceptual model -- object modeling techniques as described by James Rumbaugh et al. After identifying the objects and the static relationships, the object model is populated with attributes and behavior of each object. Object interaction diagrams are used to specify the collaborations of various objects to achieve the system functions as documented in the use-cases. The physical data model is extracted by converting the object model into an entity-relationship diagram. The physical model is then refined for performance and other implementation specific issues like indexes and views.
In the implementation phase, the scripts are generated to create the physical data model. The behavioral aspects of objects are implemented as stored procedures in the database. Concepts like encapsulation (hiding the implementation) and polymorphism (behaving differently for the same message) are exploited. The application graphical user interface used inheritance to provide ease of modifications and consistent look and feel.
For implementing PIPES the following development environment was used:
The PIPES application is a comprehensive and flexible tool for evaluating or ranking pipelines from different points of interest. This section will introduce a few user scenarios to help illustrate how a user might use this application depending on what type of evaluation is desired.
For CIP improvement, the criteria that can be used to prioritize pipelines for rehabilitation or replacement may include a wide variety of factors. Some of the current factors used to evaluate the replacement of distribution mains are based on fire flow protection and elimination of substandard sized pipes and materials.
The process to prioritize pipelines for CIP would benefit from a more comprehensive approach. With the PIPES application, a more comprehensive approach can be obtained by selecting all three models available for evaluation - Deterioration Model, Vulnerability Model, and Criticality Model. In this prioritizing scenario, the most important factor may be to determine the pipelines that are most likely to fail in the near future (Deterioration Model), the second factor may be to target pipelines of known substandard sizes or material type (Vulnerability Model), and as a final prioritizing factor may be to identify services to critical customers (Criticality Model). The PIPES application will allow the user to assign the percentage weight that each model selected will contribute to the final normalized scores. For example, the user might assign 50% weight to the Deterioration Model, 30% to Vulnerability Model, and 20% to Criticality Model.
The Deterioration Model will provide an objective evaluation of the probability of failure for the pipelines based on parameters that were found to have significant correlation to pipe breaks or leaks. This model will use a number of equations programmed into the application that were derived from a statistical analysis conducted previously. The use of this model will rank the pipelines on the probability of failure for a predetermined number of years into the future. Hence, in prioritizing the replacement or rehabilitation of pipelines, it would make sense to target the pipes with higher probability of failure than the ones with lower probability.
The Vulnerability Model is added to this evaluation scenario in order to take into consideration some of the factors that may not be addressed by the Deterioration Model. For example, although the Deterioration Model takes pipe material into consideration, it combines a number of different pipe materials together as having the same probability of failure. The process of combining data in the statistical analysis is necessary due to insufficient or grossly unequal sample sizes and other practical data limitations. By adding the Vulnerability Model, the evaluation process can be further refined by ranking certain pipe materials such as Asbestos Cement, Kalamein, or Vitrified Clay as higher than others. For example, if two pipes end up with the same scores based on the Deterioration Model, but one of them is Concrete Cylinder while the other is Asbestos Cement, the later pipe will be ranked higher in the final score when points from the Vulnerability Model is added.
The Criticality Model is added to this evaluation scenario in order to take into consideration some of the more subjective aspects of prioritizing pipes. Some of the parameters available in the Criticality Model include the identification of pipelines that are primary connections to hospitals, medical facilities, kidney patients, schools, community centers, etc.; pipelines that are located in flood prone areas or in steep slopes that a break may result in costly damage to nearby houses; or pipelines that are located in certain neighborhoods or landuse type; or pipelines that supply water to major water users. The points assigned to the Criticality Model parameters and categories will provide additional subjective measures to the evaluation process.
In order to evaluate the pipelines solely for prioritizing the installation of corrosion protection, only a number of specific parameters of interest can be used. The criteria for selection may target pipelines of a certain diameter and material type. Additional consideration may include soil corrosivity and corrosion protection currently employed. For example, the goal may be to prioritize critical pipelines that are close to known corrosive soils that do not have adequate corrosion protection.
In this scenario, all three models may be selected for evaluation. However, different parameters from these models may be used. This scenario also presents a different perspective in interpreting the results of the combined multi-model scores. In prioritizing pipelines for corrosion protection, pipes that are most likely to fail in the near future and hence are most likely to be replaced should perhaps not be considered for any further corrosion protection. The combined multi-model results will reflect total scores obtained from the different models. The user can then elect to drop pipelines that have high scores generated by the Deterioration Model from the priority list.
Similar to the scenario above, the evaluation of pipelines for seismic reliability may rely on only a few specific parameters of interest. Parameters such as liquefaction zones, steep slopes, pipe material, and joint restraints are extremely important to evaluate the vulnerability of these pipelines from a seismic hazards perspective. In contrast, whether a pipeline is in liquefaction zones may not be a major consideration for corrosion protection and is not considered in the Deterioration Model.
However, the selection of all three models for this scenario will provide a more comprehensive evaluation of the system. If pipelines are to be prioritized for seismic upgrades, then the consideration of pipelines that are most likely to fail as well as the pipelines that are supplying water to critical services will only enhance the overall selection process.
After the main segments are ranked using one or more models the engineers will have to do an economic analysis to determine whether a pipe should be replaced or rehabilitated. This process has to be done for all the mains in the study before an overall strategy or long-term planning can be done. It is highly desirable to add a cost model to the PIPES application. The cost model should calculate the total cost of replacing a pipe segment versus the cost of rehabilitating it. The unit costs used by the model should be a variable and should depend on the zoning (or neighborhood), diameter, length and other significant costs. A study of the historic costs for main replacement and repairs should be done to determine these unit costs.
As additional information related to the pipelines are compiled, the data of interest to the evaluation process will be incorporated into the application. As users of the application becomes more familiar with the usage of the application, request to incorporate additional data related to the pipelines will increase. Some examples of these new parameters are as follow:
- Incorporate external studies of landsliding hazards due to various earthquake scenarios. This study is being done for the Seattle area by GEO-HAZ Consulting, Inc., where landslides from the 1949 and 1965 earthquakes serve to calibrate the model. Study is funded by USGS-NEHRP.
- Incorporate hydraulic modeling results of the water network to better identify pipes of inadequate pressure or extreme water pressure that would cause potential damage to fixtures connected to these pipelines.
- Incorporate street pavement type when it becomes available. This will provide valuable information on the cost of excavation to work on the pipelines of concern.
- Incorporate information on planned projects from other departments that may involve the excavation of street. This information will provide the opportunity for pipelines to be ranked higher if projects from other departments are planned for the same vicinity.
As described in the GIS Analysis and Data Preprocessing section, the major processing of all the data used in this application is done as a preprocessing step. The preprocessing step may take up to 20 hours of computer processing time if a completely new data set is desired. If all the GIS data can be accessed via a Spatial Database Engine, the time it takes to preprocess certain data can be drastically reduced. This will further enhance the possibility to access more up-to-date information of certain parameters. However, it should be noted that a lot of the parameter information does not change drastically over a short period of time and current implementation of programs to process only targeted parameters that changes rapidly is quite acceptable.
Roy F. Weston, Inc., and TerraStat Consulting Group. (December 1996). Pipe Evaluation System (PIPES) -- Deterioration Model Statistical Analysis. Internal report from consultants to Seattle Public Utilities.
O’Day, Kelly, Richard Weiss, Suzanne Chiavari, and Dennis Blair. (Not Dated). Water Main Evaluation for Rehabilitation/Replacement. Guidance Manual: Distribution Systems. Prepared for American Water Works Association Research Foundation and US EPA Water Engineering Laboratory, Cincinnati, Ohio. (ISBN 0-915295-10-5).
Mays, Larry W., et. al. (1989). Reliability Analysis of Water Distribution Systems. Published by the American Society of Civil Engineers. (ISBN 0-87262-712-8).
The development of PIPES required considerable input from the engineers, planners, crew chiefs, and other staff members of Seattle Public Utilities whose patience with the process and contributions are much appreciated. The support and contributions of Greg McFarland, Tom Nolan (Seattle Public Utilities), and Nick Bodnar (Roy F. Weston, Inc.) are especially appreciated.
Authors:
Ewe Leng Lim
Management System Analyst
Seattle Public Utilities Dexter Horton Building, 9th Floor 710 Second Avenue Seattle, WA 98104 Telephone:(206) 233-5173 Fax: (206) 684-4654 Email: ewe_leng.lim@ci.seattle.wa.us
Ram Pratti
Senior GIS Analyst
Roy F. Weston, Inc. 700 Fifth Avenue, Suite 5700 Seattle, WA 98104 Telephone:(206) 521-7603 Fax: (206) 521-7601 Email: prattir@seapost.rfweston.com