The Tree Designer (TD) interface previews tree parameter definitions immediately in an adjoining tree display window.
Integrating Advanced Visualization Techniques with ArcInfo for Forest Research and Management
David J. Buckley , Dr. Joseph K. Berry
Introduction
The use of 3-D based visualization techniques with GIS has historically been applied for consideration of visual impact assessment in natural resource management. In particular, the aesthetics of forestry harvest cutblock shape, size and location have been of primary importance. However, to date GIS technology has not provided visualization functionality that affords realistic presentation of the 3-D landscape. Considering the visualization software tools available in the scientific community, there has been very little integration of these techniques with commercial GIS software.
This paper reviews the issues involved, and the capabilities achieved, by integrating available scientific visualization techniques with ArcInfo. In particular, this paper focuses on the integration of surface rendering functions and map animation tools with the ArcInfo. These techniques are of interest to foresters in evaluating aesthetic issues related to harvest cutblock design and operating plan approval. Conventional visual exposure analysis and 3-D surface fly-bys, supplemented with realistic tree object rendering, are the primary capabilities utilized. The software development project is referred to as Virtual Forest.
In addition, the presentation will also focus on applying these techniques beyond consideration of traditional visual impact assessments. In particular, the evaluation and interpretation of GIS based model output is an area of research that to date has primarily focused on using functionality and techniques limited to the GIS toolkit. These techniques typically involve 2-D map overlays using standard mathematical and spatial statistics for assessing data variance, correlation, quantifying error and data accuracy. However, scientific research often makes use of sophisticated visualization techniques, often 3-D representations, to enhance the interpretation of the content, logic, and sensitivity of natural resource analytical models. Unfortunately, there are few examples where these techniques have been successfully integrated with de facto industry standard GIS platforms such as ArcInfo. This research investigates the opportunities for integrating these technologies to address issues of model sensitivity analysis and interpretation of model output, as well as traditional visual impact assessment. Several different examples will be presented that combine the visualization of model data, both input and output, using 2-D, 3-D and fully animated map display techniques. In particular, the ability to fully animate temporal model output that includes spatial statistics is especially exciting. This includes consideration of single variable maps as well as bi-variate correlation analysis.
Overview
Virtual Forest (VF) has been developed by integrating sophisticated 3-D visualization programs with ArcInfo spatial data management tools, to provide an interactive platform for generating real-time images of the forested landscape with striking realism. Data is seamlessly transferred from ArcInfo GRID and vector coverages to the rendering software. Through a separate interface VF provides capabilities for the user to define Landscape Views with separate themes that define the exact visualization events. The software has been designed with a View-Theme organization similar to Esri’s ArcView. Theme types include 3-D DTM surface representation, sun illumination, visual exposure, atmospheric effects (sky, fog and haze), polygon rendering and texture mapping, tree plantings (or renderings), and tree removals (or harvests). The ability to define different themes allows the user to represent multiple landscape visualizations, e.g. cutblock design alternatives in forestry. As well, this methodology will also support temporal events that can reflect silvicultural treatment and green-up issues common to forestry.
Software Design
Virtual Forest is structured as two independent interfaces, the Tree Designer and the Landscape Viewer. The Tree Designer interface supports the creation and editing of 3-D tree objects. The Landscape Viewer is the primary interface for rendering 3-D visualizations based on 3-D objects designed with the Tree Designer.
Tree Designer
This interface allows the user to design 3-D trees interactively. The interface uses a series of menu widgets that support the definition of virtually any custom tree object. Individual tree object parameters include :
Trees are previewed immediately in an adjoining display window during modification of the parameters and can be saved as a specific tree code. An unlimited number of different tree codes (tree objects) can be saved. Through the Landscape Viewer interface tree codes can be assigned to specific attribute combinations found in the vegetation inventory data for 3-D rendering on a DTM theme. The variation in tree object parameters affords the definition of seasonal trees, as well as trees at different stages of maturity, e.g. no leaves, stumps, snags, etc. Custom functions in the Landscape Viewer allow users to grow trees if appropriate age maturity classes have been defined for the specific tree codes.
The Tree Designer (TD) is a key component to the 3-D visualization toolkit. In order to enhance the rendering undertaken in the Landscape Viewer, tree objects can be saved as rendered bitmaps with different light source shadings. The bitmaps are then utilized for 3-D rendering, in the Landscape Viewer, using texture mapping techniques. With this design, surfaces can be rendered much quicker that other more common techniques because the 3-D object shading is undertaken at the tree design stage, not at rendering time. This approach provides significant performances boosts over traditional methods of rendering treed surfaces, and results in a truly interactive visualization interface for the user. The Landscape Viewer also supports quick marker rendering and full 3-D object shading as well.
|
|
|
The Tree Designer (TD) interface previews tree parameter definitions immediately in an adjoining tree display window. |
Landscape Viewer
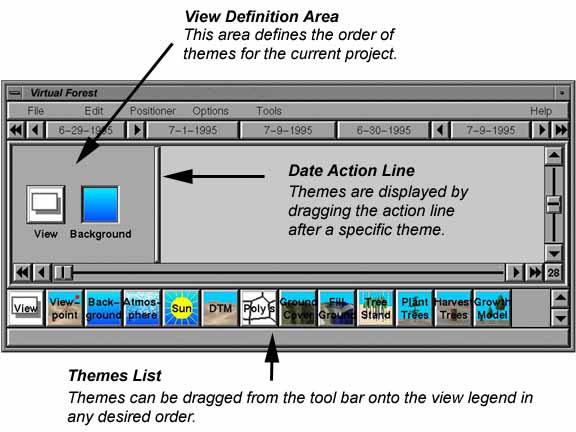
The Landscape Viewer (LV) is the interface for creating visualizations interactively. The current design of the interface focuses around defining temporal themes in a chronological timeline. Events represent explicit visualization actions such as definition of a DTM view, sun and light source conditions, atmospheric (fog and haze) conditions, sky conditions, vector polygon boundaries, DTM surface texturing, tree stand boundaries, tree planting (rendering), and tree harvesting (tree removal). Themes can be dragged into the timeline area in any order to represent a series of chronological actions taking place on the landscape. Specific events are viewed by simply dragging the date action line past the event of interest. Specific parameters are defined for each theme using standard properties menus based on the event type.
|
|
|
The Landscape Viewer (LV) interface supports the definition of Views by dragging themes into the legend. |
Themes (events) are viewed in an adjoining graphics display window. The orientation of the visualization view in the graphics window is controlled by a separate menu interface that allows the user to dynamically rotate and zoom ("fly") the DTM surface interactively. Viewing parameters can also be set to defined viewpoint parameters.
The current LV interface is based on a free form process for defining landscape visualizations. In this manner the user has no specific rules with which to define the order of themes. Simple or complex series of actions on the landscape can be modeled.
Development is currently underway to simplify the interface with a less complex work flow based interface. This is in response to specific operating needs of IGIS forestry clients. Views are bundled into individual Projects analogous to Esri ArcView concepts. This approach has the advantage of being familiar to existing Esri users while yet supporting a temporal definition of complex management actions on the landscape typical to operational forestry.
Visualization Example
The following example represents typical images generated by planting and harvesting trees on a landscape viewed from a key viewpoint. The trees were placed using Tree Designer symbol lookups to an ArcInfo forest inventory. Individual tree symbols are derived using a combination of dominant specie, density, and tree height attributes. Trees were planted and then harvested using specific cutblock polygons. Texture mapping techniques are used to provide additional realism to foreground, harvest areas, and roads. Atmospheric effects, in particular fog and haze, have also been added.
|
|
|
|
||||
|
Slide 1 : Before harvesting |
Slide 2 : Harvest design without consideration of visual aesthetics. |
Slide 3 : Harvest design with some attempt to mitigate visual impact. |
||||
Summary
This paper illustrates the opportunities available to extend landscape analysis by integrating scientific visualization techniques with ArcInfo. The complementary nature of the two technologies results in an operational platform for foresters and natural resource specialists to consider engineering and harvesting design alternatives. The striking realism of the visualizations generated by Virtual Forest will enhance foresters ability to communicate their planned management activities on a landscape. Future development is planned to extend these capabilities to address specific geographic and agency requirements.
David J. Buckley - Principal Consultant, Innovative GIS Solutions
Dr. Joseph K. Berry - President, BA_SIS Inc.
Innovative GIS Solutions Inc.
2000 South College Ave., Suite 300
Fort Collins Colorado
80525
email: