Yan Zhou and Chris Fulcher
A Watershed Management Tool Using SWAT and ArcInfo
While watershed management is gaining wide support, the spatial
information on socioeconomic and physical processes needed for evaluating
alternative watershed management plans is not readily accessible to local decision
makers. With wide adoption of geographic information system (GIS) technology, a
user-friendly and interactive decision support system appears to be an efficient tool
in watershed management. A graphical user interface is developed to incorporate
the Soil and Water Assessment Tool (SWAT) with ArcInfo. The menu interface
provides a tool to identify the relative contribution of sub-watershed areas to
agricultural nonpoint source pollution and evaluate the effects of alternative land
use management practices on surface and ground water quality at the watershed
scale. SWAT is a widely used environmental simulation tool based on continuous
daily time-step process. ArcInfo contains modules for maintaining and analyzing
spatial and tabular data in an effective manner. The interface guides the user
through a series of menus by: 1) leading the user through the steps in generating
model inputs, executing the model and analyzing outputs, 2) allowing for changes
in land use and management practices and re-evaluating potential consequences,
and 3) viewing graphical and tabular results side-by-side for alternative scenarios.
The tool is developed using ArcInfo Arc Macro Language.
Introduction
Effective watershed management requires an understanding of basic
hydrologic and biophysical processes in the watershed. A number of simulation
models have been developed to evaluate water quality parameters affected by
agricultural land management at both field and watershed scale. Widely used field
scale models include CREAMS (Chemicals, Runoff, Erosion from Agricultural
Management Systems), EPIC (Erosion-Productivity Impact Calculator), and GLEAMS
(Groundwater Loading Effects of Agricultural Management System). Watershed
scale models include storm event based AGNPS (Agricultural Non-Point Source
Pollution Model) and continuous daily time step model SWRRB (Simulator for Water
Resources in Rural Basins). Expansion of SWRRB model�s capacities to facilitate
more subbasins and sophisticated routing structure resulted in a new watershed
scale model SWAT (Soil and Water Assessment Tool).
SWAT offers distributed parameter and continuous time simulation, and
flexible watershed configuration. The capacities of SWAT model have yielded
growing applications of the model (Arnold and Allen 1994, Heidenreich et al.
1995). On the other hand, a full scale use of the model demands great amount of
time, expertise and cost for acquiring input data, running the model and analyzing
the results. In recent years, efforts have been made to integrate SWAT model with
raster based GRASS (Geographic Resources Analysis Support System) GIS to
facilitate development of model input and analysis of model output (Srinivasan and
Arnold 1995, Rosenthal et al. 1995).
Objective
The objective of this project is to develop a user-friendly and menu-oriented
graphic user interface (GUI) for streamlining modeling processes involving SWAT
model and ArcInfo GIS. Specifically, the tool is composed of three functional
divisions: (1) generating model inputs, executing the model and analyzing outputs
for baseline land use management, (2) allowing for changes in land use and
management practices and re-evaluating potential water quality consequences, and
(3) viewing graphical and tabular results side-by-side for baseline and alternative
scenarios.
The reasons for using ArcInfo are threefold: (1) it is a widely used GIS
software that contains both raster and vector based modules for effective database
management, (2) menu-oriented integration of SWAT and ArcInfo was not in
place, and (3) ArcInfo is a GIS software being used for SWAT modeling and
other watershed scale studies in-house(Heidenreich et al. 1995, Zhou 1996).
SWAT Model Description
The Soil and Water Assessment Tool (SWAT) is a process-based continuous
daily time-step model which evaluates land management decisions in large
ungauged rural watersheds. It is designed to predict long-term nonpoint source
pollution impacts on water quality such as sediment, nutrient and pesticide loads
(Arnold et al., 1994).
Model inputs include management inputs such as crop rotations, tillage
operations, planting and harvest dates, irrigation, fertilizer use, and pesticide
application rates, as well as the physical characteristics of the watershed and its
subbasins such as precipitation, temperature, soil type, land slope and slope length,
width and slope, Manning�s n values and USLE K factors. Either simulated or
measured precipitation and temperature values may be used in SWAT. Measured
streamflow and sediment concentrations can be statistically compared with model
predictions.
Model processes include calculations of water balance (i.e. surface runoff,
return flow, percolation, evapotranspiration, and transmission losses), crop growth,
nutrient cycling, and pesticide movement. Model outputs include subbasin and
watershed values for surface flow, ground water and lateral flow, crop yields, and
sediment, nutrient and pesticide yields.
The SWAT-ArcInfo Integration
Figure 1 depicts the composition and diagram of three functional divisions in
the SWAT-ArcInfo tool. Each division consists of a series of graphic menu
interfaces to accomplish the tasks. Major steps are described below and illustrated
through an example application of Goodwater Creek watershed located in north
central Missouri.
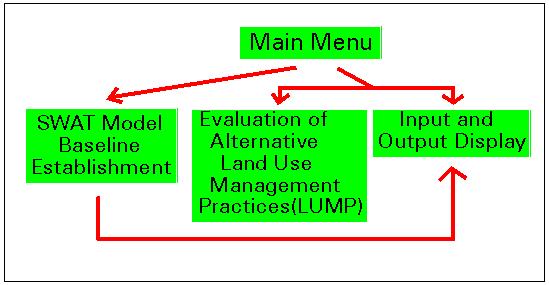
Figure 1. Composition and diagram of three functional divisions
1. Model Baseline Establishment
Four basic types of watershed data are required to extract spatial input for
SWAT model. These data are hydrologic features, soil distribution, land use
information, and contour lines depicting topography.
Major procedures in this division include: (1) develop subbasin database, (2)
develop stream database, (3) calculate landuse and soil variations within subbasins,
(4) enter physical variable parameters such as land use management, (5) compile
model readable input files, and (6) run model and compile outputs.
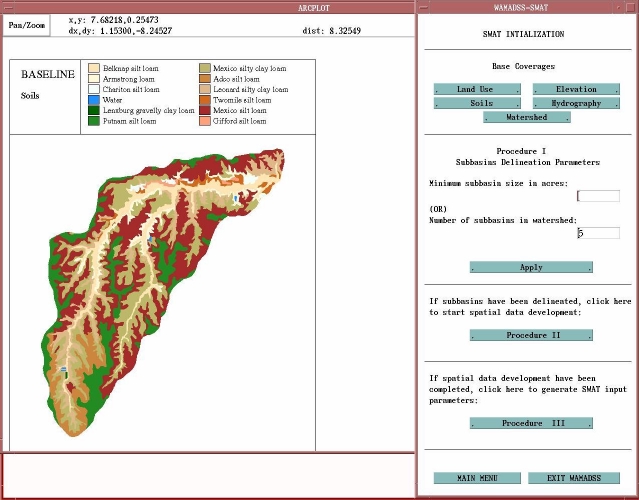
(1) Develop subbasin database
Figure 2 shows the menu for subbasin database development. The menu
contains functions for displaying basic GIS layers, two options for subbasin
delineation, and buttons for proceeding directly to next steps. Delineation of
subbasins is performed using ArcInfo GRID module. It generates a hydrologically
correct digital elevation model (DEM) from contour line coverage, and determines
subbasin outlets and drainage contributing areas to the outlets. The resulting
natural subbasins are then grouped into certain number of subbasins based on the
criteria specified by the user. In this instance, 5 subbasins are created.
(click on the image to view full version)
Figure 2. Subbasin delineation
Subbasins may be manually edited by the user to better reflect landuse, soil,
hydrology, or hypsography in the watershed. Figure 3 shows the menu for editing
boundaries and identification numbers of subbasins. Completion of this step
proceeds the user to interactively identify outlet subbasin one-by-one. Manual
identification of the outlet subbasins ensures correct routing pattern, specially for
subbasins that contain no stream segments or are not hydrologically defined. Land
slopes of subbasins are automatically calculated by averaging percent-rise slope
values of the grid cells within each subbasin.

(click on the image to view full version)
Figure 3. Subbasin editing
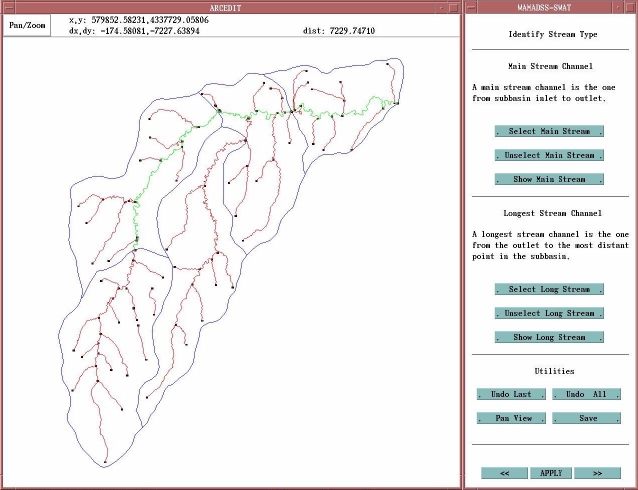
(2) Develop stream database
Stream data parameters are required for two types of channels in the model:
the main stream channel flowing from each subbasin inlet to the subbasin outlet,
and the longest stream channel extending from each subbasin outlet to the most
distant point in the subbasin. Functionality for the channel-type identification is
shown in Figure 4.
(click on the image to view full version)
Figure 4. Stream channel identification
Once the two types of stream channels are identified, lengths and slopes of
the channel segments are calculated automatically for subbasins. The slope of a
channel segment is calculated by dividing the channel length with the elevation
difference between the "starting" and "ending" nodes. Elevation of two end-nodes
of a stream segment is determined with TIN (triangulated irregular network)
module.
(3) Calculate Landuse and Soil Variations within Subbasins
A natural subbasin is usually composed of several land uses (or crops) and
soil types. In SWAT modeling, a subbasin is required of representing a unique
landuse (or crop rotation) and soil type. A straight forward approach is to use
predominant landuse (or crop rotation) and soil. SWAT model also allows for non-
spatial subdivision of subbasins into smaller sub-units based on landuse and soil
variations, a concept of virtual subbasins. Virtual subbasins represent percentages
of the larger subbasin area.
Methods of using either predominant or all land uses and soils are facilitated
through the SWAT-ArcInfo tool (Figure 5). Combination of all land uses and soils
can result in enormous number of virtual subbasins for a watershed. To reduce un-
necessary computation, the user is provided options to select certain land uses for
breaking down by soils and/or specify a minimum percentage to exclude minor land
uses in subbasins.

(click on the image to view full version)
Figure 5. Calculating land use and soils variation
In this example application, all land uses occupying 10% or more of
subbasins are accounted for. Areas of the minor land uses (<10% of a subbasin)
are re-allocated to major land uses to reflect 100% subbasin areas. Predominant
soil type of a big subbasin is used for all virtual subbasins within the subbasin.
Thus, a total of 15 virtual subbasins are generated for the watershed in this
example.
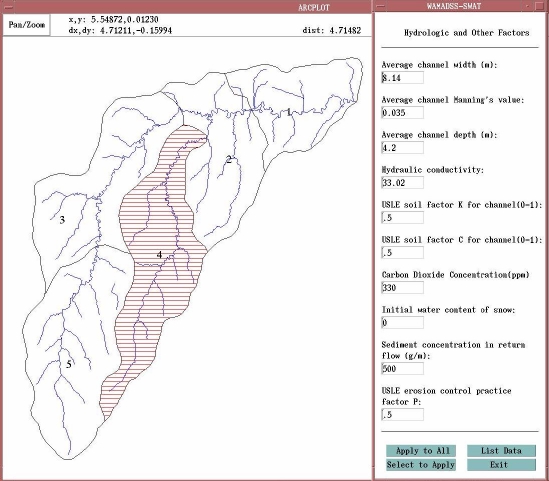
(4) Enter Physical Variable Parameters
The user needs to collect and enter several physical variables such as soil
group number, curve number, hydrologic variables, and pesticide selection. A
series of graphic input menus guide the user to go through the process of
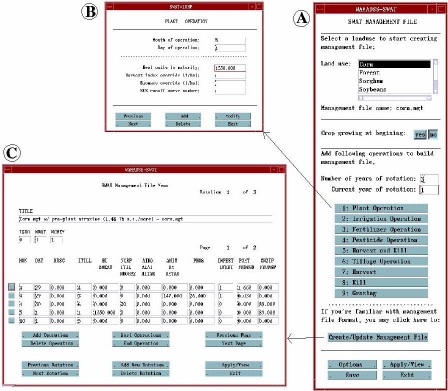
parameter entry painlessly. Figure 6 shows the menu for entering hydrologic
parameters. Hydrologic parameters may vary from subbasin to subbasin.
(click on the image to view full version)
Figure 6. Entering hydrologic parameters
Management input files include data for management practices such as
planting, harvest, tillage operations, and pesticide and fertilizer application. Inputs
include dates, operation type ode and application amounts. These input parameters
are compiled through management input menu (see A in Figure 6). A management
file can have any number of year of crop rotation. For each management file, data
can be entered through 9 individual operation practices including planting, irrigation,
fertilizer, pesticide, , harvest and kill, tillage, harvest only, kill only, and grazing
respectively (see B in Figure 6). An spreadsheet input menu (see C in Figure 6) is
also facilitated in the actual management file format. It is intended for SWAT-
experienced users to enter all data quickly.
(click on the image to view full version)
Figure 7. Management input file development
Upon the completion of physical parameter input, the SWAT-ArcInfo tool
compiles the databases into SWAT readable input files and executes the model. A
5 year simulation is run for this example application.
SWAT simulates on a wide range of water quality parameters. This tool
compiles the following parameters for watershed and subbasin level output:
- average annual crop yields in bushels
- average monthly pesticide concentration in runoff in PPB (parts per billion)
- average annual nutrient concentration in surface and ground water including
nitrate and phosphorus in PPM (parts per million)
- average annual and monthly sedimentation in tons/acre
2. Evaluation of Alternative Land Use and Management Practices (LUMP)
Three alternative scenarios can be evaluated in addition to baseline land use
management impact on water qualities. Each new scenario is based on an existing
setting such as baseline or a previously created scenario. LUMP evaluation consists
of assessing consequences of changes in landuse activities and/or management
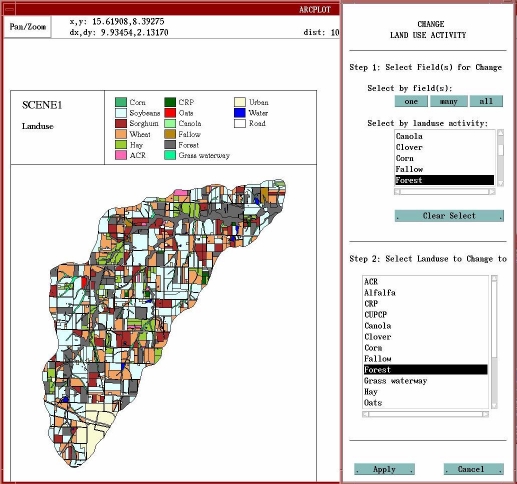
practices such as fertilizer, pesticide, and tillage operations. Figure 8 shows the
menu for landuse activity change in the watershed. The user can change land uses
for certain crop fields, or switch crops from one to another across watershed. In
this example, all corn fields are changed to forest to generate Scenario #1.
(click on the image to view full version)
Figure 8. Landuse activity change
Alteration of management practices are facilitated through the management
input file menu (Figure 6). When an exiting management file is selected, the menu input
fields are populated with base scenario data. The user can edit
and add data as desired.
3. Input and Output Display
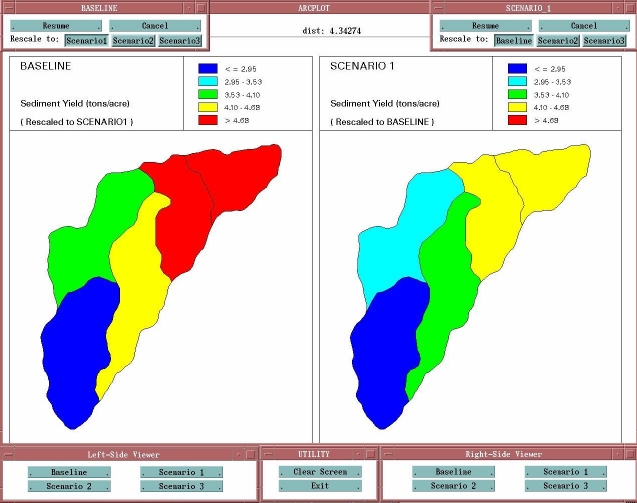
The SWAT-ArcInfo tool facilitates side-by-side display of two scenarios in
both graphic and tabular format. Spatial input data accessible through the tool
include: landuse, soils, hydrography, DEM, average pesticide application for each
month, tillage operation, nitrate and phosphorous applications. SWAT input files
are displayed in text format. All output components compiled by the tool are
presented in graphic format at subbasin level and tabular format at watershed level.
Figure 9 shows subbasin level sedimentation in for baseline and scenario #1.
(click on the image to view full version)
Figure 9. Output display of sedimentation for baseline and scenario #1
Conclusions and Discussions
The SWAT-ArcInfo tool seamlessly links the SWAT model with ArcInfo
through a series of user-friendly graphic menus. The tool streamlines the whole
process of model input development and output analysis, and thereby greatly
speeds up a complex modeling process. In the meantime, the tool offers various
flexible options for user-defined applications. This tool has been used for several
SWAT related watershed analyses in-house.
Like any other software, the SWAT-ArcInfo tool has its limitations. The
tool does not check meaningfulness of the values entered by the user. The user is
responsible to ensure that any physical parameters entered are correct and
meaningful.
Both SWAT and ArcInfo are very complex products, and demand highly
professional knowledge to ensure reliable output. While such sophisticated system
is needed for certain watershed studies, a watershed management tool using
simpler models and PC-based GIS software such as ArcView is in greater demand.
Acknowledgments
We thank Dr. Srinivasan and Dr. Arnold at the Blackland Research Center,
Temple, TX for their technical support on SWAT model. For financial support we
are grateful to the Soil and Water Conservation District, Missouri Department of
Conservation.
References
Arnold, J.G., J.R. Williams, R. Srinivasan, K.W. King, and R.H. Griggs, 1994.
SWAT - Soil and Water Assessment Tool, USDA, Agricultural Research
Service, Grassland, Soil and Water Research Laboratory, 808 East Blackland
Road, Temple, TX 76502, revised 10/25/94.
Arnold, J.G. and P.M. Allen, 1996. Estimating hydrologic budgets for three Illinois
watersheds, Journal of Hydrology, 176:57-77.
Heidenreich, Lynn K., Yan Zhou, and Tony Prato, 1995. Economic and
Environmental Assessment of Alternative Farming Systems at the Watershed
Scale, CARES Research Report No. 19.
Rosenthal, W.D., R. Srinivasan, and J.G. Arnold, 1995. Alternative river
management using a linked GIS-hydrology model, Transactions of American
Society of Agricultural Engineers, 38(3): 783-790.
Srinivasan, R. and J.G. Arnold, 1995. Integration of a basin-scale water quality
model with GIS, Water Resources Bulletin, 30(3): 453-462.
Zhou, Yan, 1996. Documentation for: Economic and Environmental Assessment of
Alternative Farming Systems at the Watershed Scale, Vol. I - GIS Aided Input
Development and Output Compilation, CARES Research Report No. 20.
Yan Zhou
Research Associate
Center for Agricultural, Resource and Environmental Systems (CARES)
University of Missouri - Columbia
200 Mumford Hall
Columbia, MO 65211
Tel: (573) 882 - 8541
Fax: (573) 882 - 3958
E-mail: zhou@cares.missouri.edu
URL: http://www.missouri.edu/~careswww
Chris Fulcher
Associate Director and Research Associate
Center for Agricultural, Resource and Environmental Systems (CARES)
University of Missouri - Columbia
200 Mumford Hall
Columbia, MO 65211
Tel: (573) 882 - 6534
Fax: (573) 882 - 3958
E-mail: fulcher@cares.missouri.edu
URL: http://www.missouri.edu/~careswww