Sachio Kubo, Wanglin Yan, Takashi Tomomatsu
The Integration of GPS, GIS , Remote Sensing and CAD for Safeguarding Angkor Wat
Abstract
In the investigation and the restoration of ruins, the new technology is largely expected. The GIS laboratory of Keio University has acted as a member of Japanese Angkor Safeguarding Team (JSA) to support the preservation and the restoration of Angkor Wat ruins in 1995. With the integration of the new information technologies such as GIS, GPS, RS and CAD/CG, we measured the coordinates of control points and the positions of ruins with RDGPS (real time differential GPS) in about 1m accuracy. These GPS points are used for registrating satellite images and locating buildings or the installation places of video cameras. Two digital video cameras are used to measure the shape of the ruins in stereo. The measured data of the buildings, including plane map data etc. is managed as three dimensional vector data by GIS. Finally, CAD/CG and recent VRML technology are used for the restoration simulation of ruins. This paper reports the construction methods and the experimental results of the system applied in Angkor ruins.
1. Introduction
The geographic information processing technology is entering a new generation. The traditional geographic information processing system centered its priority on the management of existing data (made to the data base) and the analysis, mainly using geographic information system (GIS). The characteristics of new generation of technology, on the other hand, is to combine two or more elements of technologies corresponding to various purposes. Such new technologies includes remote sensing and GPS for data acquisition, object-oriented data model for multimedia database, models for environmental simulations, etc.
In the investigation and the restoration of ruins, the new generation technology is largely expected. Recently, maintenance and the restoration of the Temple of Angkor ruins located in the northwest part of Cambodian have been advanced as part of the world inheritance relief plan of UNESCO. The Angkor ruins, in the chiefly, are groups of stone ruins constructed from 9 to the 14th century by the Angkor Kingdom, where extending over the square kilometers of 310 is lined with ruins of 1000 or more. Many of them are heavily damaged and are beginning to ruin because it was left for hundreds of years in the jungle.
The GIS laboratory of Keio University has acted as a member of Japanese Angkor Safeguarding Team (JSA) to support the preservation and the restoration of Angkor Wat ruins in 1995.
This team has developed and investigated the new information technologies such as GIS, GPS, RS and CAD/CG, in order to research the distribution of ruins, to measure the shape of buildings, and to simulate the restoration of ruins visually.
Although many of these new geographic information processing pile up the improvement, the effectiveness of the system could be proved through the past two missions to Angkor Wat during September and November, 1996.
This paper here indicates the methods of the construction of such an integrated systems and the applied results to the restoration of Angkor Wat ruins.
2. Concepts for the development of the system
The Angkor ruins can be said to be considerably difficult objects from the viewpoint of the measurement. This reason is that the ruin which contains the buildings of 700 or more are widely located over 30 km all sides (vast region), neither a map nor a control point exists accurately that can be used as a standard point(lack of spatial data), and it is difficult to measure the ruins from the ground or from the air because they are covered by jungle(characteristics of the tropical woods), etc.
At the building level, there are the following problems:
1.the scale of individual building are large and it's construction is complicated,
2.the demanded accuracy is not clear, partly because the decoration of the buildings makes the definition of accuracy difficult.
When developing the system, the following policies were set up.
(1) aims to acquire the data over the large area, in 2-demention by 1m accuracy. This is corresponds to the accuracy of maps in 1/3000.
(2) design data acquisition systems from the beginning because there is no enough maps or surveying data existing.
(3) try to observe buildings in 5cm accuracy. This corresponds to the drawings of buildings in 1/150. Moreover, it is requested to collect data about the shape of buildings in the same accuracy for three dimension simulation.
(4) It is preferable to have the system with high portability and few troubles of breakdown.
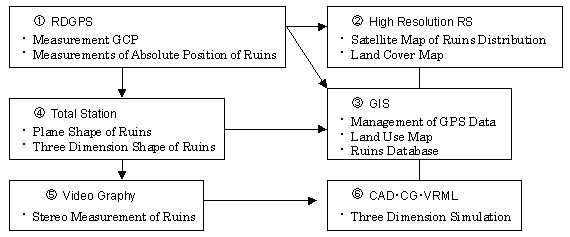
Based on this concept, an integrated system of GPS, GIS, RS, 3-D surveying and CAD/CG are designed. The outline of the system is shown in Fig.1.
Fig.1 Modules of the system
By this system, we measured the coordinates of control points and the position of ruins in high accuracy with RDGPS (real time differential GPS) concerning the large area data. Using RDGPS, the position can be absolutely acquired in an accuracy of about 1-2m. These GPS points are used for a precise correction of satellite images.
As to building level data, the required accuracy is about 1/200 scales for the ruins restorations. A highly accurate, high-speed instrumentation system is necessary for that. It is assumed to adopt RKGPS (real time kinematic GPS) for the measurement of control points.
The structures of buildings is measured by stereo videography. An absolute positions of the installation place of video camera are obtained by GPS with INS (inertia navigation system) for posture. A Total Station surveying instrument is introduced in order to collect three dimensions GCP of ruins. The measured data about the shape of buildings is managed as three dimensional vector data by GIS including plane map data etc.. Finally, CAD/CG and recent VRML technology are used and the restoration simulation of ruins is done. This paper reports the construction method and the experimental results of the above modules in Angkor ruins.
3. Positioning by RDGPS
GPS is a system which calculates an absolute position on the earth using satellites, differing from the past method of surveying. It can be said that this is an effective technology to the measurement in a region where control points does not exist or the accuracy of them is not enough, such as in Cambodia. However, because it is developed by a military purpose, the limitation is installed on private use. It is difficult to have accurate positions just using simple GPS(C/A code). Usually the accuracy of simple GPS (SGPS) is about 100m. Here we try to use RDGPS (Real time Differential GPS) to survey the coordinates of points in high accuracy.
3.1 Basic principle of RDGPS
DGPS(Differential GPS) uses two or more GPS receivers. With a base station whose accurate position has already been known, we can compare the known position with the new GPS measurement. The difference means the error in the new observed data. This error information is then transmitted to a remote GPS receiver as calibration (RTCM) to the observed position there. The remote receiver receives this, corrects the directly observed position, and improve accuracy. This technology is called differential GPS (DGPS).

Figure 2. Basic component of DGPS.
RDGPS means that the transmission of correction information and the calibration of the position in the remote receiver is done in real time.
It is necessary to transmit and receive the correction data every minute in RDGPS through communication such as the radio to do the correction processing. Because the transmission of correction information is one-way traffic, and signaling speed should be enough in about 1200bps. At this extent, we can select a lot of communication modes such as portable telephone, beacon wave, FM multiple broadcasting, and internet, etc. As a result of experiment and examination, the radio was adopted to transmit correction information in this project.
3.2 Construction and operation of RDGPS system
The system of RDGPS is basically composed of a base station and remote receivers as shown in Figure 2. However, relay receivers was set up in our system which is located in Phnom Baken, one of the temples in Angkor ruins with elevation of 95m. The Base station is located in Siem Reap city, and the remote receiver are mobile surveying points in Angkor ruins during the investigation at this time. Because tropical rain woods, which can be trouble of transmitting and receiving electric wave, extends between these two points, the relay receiver receives corrected information from the base station, amplifies information, and transmits to the remote receiver again.
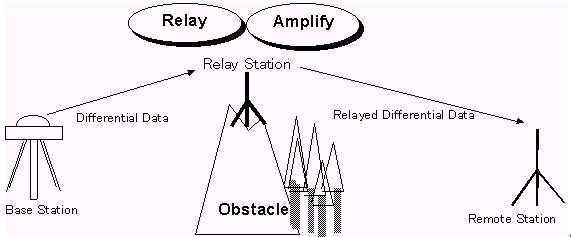
Figure 3 RDGPS system with a relay station
The GPS unit at the base station calculates the error included in the GPS code by comparing the already known position. Calculated error information is transmitted from the GPS control terminal to the transmission modem with the code of the industry standard which is called correction signal (RTCM104), amplified with preamplifier and the linear amplifier, and sent to the relay station and the remote receivers.
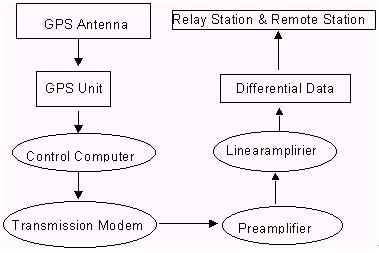
Figure 4 Composition of the base station system
In this project, the GPS antenna at the basic station was set up on the rooftop of JSA office in Siem Reap city. The position of the base station was measured with non-differential mode of positioning for an hour and then an average was taken.
Correction information from the base station is sent off in the wave length of 429MHZ and the output is about 10W. Considering of the electric power circumstances in Cambodia, the electric wave was transmitted by the output electric power within the capability of GPS itself when blacked out.
At the relay station, correction information transmitted from the base station is received with the receive antenna in remote receivers and the noise is removed with the filter. After amplifying it with the preamplifier, forwarding to the receive modem, amplifying again with the preamplifier and the linear amplifier, and it is transmitted from the antenna to the remote receiver.
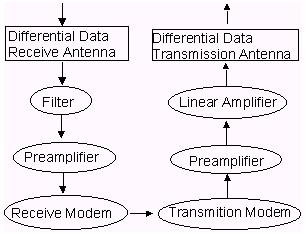
Figure 5 The relay station
At a remote receiver, the position is measured with correction information from the relay station and the base station. After the noise is removed with the filter, correction information is sent from preamplifier to the receive modem and then to the GPS unit. The GPS unit records correction information and the position of general GPS is corrected. The position information is recorded in the GPS control terminal.
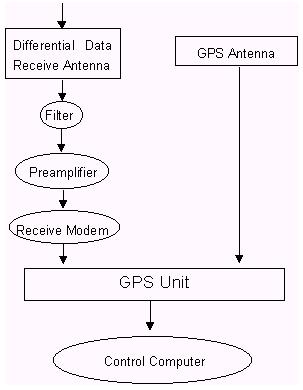
Figure 6 The remote receiver system
Supplementing with four satellites or more is a condition to measure GPS, and six satellites is necessary to be caught for positioning with high accuracy. The pole for rising the antenna is used when the measured point becomes the shadow of trees or ruins where the satellite is difficult to be caught.
The software used for catching GPS and calculating the position is Novatel Winsat. All processes are controlled with this software including calculation of differential correction information and position with the correction.
3.3 Examination of accuracy
As we mentioned before, an accuracy of 1m is necessary for the measurement of ruins as a control points for mapping with high resolution satellite images. The positioning accuracy has been improved by the following two methods in this research.
(1)Accuracy improvement by average
An original program was coded to calculate the average value. This program reads the log of the GPGGA format of NMEA(National Marine Electronics Association) to calculate the average position. When the average value is obtained, we removed the value which comes off twice or more of the standard deviation of latitude, the longitude, and the elevation respectively. It is considered that this method is efficient when a supplementation numbers of satellites is few, or extremely big errors are sometimes contained. In September and November, 1996, totally 113 GCPs (Ground Control Point) were observed (53 points in September and 60 points in November) and 106 points of them were with 1-2m errors.
(2)Accuracy improvement by real-time differential GPS(RDGPS)
Even if the number of satellites which can be caught is four or more, it has been understood that the accuracy of positioning using RDGPS changes largely depending on the number.
A case there are a lot of numbers of satellite caught
Figure 7 is a graph showing the error of the positioning result in front of Siem Reap Airport. On the average, supplements with 8.9 satellites are caught at this time. The maximum error in each direction of X, Y, and Z, the longitude is 6.08m, latitude is 5.26m, and the height is 8.6m respectively. In the standard deviation, longitude is 0.0000118üŗ(1.27m), latitude 0.0000089üŗ(0.99m). Therefore the accuracy of positioning in case are very high.
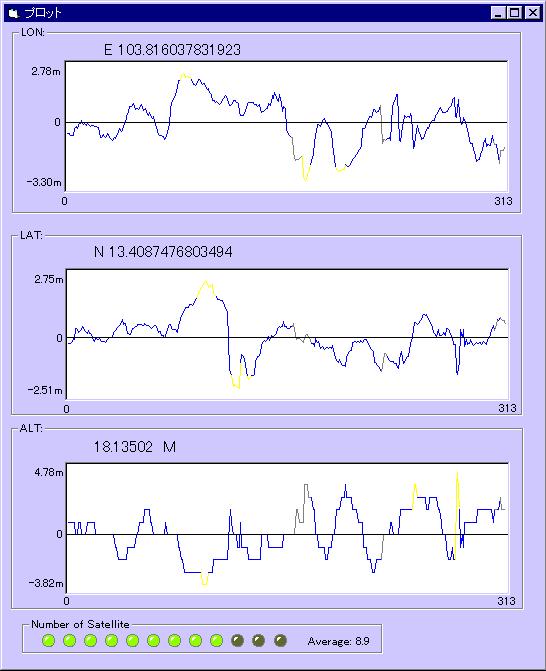
Figure 7 The result of error measured in front of Siem Reap Airport
A case When the number of satellite caught is few
Figure8 shows the point measured in the Northern Gate of Angkor Thom. This place was covered by trees and the sky and was hardly to be seen. The number of satellite supplementation averages at this position was one of the worst place(We caught average number of 4.2 satellites). Therefore, a very big error occurred in maximum; the longitude 134.39m, latitude 19.95m, the height 580.8m. Different from general GPS, which constantly had 10m of error ,RGPS only has extremely big error sometimes. We used the antenna attached to the pole of about 10m. As a result, difficulty in catching the satellite has decreased. When the antenna is raised to 7.5m at the same place, the average of catching the satellite is 5.6, the error lessen to that of longitude 12.86m, latitude 15.52, height 105.62m.
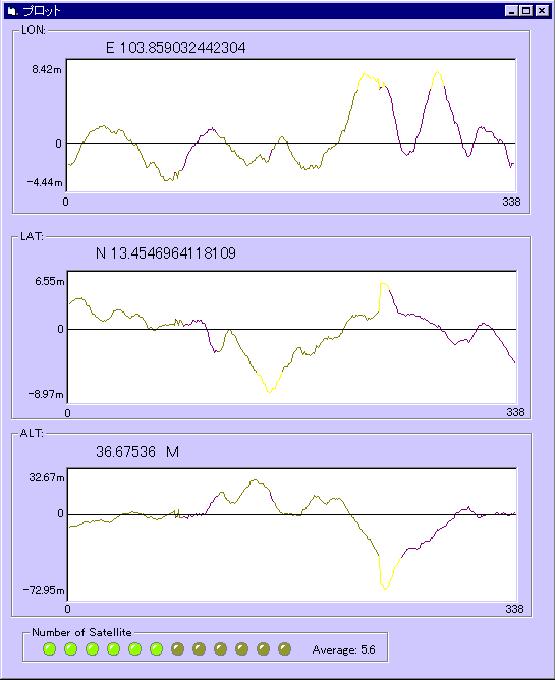
Figure 8 The result of accuracy positioned at the north gate of Angkor Thom
4. Integration with GISźRS of GPS measurement
Up to now, not enough investigation and nor the management of information on the whole of Angkor Wat ruins have been performed. It is necessary to make a unified database in order to share the data on safeguarding among different teams. Collecting the GPS data, the map information data of region with ruins, geographic information from satellite image and etc, a prototype of geographic information system (GIS) of the Angkor ruins was made. All GIS data were stored in ArcInfo format (coverage).
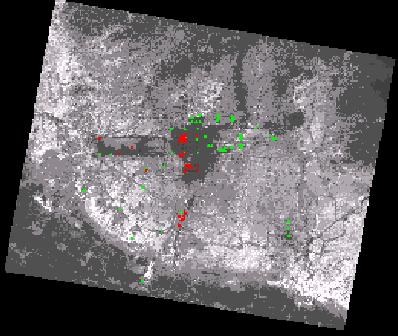
Figure 9 Integration of RS and the GPS data
4.1 data processing
First of all, a panchromatic image of SPOT satellite was registrated with the measured GPS points. The acquired GPS point was dropped on the image (Figure 9).
Next, GIS and the data concerned to ruins were integrated by using the plans and the photographs of ruins. For the plan, we used the one from the JSA report of 1994 concerning Bayon and Prasat Suor Prat and also the plan printed in ügA GUIDE TO ANGKORüh . As for the photograph images we used the ones that we actually took during the investigation there.
To make map coverage we digitized the road, the waterway, and the reservoir which had been read from the map of 1/10,000 and 1/50,000 (obtained in Phnon Phemn) (Figure 10(a), (b)). These map data was also registrated with GCP coordinates.
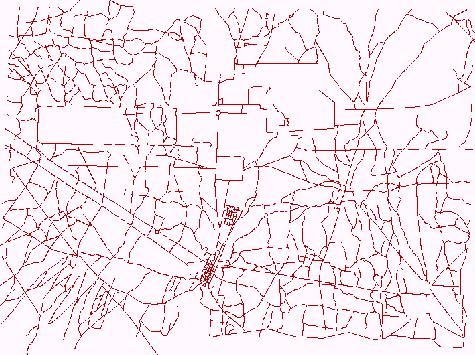
(a) Road (1/10000)
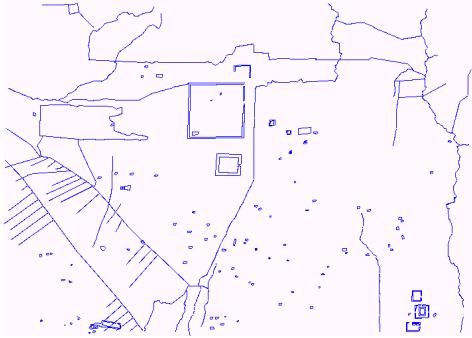
(b) Use of water system (1/10000)
Figure 10 Digital data from old maps
In addition, the latest land use, the road, and the water system data were acquired from IRIC(Integrated Resources Information Center) of Cambodia, supported by UNESCO.
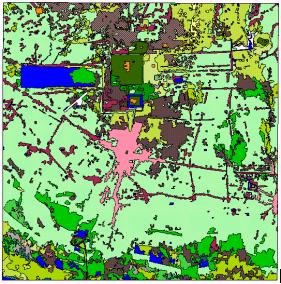
(a) Land use
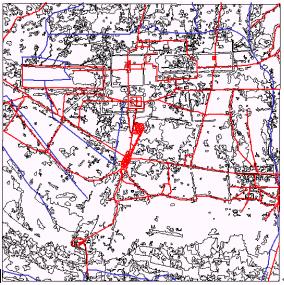
(b) road and water system network
Figure 11 The data of IRIC
After the comparison of the accuracy about the above coverages, the coverage of the land use and the roads from IRIC was finally used while the water system was the 1/10000 map that we digitized.
4.2 Integration of data
The above data sets were integrated on Arc View (Figure 12). The display and non-display of a data set can be easily switched by a click of the mouse. Moreover, because two or more theme were registered in the same Arc View project, many GIS data can be displayed at the same time.
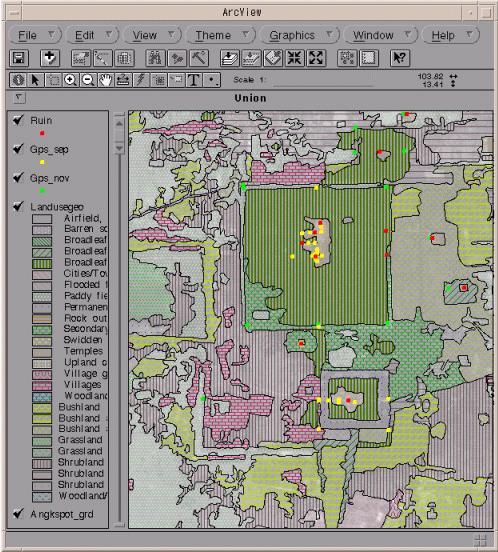
Figure 12 Integrated database of Angkor Ruins
The image data sets is attached to the GPS points of ruins as attributes. As the result, the image of the ruins could be displayed by clicking the GPS point overlayed on other GIS data or the satellite image. Concretely, the function of Hot Link in Arc View is used.
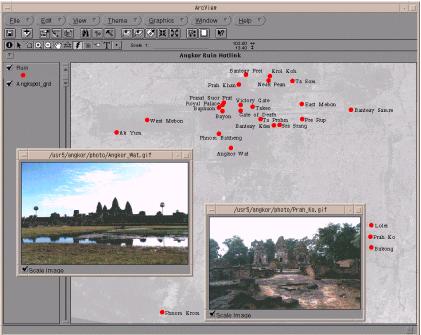
Figure 13 Integration of GIS and GPS and image
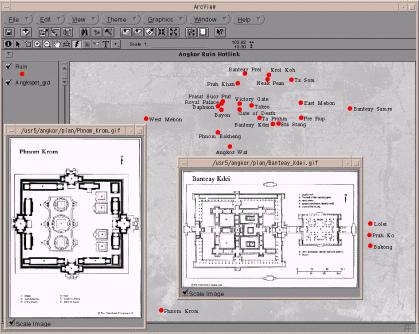
Figure 14 Link of photographs and layout charts of the ruins by hot link
5. Three dimensions measurement of the ruins by videography.
It is impossible to measure the detail of the building though an absolute position of ruins can be measured in GPS. To make three dimensional CG of ruins, we must make three dimensional modeling and rendering based on the shape data of constructions. Usually, to make complicated three dimensional CG, quite a lot of coordinate values are needed. It is impossible to measure each point of each buildings in detail on the site. Therefore, we developed videography technology by stereo video pictures.
5.1 Integration of system
The stereo measurement with video pictures is fundamentally the same as the photogrammetry. That is, we take two pictures with two parallel cameras and the distance between two points is obtained by the paradox. Here two digital video camera (SONY DCR VX-1000 is used. And in order to be carried by one person in field, the system must be light. The total composition of the system we installed is shown in Figure 14.
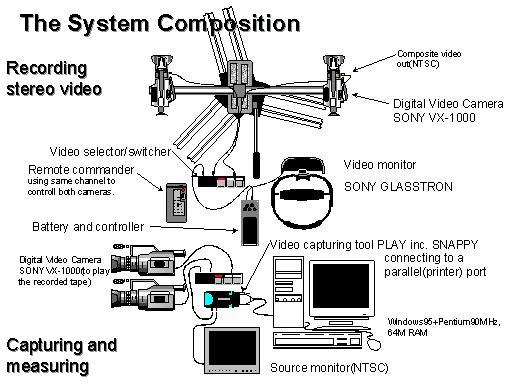
Fig 15 The System configuration of videography
Because the image is used to measure an accurate position of objects in three dimension, a very high resolution is required. Time codes are automatically recorded in a digital video (DV) tape so that is possible to handle the recoreded images by frame. This is also a greate advantage for a 3D measurement using DV. And we can control two cameras by one remote control because same cameras are used. This method was specially effective on the site. The visor type liquid crystal monitor named SONY GLASSTRON was adopted to decide the direction of two cameras.
Concerning the installation of a video camera, it is preferable to take the interval of two cameras, the base line length as long as possible. However, for the convenience of carrying, the system small and the base line should not be too long. Two cameras were installed at both ends of the aluminum pipe on the tripod. The length of the pipe here is 1.5m.
It is good to put the measured object on one scene as much as possible when thinking about the process of obtaining three dimensional coordinate, especially, when the length between two vertex is measured, these must be on one screen. But in fact, the 3 or 4 of imagesare usually needed for big ruins.
It is general to use a video capture board etc. as a device to input video pictures into a computer. In this system high quality and high resolution is needed as a static picture more than images for animation. So we adopt not usual video capture board but a capture adapt called SNAPPY. With SNAPPY, a video image can be taken with 1500ü~1125 pixel resolution. The picture input is NTSC composite.
5.2 Stereo measurement
The pictures are inputted into a computer by the procedure shown in the following and the stereo measurement is done. It is necessary to specify each vertex that wants to be measured in a pair of image in the algorithm for obtaining three dimensional coordinate by the stereo method.
Procedure of three dimensional measurement with video pictures:
1) connect SNAPPY to a parallel port of the PC.
2) connect two VX-1000 camera to the video selector.
3) connect the selector and SNAPPY, SNAPPY and a monitor with cables.
4) start the measurement application software 3DV.
5) retrieve two images in both camera with the same time code.
6) Stop a left picture and push the CAPTURE button of 3DV.
7) Capture a right picture in similar.
8) Point the corresponding point in the right and left picture by mouse.
9) The measurement result is displayed by pushing the distance measurement button. ü@
The stereo measurement application originally developed is semi-automated. When the measurement point is specified once by one of images, the other is searched out.
5.3 Experiment and verification of result
The ruins chosen in Angkor Wat for the spot experiment on three dimensional measurement are Bakong because the structure of it is relatively simple.
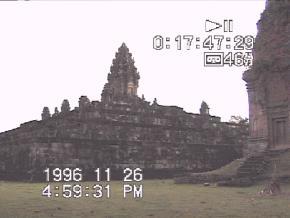
Figure 16 Video image for the measurement of Bakong
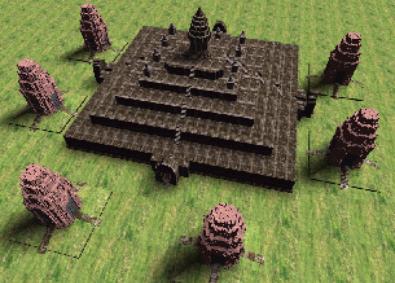
Figure 17 Three dimensional CG of Bakong
Figure 16 is one scene of a video image for the measurement taken in Bakong. The stereo measurement are based on this kind of images. As you can see, the brightness and contract of images are quite different. Usually, latitude of the video is narrower than that of the photograph. and brightness and darkness could be easily over exceeded in a video image. Therefore, not only the performance of a video recorder but also that of the capture strongly influences this. Three dimensional measurement was executed, so the CG picture of Figure 17 was able to be manufactured concerning Bakong ruins. Modeler and renderer are formZ v2.7 Render Zone on Apple Power Macintosh8500. Texture mapping technique was used here to make the CG more reality, rather than the detail of the shape of each stone.
6. Conclusion
We were able to obtain a lot of results by bringing GPS, GIS, RS and CAD/CG together through the activities for safeguarding of Angkor Wat. First of all, the positions of control point and ruins was able to be measured using RDGPS with 1 or 2 meter error. These measurements were used to registrate SPOT satellite images with 10meter resolution and a satellite image map with the distribution of ruins have been made. Moreover, the GPS were applied to old maps so that a integrated database with maps, images, photos and plans of ruins become possible. In addition, three dimension of ruins restoration was made based on a digital video reflection. With this system 3 dimensional CG could be made in low-cost. These results could greatly contribute to the preservation and the restoration activities of Angkor Wat ruins.
In the future, the accuracy of RDGPS should be likely to be up to centimeter level in order to measure the sructure of buildings in more detail and to match the forthcoming high resolution satellite images.
Acknowledge
This project is supported by a grant from Keio University. JSA fully arranged the two missions to The Temple of Angkor in Sep. 9 and Nov. of 1996. Many students at GIS Lab. of Keio Unibersity attended the project for data collection in the site, data processing in the lab, result analysis and draft making of this paper.
References
Dawn F Rooney, 1994, ANGKOR -An Introduction to The Temples-,ASIA BOOKS.
Takashi Tomomatsu and Isao Tsukagoshi, 1996, ügDevelopment of solid photograph measurement system for spectacle design supportüh, Proceedings of Symposium on Information System, Architectural Academy of Japan(Japanese)
Author Information
Sachio Kubo
Professor, Faculty of Environmental Information, Keio University
5322 Endo, Fujisawa City, Kanagawa 252, Japan
Tel: 81-466-47-5111
fax: 81-466-47-5041
E-mail: skubo@sfc.keio.ac.jp
Wanglin Yan
Associate professor, Faculty of Environmental and Information Studies, Musashi Institute of Technology
3-3-1 Ushikubonishi, Tsuduki Ward, Yokohama City, Kanagawa 224, Japan
tel: 81-45-910-2590
fax: 81-45-910-2591
e-mail: yan@yc.musashi-tech.ac.jp
Takashi Tomomatsu
Graduate student, Graduate School of Media and Governance, Keio University
5322 endo, Fujisawa City, Kanagawa 252, Japan
E-mail: tmastu@sfc.keio.ac.jp
ü@