| Benefit | Explanation |
| Pleasure | Urban residents enjoy retreating form the anonymous and hectic city lifestyle. Individual benefits, such as viewing plants and animals, are largely unquantifiable yet personally very valuable. |
| Well-being | Psychological and emotional well-being are improved by contact with nature. Natural areas allow people to relax and reduce the feeling of being trapped in a city. |
| Recreation | Recreational activities tend to be enjoyed more when in a natural setting. |
| Social | Parks and natural areas can be meeting places. |
| Education | Wildlife areas serve as field laboratories for biologists, geographers, and environmental scientists. Children particularly benefit from learning about nature while experiencing it. |
| Historical Value | Natural areas can have historical value when they represent links to the past, such as old abandoned railways, canals, and relict woodlands. |
| Image | An urban area with an emphasis on parks and natural areas can attract employers and investors. |
| Environmental Health | Wildlife habitat and natural areas in an urban environment can mitigate flood hazards, reduce erosion, filter pollutants, reduce noise, and mask obtrusive views. |
| Economic Value | The economic value of an area can increase if the public perception of it is held in high regard. When the social, recreational and other benefits are accounted for, the economic value of an area increases. |
| Scientific Value | Natural areas can support rare species by serving as the last refuges for formerly prolific plants and animals. Plants and animals living in urban areas can act as indicators of water, air, and soil pollution. |
| Adapted from the Nature Conservancy Council (1987) | |
At one time parks and recreation areas were viewed as distinctly
different (Rutledge 1971) and were managed by separate governmental
departments. Parks were seen as natural areas that served as passive
retreats and recreation areas were focused on athletics and active
facilities (Rutledge 1971). Likewise, parks deficiency assessment
can be approached from an ecological perspective, recreational
perspective, or a combination of both.
Defining Parks and Parks Deficiency
How a park is defined may depend upon the perspective of the person
defining it. A park can be defined by its relationship to humans
or by its relationship to nature. Monty I. Christiansen views
a park as a "...miniature community, with all a community's
characteristic complexities" (Christiansen 1977:1). He defines
a park by who uses it and how it is used.
Ian L. McHarg presents another perspective on urban parks when
he discusses how people "need nature as much in the city
as in the countryside" (McHarg 1969:5). When Olmsted designed
Central Park in New York his intention was to bring a taste of
nature into the city. Similarly, books such as Nature in Cities
(Laurie 1979) and Green Cities (Gordon 1990) advocate the
inclusion of natural features and processes in the urban landscape.
Michael Hough supports the combination of urbanism and nature
in order to achieve cities that are "...healthy, civilizing,
and enriching places in which to live" (Gordon 1990:15).
Although community and ecological needs vary geographically, a standard set of criteria is useful to determine where and how a region is parks deficient. The National Recreation and Park Association (NRPA) suggests park standards to determine the size, relative location to population center, size of population and type of parks in a region. They classify all parks into six categories based on descriptive characteristics and recommend a minimum amount of acreage relative to population size for each category (Table 2).
| Type | Acres/1,000 people | Size | Population Served | Service Area |
| Mini-
Neighborhood Park |
N/A | 2,500 square feet-2 acres | 500-2,500 | Sub- neighborhood |
| Neighborhood Park | 2.5 | 5-20 acres | 2,000-10,000 | .25-.50 miles |
| Community Park | 2.5 | 20-100 acres | 10,000-50,000 | .50-3.0 miles |
| Metropolitan Park | 5.0 | Variable | Variable | Within 30 minutes driving time |
| Regional Park | 20.0 | 250+ acres | Serves entire population in small cities | Within 1 hour driving time |
| Special Areas and Facilities | No standard is applicable for this category. Includes parkways, beaches, flood plains, downtown malls, small parks, etc. | |||
| Adapted from the National Recreation and Park Association (1983). | ||||
Many local jurisdictions have adopted these standards or a modified
form of them. For example, the Elmhurst Park District, Illinois,
altered the National Recreation and Park Association Standards
to suit their needs. They oversee twenty-nine parks encompassing
430 acres classified into four categories: mini-parks, neighborhood
parks, community parks, and special use/linear parks (Table 3).
Currently, 9.5 acres of park land exist per 1,000 people residing
within Elmhurst, only one-half acre per 1,000 people below the
National Recreation and Park Association Park Standards.
Elmhurst's modified standards consider fewer park classes and emphasize proximity to public schools. Two of the four park classes promote the utilization of public schools that are adjacent to parks. This adaptation of the NRPA standards suits Elmhurst's needs well, but may not suit the needs of park districts in other areas. Although the age group of the target population and the facilities criteria are not part of the NRPA standards, they serve the needs of the City of the Elmhurst.
| Type | Size | Age Group | Population Served | Facilities |
| Mini-Park | Up to 2.5 acres | Elementary and junior high children | Within safe walking distance of residents | Recreational facilities such as sand boxes, wading pools, court games, and play structures |
| Neighborhood
Park | 3-12 acres | Broad range | One neighborhood | Provides indoor and outdoor recreation facilities if adjacent to elementary schools |
| Community Park | 12-60 acres | Teenagers and adults | Several neighborhoods | Should be adjacent to junior or senior high school to provide facilities for teenagers and adults |
| Special-use/ Linear Park | Special-use parks are areas or facilities that serve one function. Linear parks connect two or more areas. | |||
| Adapted from Elmhurst Park District (1996). | ||||
Another method for assessing parks deficiency is to use a buffering
technique. A one-quarter or one-half mile buffer is placed around
a park boundary. The number of people residing within that buffer
relative to a particular park is calculated and compared with
the National Recreation and Park Association's recommendation
of one acre of park per 1,000 people. Those areas that do not
meet the recommended standard are designated as parks deficient.
Although this method is widely discussed among park planners and
GIS specialists, specific examples are not often published. The
buffering method does answer some questions about parks deficiency
in an urban environment, but does not address such issues as deficiency
based on park type (e.g. active or passive), and ecological needs.
A comparison of community needs with existing park and recreational facilities is another method of parks deficiency assessment, as is done by Mitchell-Lacoss Land Solutions, a park and recreation planning private corporation (Mitchell-Lacoss Land Solutions 1996). Mitchell-Lacoss Land Solutions approaches park planning in four phases:
- An inventory of existing parks and recreational facilities is conducted.
- Public needs and parks resources are assessed.
- Recommendations are made based on discrepancies between public needs and existing resources.
- A plan is implemented that attempts to eliminate existing deficiencies.
Mitchell-Lacoss Land Solutions assesses public needs through phone surveys and statistical analysis. This approach is primarily focused on public perception of active parks and does not consider ecological needs and long-term planning.
Christiansen (1977) and Rutledge (1971) approach park ecosystem characteristics as limitations to recreational activities. They look at the physical features of individual parks rather than the park system as a whole. Christiansen's list of natural resource characteristics is based on assessment of land, surface water, vegetation, meteorology, and wildlife (Table 4).
| Land Descriptors |
|
| Surface Water Descriptors |
|
| Vegetation Descriptors |
|
| Meteorological Descriptors |
|
| Wildlife Descriptors |
|
| Adapted from Christiansen (1977). | |
Rutledge (1971) examines soil features in parks to determine recreation
limitations. Soil type is directly correlated with such features
as bedrock depth, drainage, erosion, flooding, permeability, rockiness,
slope, surface texture, water table, and fertility. The constraint
that the soil represents is described as a slight, moderate, severe,
or very severe limitation. For example, an Alvin fine sandy loam
with 2-4% slope gradients represents a slight limitation for a
picnic area and a moderate limitation for an intensive play area.
An Ashkum silty clay loam with 0-3% slope gradients represents
a severe limitation for both picnic areas and intensive play areas
(Rutledge 1971).
Like Rutledge and Christiansen's techniques, many of the methodologies
discussed in this paper focus primarily on active parks. Parks
deficiency assessment for passive parks is focused more on ecological
and wildlife needs, and preliminary research reveals that similar
techniques used to assess parks deficiency for active parks can
also be applied to passive parks analysis.
Crafting An Acceptable Definition and Applying the Criteria
The second part of this paper examines existing definitions and analyses of parks deficiency in the Portland, Oregon, metropolitan area (Figure 1). Portland is an area of diverse geography and is rich in natural resources. Starting at the Pacific ocean and moving east, the land surrounding the coastal estuaries rises quickly to form a temperate rain forest, the Coast Range, then drops into broad fertile valleys. The land rises again as the Cascade Mountains reach heights over 14,000 feet then drops quickly to become dry high desert country. Portland is situated in the north end of the Willamette Valley, at the confluence of the Willamette and Columbia Rivers, with the Coast Range to the west and the Cascades to the east.
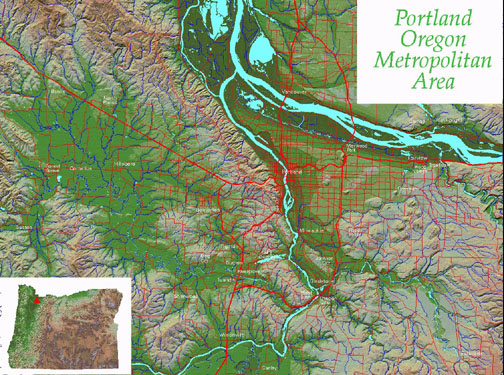
Figure 1
The Portland metropolitan area population is currently at 1.3
million and is expected to grow by about 500,000 in the next twenty
years. In Oregon, laws protect farm and forest land from being
lost to development. The majority of the population lives in cities
within urban growth boundaries (UGB), represented by lines drawn
on maps. A UGB is intended to control urban sprawl and protect
valuable farm and forest land while providing for efficient development
of infrastructure, i.e. water, power, sewer, etc.
Metro, a regional government, oversees the management of the Portland
area UGB by coordinating planning activities with the 24 cities
and 3 counties in the region. Metro coordinates growth management,
transportation planning, and land-use planning for the region's
rapidly growing population. One component of the planing process,
the Metro Regional Parks and Open Spaces Program, operates existing
park facilities and ensures there will be areas with active and
passive recreation facilities in the future. Along with active
and passive facilities, there is also a need to establish green
corridors and connect existing natural areas for wildlife movement,
enhanced water quality, and aesthetically pleasing greenways.
In order to achieve the goal of providing sufficient parks and
open space for the region, a thorough, consensus-based definition
of parks deficiency is necessary. The Metropolitan Greenspaces
Master Plan (Metro 1992) is the foundation that addresses
a number of objectives, such as the protection of a regional open
space system that supports native wildlife and plant populations
while providing access to recreation. Resources are defined in
the master plan using ecological and human criteria considering
short-term, medium-term, and long-term factors. The goals include:
- Create a cooperative regional system of natural areas
- Protect and manage significant natural areas
- Preserve the diversity of plant and animal life
- Establish a system of interconnected trails, greenways, and wildlife corridors
- Restore green and open spaces in neighborhoods
- Encourage environmental awareness by fostering stewardship
The City Club of Portland took the next step by initiating a study focusing more on active recreation (City Club of Portland 1994). The study used the NRPA guidelines, but expanded the study to include the following issues:
- Patterns of changing park use
- Objective standards of adequacy
- Subjective standards of adequacy
- Adequacy based on user demand
Combining elements of the Metropolitan Greenspaces Master Plan
and the City Club study will provide a framework for a comprehensive
parks deficiency definition. Input from local community parks
providers will further strengthen the definition so that geographically
specific goals and values will be incorporated into the process.
At this time, accessibility and connectivity are two elements
that are central to many definitions of parks deficiency, but
are difficult to analyze without the use of a GIS.
GIS gives us the capability to address accessibility and connectivity,
such as identifying where a steep slope provides access versus
flat land and how rivers and freeways act as barriers to wildlife
movement. The configuration of the road system can also impact
access to parks. Combining accessibility and connectivity can
help determine not only where parks deficiency exists, but also
identify areas best suited for inclusion into a regional greenspace
system in an urban environment.
Conclusion
This paper attempts to define parks deficiency in an urban environment. There is one caveat to consider when assessing parks deficiency: one definition does not apply universally. The characteristics that define parks deficiency vary geographically as well as with community needs. Community needs not only vary from place to place but can change over time. A thorough assessment of parks deficiency in the Portland, Oregon, metropolitan area is not complete. At this time, a comprehensive parks deficiency GIS model for Portland is in the initial stages of development. Implementation of the model will begin in Summer 1997.
References
Christiansen, M.I. 1977. Park Planning Handbook. New York, New York: John Wiley and Sons.
City Club of Portland. 1994. Portland Metropolitan Area Parks City Club of Portland Bulletin: 76(17):93-152.
Dramstad, W.E., Olson, J.D., and Forman, R.T. 1996. Landscape Ecology Principles in Landscape Architecture and Land-Use Planning. Washington, D.C.: Island Press
Elmhurst Park District 1996. Parks and Recreation. Elmhurst, Illinois: http://www.elmhurst.org/Pwcode/commun.html.
Gordon, D. 1990. Green Cities. Montreal, Canada: Black Rose Books.
Laurie, I.C. 1979. Nature in Cities. Chichester, Great
Britain: John Wiley and Sons.
Metro 1992. Metropolitan Greenspaces Master Plan. Portland, Oregon: Metro.
Mitchell-Lacoss Land Solutions 1996. Qualifications: Park and Recreation Planning and Design, needs assessment and master planning. Lake Forest, California: Mitchell-Lacoss Land Solutions.
National Recreation and Park Association 1983. Recreation, Park and Open Space Standards and Guidelines.. Ed. R. Lancaster. ?
Nature Conservancy Council 1987. Planning for wildlife in metropolitan areas. Peterborough, Great Britain: Nature Conservancy Council.
Rutledge, A.J. 1971. Anatomy of a Park: The Essentials of Recreation Area Planning and Design. New York, New York: McGraw-Hill Book Company.
Author Information
David Drescher
GIS Analyst
Metro Data Resource Center
600 NE Grand Ave.
Portland, Oregon 97232
(503) 797-1586
drescher@metro.dst.or.us
Paulette Franco-Wills
Master of Science Candidate
Portland State University
Department of Geography
P.O. Box 751
Portland, Oregon 97207
apwills@teleport.com