In the last decade, manatee researchers have recognized the potential GIS application in displaying, analyzing and managing data (Reynolds and Haddad, 1990). GIS applications for manatee and habitat data management have grown rapidly (Weigle and Flamm, 1995). Many agencies rely on GIS maps to help them make decisions for habitat conservation and regulation of human activities. KSC has used ArcView for manatee data visualization since its first release. ArcView is a popular desktop GIS and has been widely used in manatee data display, management and analysis. But ArcView's existing GUI functions are limited and inefficient for the type of analyses that are routinely done by manatee scientists. First, with the KSC manatee data, most needed are data input and update, spatial display and temporal display. In ArcView, these are done manually step by step. So, there is a need to develop new functions for automatic data input, display and management. In order to obtain more functions and develop a more friendly user interface, one must program in Avenue. Avenue can be used to create many new functions not available in the current GUI. Secondly, although many GIS softwares are currently available, no single software is complete enough to manage these data. Therefore, there is a need to integrate different software. Through proper programming in Avenue for specific researcher needs, ArcView could be an effective mechanism for the successful integration with other software. This paper illustrates how to use ArcView Avenue to develop three application programs designed for efficient input, spatial and temporal display. The ArcView Avenue program integrates with Oracle, ArcInfo, the operating system and C programs to increase data management and display abilities.
The lagoon waters of KSC range from 0.3 to 2.4 m in depth averaging 1.2 m in depth. Salinity ranges from 21.0 to 36.0 ppt and averages 26.0 ppt. Approximately 91% of the lagoon waters are dominated by submerged aquatic vegetation including Halodule wrightii, Syringodium filiforme, Ruppia maritima, and Caulerpa prolifera. Only 7% of these waters are dredged and 2% are nonvegetated.
Manatees are found at KSC year round except for very cold periods in winter. Spring and fall are the peak times for manatees at KSC. The spring peak in recent years has reached over 350 manatees (Provancha et al., 1995). All open waters on KSC with depths in excess of one meter are potential habitat for manatees, and large aggregations of manatees are often found where extensive seagrass beds are bordered by deep basins.
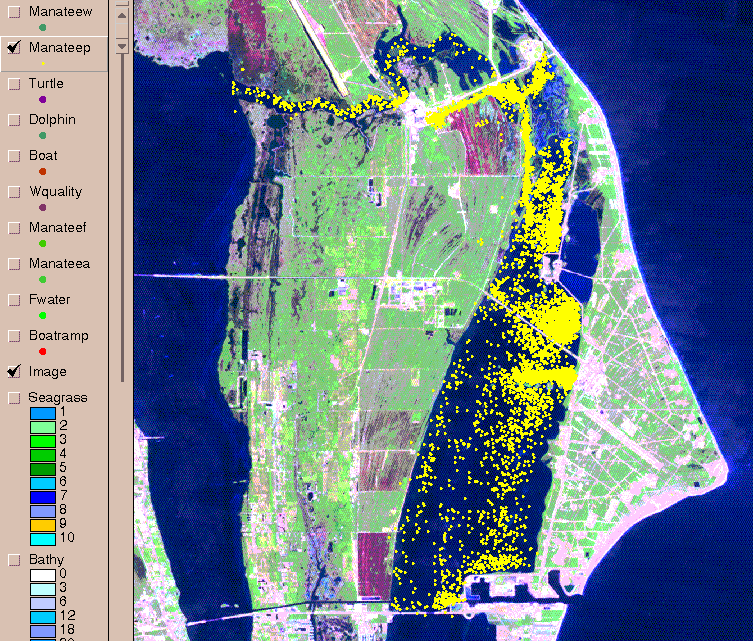
Aerial surveys are an important method for acquiring information of manatee spatial and temporal distribution. The aerial surveys are conducted from a helicopter at an altitude of 150 m and a speed of about 70 kts. The survey uses Loran Global Positioning System (GPS) to locate the position, time, and altitude of each sighting. Other attributes such as adults, calves, total number, behavior etc. are observed and entered into a computer simultaneously. Aerial survey data are point locations and represent a discrete observation of manatees at a specific time and location. After the survey, the data are downloaded to the GIS for extracting and conversion processing. Then aerial survey point locations can be displayed on the basemap with associated attributes.
Seagrass is a basic food source for manatee. Seagrass layers of density maps were obtained through aerial photographs and transect data. Seagrass density was measured in percent coverage of surveyed area (Provancha et al., 1995).
Water resource and depth are also important parameters. Bathymetry data are used to identify potential manatee distribution. Water temperature affects manatee distribution which show a preference for water temperatures above 20 C. Water temperature and salinity were monitored at KSC and were interpolated to surface temperature.
Human activities such as boats are important factors affecting manatees. Boating information from the survey includes locations of boats and boat ramps.
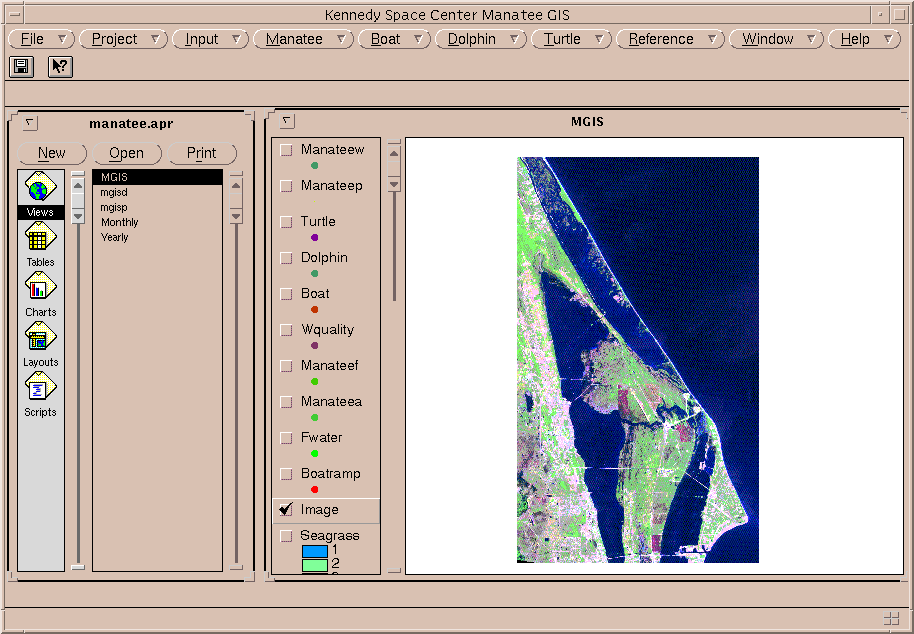
ArcView is a user-friendly and powerful. The ArcView comprehensive GUI environment can display raster, vector, table and chart. ArcView also has a powerful object oriented program Avenue to integrate all elements and procedures. While ArcView has strong visualization and integration ability, ArcInfo provides diverse and strong analysis capability. Imagine is a major satellite image analysis software. The data preparation and analysis are done by ArcInfo and Imagine. The database is stored and managed in Oracle which has strong ability in data querying and management.
Sun Workstations, HP mainframe and PC computers are used at KSC as the manatee GIS platforms. They are connected over a local area network. The interface between Unix systems and DOS systems is by Wabi and Reflection softwares.
Manatee habitat data such as water quality, aquatic vegetation and human activity are stored in ArcView. The manatee occurrence data from aerial surveys are stored in Oracle. ArcInfo is used to analyze the relationships between the manatee and habitat parameters. Avenue in ArcView is used to integrate these programs (Figure 1).
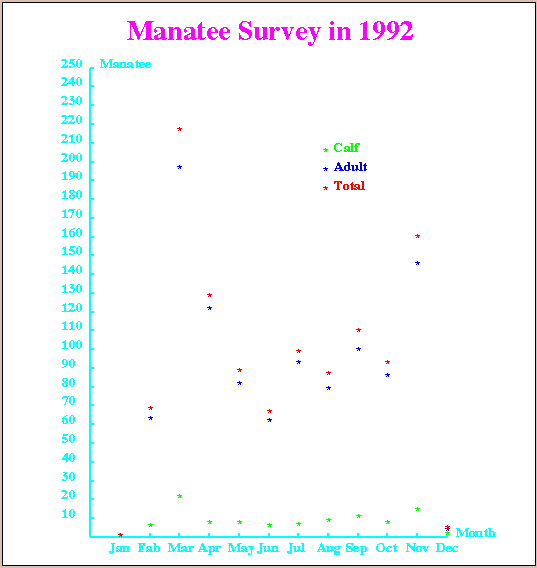
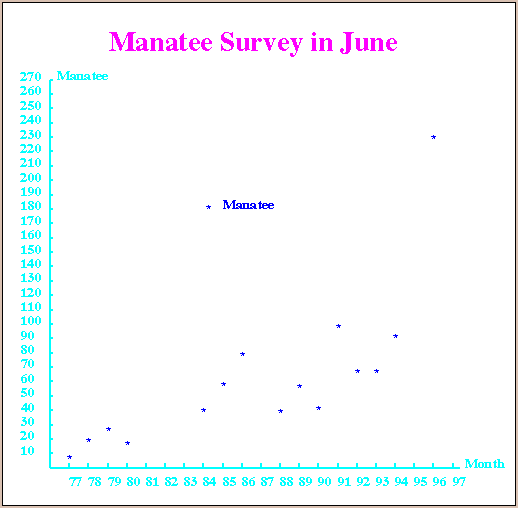
For temporal display, a temporal change diagram appears in a window that displays observation times and manatee numbers over time. During this display, the program gets data from Oracle and processes some computation that will save time and avoid errors. One can add many other related data such as water quality, weather and manatee behavior to the diagram. This temporal display is extremely useful for studying manatee seasonal and historical change. The spatial and temporal display will greatly help manatee researchers to analyze and understand in manatee population changes.
Avenue programming has proved to be a valuable tool for interfacing an Oracle database. Through Avenue programs and friendly menus, users can access the complex Oracle database in a very simple way. Existing ArcView functions were found to be insufficient and inefficient for manatee study. Many new functions and integrating ability will be achieved by Avenue programming. Avenue will further increase GIS applications and help in manatee protection.
******************************************************************************************
theSQL=SQLCon.Find("Oracle")
theSQL.Login("Manatee/Dugong")
'Read file to VTab
InputFile=MsgBox.Input("Enter File Name:","Input Manatee Data","")
theFileName=InputFile.asFileName
theVTab=VTab.Make(theFilename,false,false)
'Put data in the VTab to Oracle
IDs=0
for each record in theVTab
IDs=IDs+1
Day=aVTab.FindField("Day")
Days=aVTab.ReturnValueString(Day,record)
Month=aVTab.FindField("Month")
Months=aVTab.ReturnValueString(Month,record)
Year=aVTab.FindField("Year")
Years=aVTab.ReturnValueString(Year,record)
Latitude=aVTab.FindField("Latitude")
Latitudes=aVTab.ReturnValueString(Latitude,record)
Longitude=aVTab.FindField("Longitude")
Longitudes=aVTab.ReturnValueString(Longitude,record)
Adult=aVTab.FindField("Adult")
Adults=aVTab.ReturnValueString(Adult,record)
Calf=aVTab.FindField("Calf")
Calfs=aVTab.ReturnValueString(Calf,record)
Totals=Adults.asnumber+Calfs.asnumber
InsertValue="insert into manatee"++"(ID,"
+"Day, Month, Year, Latitude, Longitude,"
+"Adult, Calf, Total)"
++"values('"+IDs.asstring+"','"+Days+"','"+Months+"','"+Years+"','"
+Latitudes+"','"+Longitudes+"','"+Adults+"','"+Calfs+"','"
+Totals.asstring+"')"
theSQL.ExecuteSQL(insertvalue)
End
******************************************************************************************
Appendix B
******************************************************************************************
theSQL=SQLCon.Find("Oracle")
TheSQL.Login("manatee/dugong")
'Select date and zone
DayLabels={"Begining","Ending"}
DayDefaults={"01","31"}
DayPeriod=MsgBox.MultiInput("Days from 01 to 31:", "Select Days",DayLabels, DayDefaults)
MonthLabels={"Begining","Ending"}
MonthDefaults={"01","12"}
MonthPeriod=MsgBox.MultiInput("Months from 01 to 12:", "Select Month", MonthLabels, MonthDefaults)
YearLabels={"Begining","Ending"}
YearDefaults={"77","97"}
YearPeriod=MsgBox.MultiInput("Years from 77 to 97:", "Select Year", YearLabels, YearDefaults)
Zones=MsgBox.Input("Zones from 1 to 9", "Select Zone", "1,2")
'Retrive data from Oracle
theVTab=VTab.MakeSQL(theSQL, "select * from manatee"++
"where zone in ("+Zones+") and day between"++DayPeriod.Get(0)++"and"++DayPeriod.Get(1)++
"and month between"++MonthPeriod.Get(0)++"and"++MonthPeriod.Get(1)++
"and year between"++YearPeriod.Get(0)++"and"++YearPeriod.Get(1)++
"and species=6 and total>0")
'Display data on a view
aXField=theVTab.FindField("X")
aYField=theVTab.FindField("Y")
aXYname=XYName.Make(theVTab, aXField, aYField)
theTheme=Theme.Make(aXYName)
theTheme.SetName("Manatee")
theView=AV.GetProject.FindDoc("MGIS")
theView.AddTheme(theTheme)
theView.GetWin.Open
theTheme.SetVisible(True)
theTheme.SetActive(True)
******************************************************************************************
Appendix C
******************************************************************************************
theSQL=SQLCon.Find("Oracle")
theSQL.Login("Manatee/Dugong")
'select manatee data
Year=MsgBox.Input("Years from 77 to 97", "Select Year", "92")
ManateeList=List.Make
For each month in 1..12
FirstDay=0
DayNumber=0
TotalNumber=0
aVTab=Vtab.MakeSQL(aSQL, "select day, totalmanatee from manatee"++
"where month="+Month.AsString++"and year="+Year++
"order by day")
'Manatee data calculation
For each record in aVTab
Day=aVTab.FindField("day")
DayN=aVTab.ReturnValueNumber(Day,Record)
If (DayN<>FirstDay) then
DayNumber=DayNumber+1
FirstDay=DayN
End
Total=aVTab.FindField("TotalManatee")
TotalN=aVTab.ReturnValueNumber(Total,Record)
TotalNumber=TotalNumber+TotalN
End
TotalNumber=TotalNumber/DayNumber
ManateeList.Add(TotalNumber)
end
'Open a view and set display
theView=View.Make
theView.SetName("Manatee Survey Yearly")
theWin=theView.GetWin
theWin.Resize(600,600)
aWin.Open
theDisplay=theView.GetDisplays
theDisplay.SetUnits(#Units_Linear_Inches)
aRect=Rect.Make(0@0,220@300)
theDisplay.ZoomToRect(aRect)
theGraphics=theView.GetGraphics
'Set x, y axis
XAxis=Line.Make(10@10, 200@10)
GXAxis=GraphicShape.Make(XAxis)
theGraphics.AddBatch(GXAxis)
YAxis=Line.Make(10@10, 10@270)
GYAxis=GraphicShape.Make(YAxis)
theGraphics.AddBatch(GYAxis)
'Set tick for 12 months
TickLength=190/12
m=10
For each i in 1..12
m=m+TickLength
Tick=Line.Make(m@10,m@11)
GTick=GraphicShape.Make(Tick)
theGraphics.AddBatch(GTick)
End
'Draw month name
m=5
n=0
Month={"Jan","Fab","Mar","Apr","May","Jun","Jul","Aug","Sep",
"Oct","Nov","Dec"}
For each i in month
m=m+TickLength
MonthGText=GraphicText.Make(i,m@2)
theGraphics.AddBatch(MonthGText)
End
'Draw Y axies tick
TickNumber=260/10
m=10
For each i in 1..TickNumber
m=m+10
Tick=Line.Make(10@m,11@m)
GTick=GraphicShape.Make(Tick)
theGraphics.AddBatch(GTick)
End
'Draw Y axies label
v=0
m=9
for each i in 1..TickNumber
m=m+10
v=v+10
LabelGText=GraphicText.Make(v.asstring,0@m)
theGraphics.AddBatch(LabelGText)
End
'Draw graph
m=10
n=0
For each i in ManateeList
m=m+TickLength
aPoint=Point.Make(m,i+10)
GPoint=GraphicShape.Make(aPoint)
theGraphics.AddBatch(GPoint)
End
'Draw legend
aPoint=Point.Make(140,220)
GPoint=GraphicShape.Make(aPoint)
theGraphics.AddBatch(GPoint)
LegendGText=GraphicText.Make("Manatee", 145@220)
theGraphics.AddBatch(LegendGText)
'Draw title
TitleGText=GraphicText.Make("Manatee Change in 19"+year, 35@280)
theGraphics.AddBatch(TitleGText)
******************************************************************************************
Jane Provancha
Organization: DYNAMAC
Mailing Address: Mail Code: DYN-2
Kennedy Space Center, FL 32899, USA
Telephone: 407 853 3281 Fax: 407 853 2939
Email: provancj@bonsmtp.ksc.nasa.gov
Mark Provancha
Organization: DYNAMAC
Mailing Address: Mail Code: DYN-2
Kennedy Space Center, FL 32899, USA
Telephone: 407 853 3281 Fax: 407 853 2939
Email: provancm@orcinus.ksc.nasa.gov
Resa Reddick
Organization: DYNAMAC
Mailing Address: Mail Code: DYN-2
Kennedy Space Center, FL 32899, USA
Telephone: 407 853 3281 Fax: 407 853 2939
Email: reddickr@bonsmtp.ksc.nasa.gov