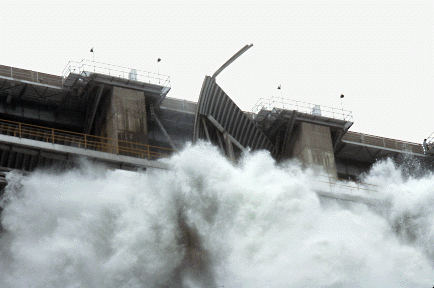
As a major water agency responsible for many dams in the Western United States, the U.S. Bureau of Reclamation (Reclamation) is mandated to develop flood inundation maps for many of its dams in the event of failure. Reclamation and local emergency management teams need to know where inundation might occur, arrival times, and flood wave speed and depth for various scenarios.
To this end, Reclamation's Mid-Pacific Region GIS
Service Center (MPGIS) was tasked to develop a fully integrated
GIS interface to the National Weather Service's DAMBRK (1) model.
This paper discusses the methods used to integrate the ARCINFO,
GRID, TIN, and NETWORK modules to develop a robust GIS driven
hydrodynamic modeling environment that inundation specialists
and hydrologists find very appealing and powerful. References
to commercial products and services are included for discussion
purposes only and do not imply an endorsement of services or products
by Reclamation.
Defining Terms:
AML - ArcInfo Macro Language
ArcInfo - Esri GIS Software
Coverage - ArcInfo GIS layer
DAMBRK - The National Weather Service's DAMBRK FORTRAN model
DBI - DAMBRK Interface
DEM - Digital Elevation Model
Form Menu - AML driven Graphical User Interface
GRID - ArcInfo Raster module
MIKE21 - Danish Hydraulic Institute 2-D hydrodynamic model (2)
Reclamation - U.S. Bureau of Reclamation
TIN - ArcInfo TIN structure
USGS - United States Geological Survey
As part of its mission, Reclamation has the responsibility
to manage, develop and protect water and water related resources
throughout the Western United States. This also means providing
for proper emergency planning in the event of a failure of any
Reclamation facilities. As such, Reclamation is mandated to revise
or create flood hazard maps relating to various dam failure scenarios.
The Mid-Pacific Region GIS (MPGIS) office was asked to examine
the possibility of creating an interface to the National Weather
Service's DAMBRK model. NWS DAMBRK is a one-dimensional finite
difference numerical hydrodynamic model designed to route water
downstream of a given breach. DAMBRK predicts wave formation and
subsequent downstream progression of that wave through a series
of user defined cross-sections. It was written in FORTRAN in 1977
by Danny Fread and co-author Janice Lewis and has had subsequent
upgrades. At MPGIS we have a strong belief that GIS technology
has a lot to offer environmental models such as DAMBRK. The idea
being that a GIS can readily integrate ancillary data during both
model formulation and results analysis, which facilitates efficient
decision making and, in our case, the creation of smart flood
inundation maps. The DAMBRK Interface (DBI) functions as a pre
and post processor, which uses the GIS to help create model input
parameters, read model output files, and subsequently map the
results. Examples of ancillary data for flood mapping include
demographics, transportation, location of weirs, levees and other
water conveyance systems, satellite imagery, aerial photography
and digital elevation models (DEM).
DBI is a collection of AML macros, AML Form Menus,
and UNIX scripts that enable a user to control a robust ArcInfo
session which includes Arcedit, Arcplot, GRID, TIN, and Network
modules working together. The user of DBI does not have to be
technically proficient in ArcInfo to use it. A sound knowledge
base of what ArcInfo is and what it can do is sufficient. DBI
uses digital elevation models (DEMs) to construct the required
cross-sections and subsequent parameters required for running
DAMBRK. The user is essentially in Arcedit, using Arcplot drawing
files (AP files) to view the DEM and all other ancillary data.
The GRID, TIN and Network modules are used during the output processing
steps. The original DAMBRK code was modified to output certain
solution files in formats that ArcInfo can readily use. The output
processing and viewing is primarily done in the raster realm (GRID),
with vector ancillary data being added at will, including automatic
contouring. Map generation of screen displays or creation of final
report maps of flood events is built in. The entire operation
of DBI is performed using AML built GUI Form Menus.
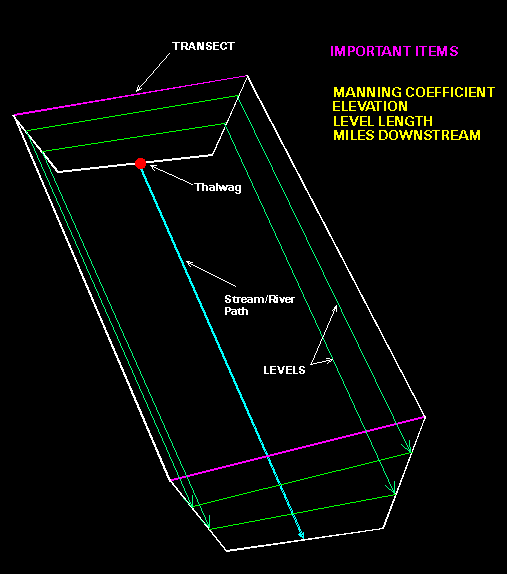
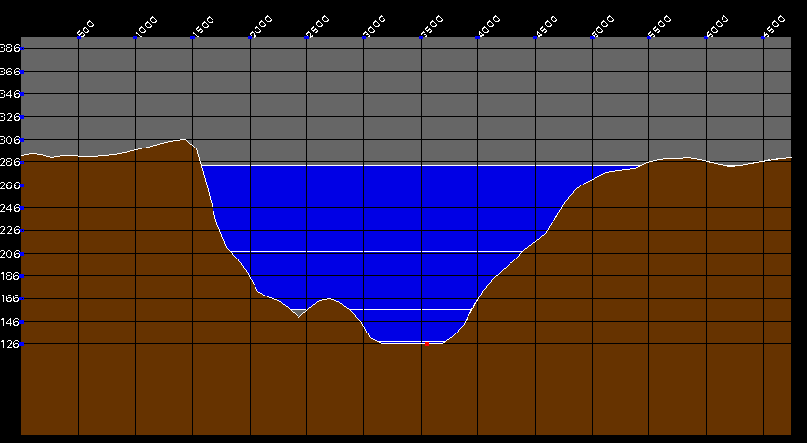
There are six main components to DBI: build/edit cross-sections, populate model parameters, view input parameters, check/verify input and execute DAMBRK code, view model output grids, and make smart inundation maps. When a user begins a model the initial task is to build the cross-sections needed from near the dam to somewhere downstream along the river. To fully explain this procedure it is helpful to understand the basics of how DAMBRK itself works. The task of DAMBRK is to propagate a known amount of water through a series of user defined and internally formulated cross-sections and calculate water depth and flow at the cross-sections. The user can then view a selected set of six hydrographs from the model run. For each cross-section, up to eight levels of top-widths can be defined, each having a known length and a Manning coefficient. The DAMBRK wave propagates from one cross-section to the next in a downstream progression. A descriptive diagram is shown below in Figure 1.
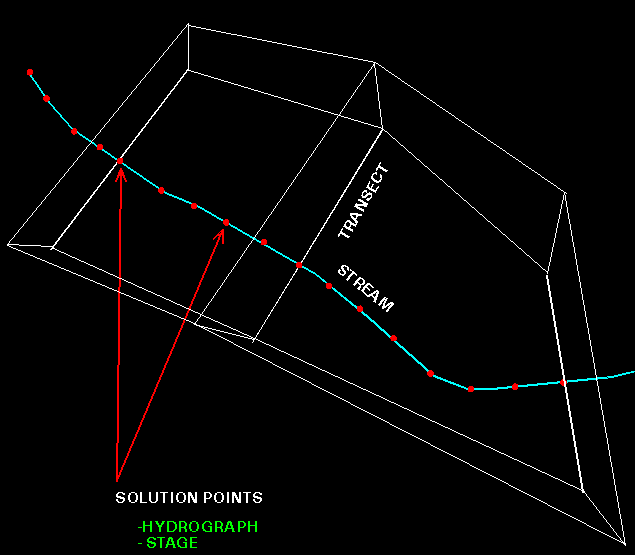
The DAMBRK model has an internally generated series
of cross-sections at specific intervals at which it will solve
for stage and flow (in addition to the ones you specify). These
internal solution cross-sections are commonly referred to as internal
solution points. They are in between the user defined cross-sections.
A simple configuration of this is shown on Figure 2 below.
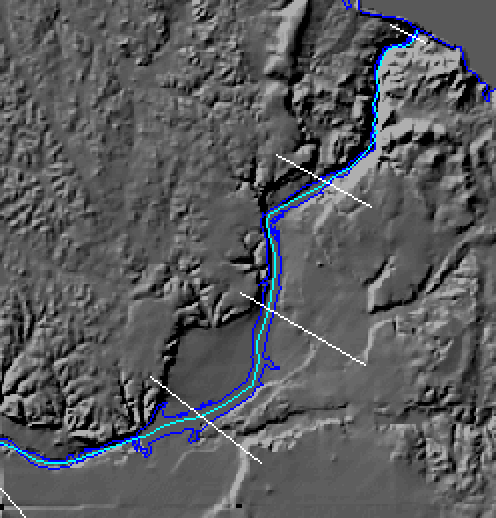
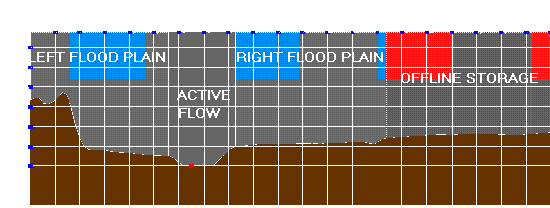
It is desired to generate a mathematical cross-section that adequately approximates the actual one. The method being used in DBI allows the user to graphically "drape" a transect on a DEM and the GIS automatically samples the DEM surface to create the cross-sectional profile (Figure 3).
When DBI is initiated, the main menu appears and guides the user to a specific cross-section building functions. Initially, the user clicks on the 'Add Transect' button. This brings up the cross-section builder menu and the associated graphics.
Once a transect has been "draped" on a
DEM, DBI presents the cross-sectional profile and switches to
the cross-section parameter builder. The subsequent series of
menus and graphics allow the user to develop the top-widths and
to attribute the top-width lengths and elevations. The profile
builder also has modules built in to allow the construction of
flood plain and off line storage areas. Manually, this procedure
would involve hours of drawing transects on USGS topographic maps
and tediously constructing the cross-sectional profile on paper,
and subsequently extracting elevation values observed at or near
an elevation contour line. The DBI method of cross-sectional profile
development is a much faster, more accurate and less time consuming
process. Shown below in Figure 4 is the user's look-and-feel once
optional flood plain and off-line storage areas are defined.
The number of top-width levels must be the same for
all cross-sections. The DBI system is designed to be flexible
and allow the user to add or delete top-width levels interactively
until the desired configuration is reached. The on-screen look-and-feel
is show below in Figure 5.
After the user has created the cross-section top-width
data for all the transects, the DBI system will then build a relationship
between all the cross-sections, the river centerline, and top-width
descriptions. This facilitates the formation of the model input
file required for DAMBRK. Before the user commits the input file
to DAMBRK, the DBI system has some built in tools to scan the
model scenario and detect missing items. This process performs
a minimum requirements check on all user input, and as it finds
problems, it reports them and allows interactive user corrections.
In the early days of DAMBRK, computer cards were sill being used,
and within DAMBRK there can be upto 66 parameter groups, thus
there was a card for each group. In the DBI system, each one of
these parameter group cards is represented by an AML Form menu.
In most cases, not all 66 groups will be used. Consequently, to
expedite parameter entry for a basic run of DAMBRK, the DBI system
has a smaller menu to represent the most commonly used parameters.
At any time the user can switch to the large 66 button menu. The
basic menus include input/output control, headers, desired hydrographs,
reservoir and breach parameters, cross-sections database, and
model run time setup.
The model input file is constructed automatically
by DBI and submitted to the DAMBRK model upon user request. This
input file is formatted to be used for any NWS version of DAMBRK.
This allows for data exchange and verification between many sites
that might be involved in a given simulation. If the model runs
and converges, the DBI system can then visualize output data (e.g.
water depths, maximum inundation, etc.) using the output result
files. The output generation is primarily done within the GRID,
TIN and Dynamic Segmentation modules of ArcInfo utilizing AML
and UNIX macros. The section following outlines the output generation.
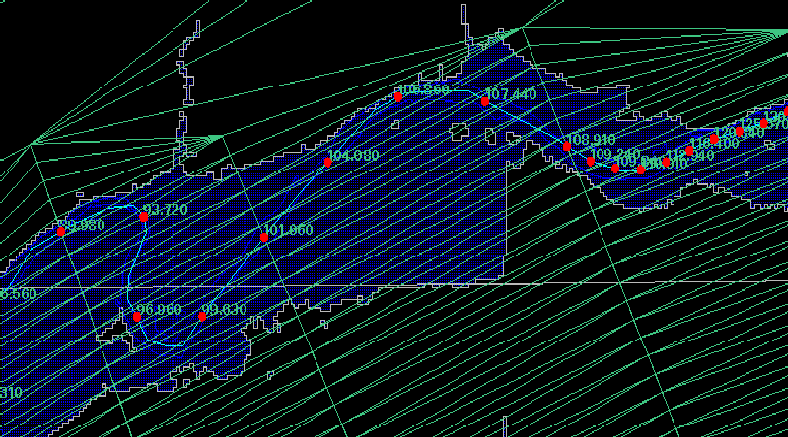
In order to create inundation maps using DAMBRK results, it becomes necessary to map one dimensional model solution points (e.g. maximum water surface elevations) into a two dimensional surface which can be compared to the DEM to determine inundated areas. DAMBRK generates solution points both at the transects and at model generated transects. The model FORTRAN code was modified to write output hydrographs at all solution points, which enabled the mapping of these points along the river centerline utilizing event processing within the ArcInfo Dynamic Segmentation module. The transects are splined at a sufficiently small distance to create vertices along the transect. This facilitates a Dulaney triangle formulation that creates a linear interpolation between the roughly parallel transects when input to the TIN generator (Figure 6). The blue polygon shown in Figure 6 is the resulting inundated area.
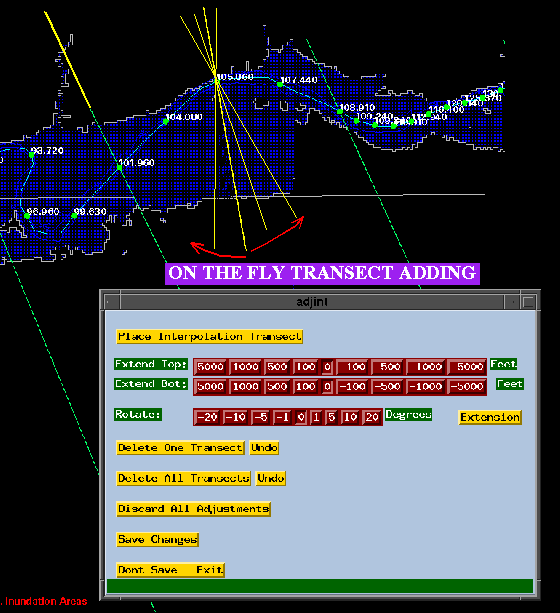
The model generated points can also be used in the interpolation if so desired. DBI allows 'interpolation pseudo transects' to be added at these points, which may be used to introduce a region of influence that a specific point contributes (Figure 7). This ability can become relevant when flow courses deviate from linearity, and the need generally arises from the inadequacies of attempting to map one dimensional data into two dimensional space.
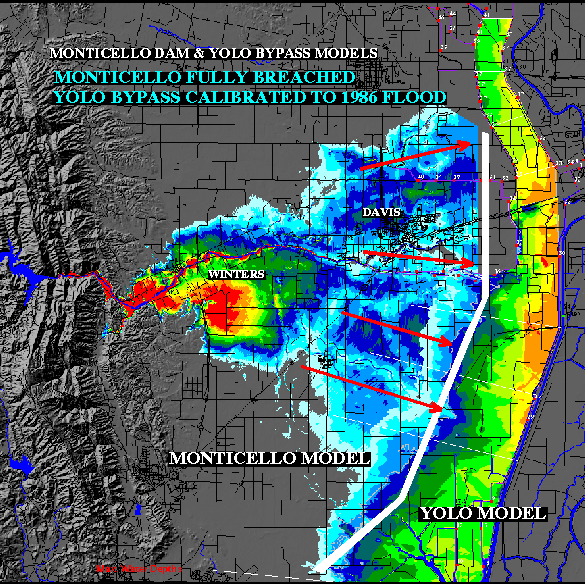
The resulting TIN surface is converted to a grid representing the interpolated water surface, which is compared cell by cell to the DEM surface using GRID map algebra conditionals to produce a water depth grid. A water depth result is shown for the Monticello Dam in California's Central Valley (Figure 8). This particular view includes the Yolo by-pass simulation calibrated to known flood conditions in 1986. The final transect output hydrograph of Monticello was injected laterally into the Yolo model.
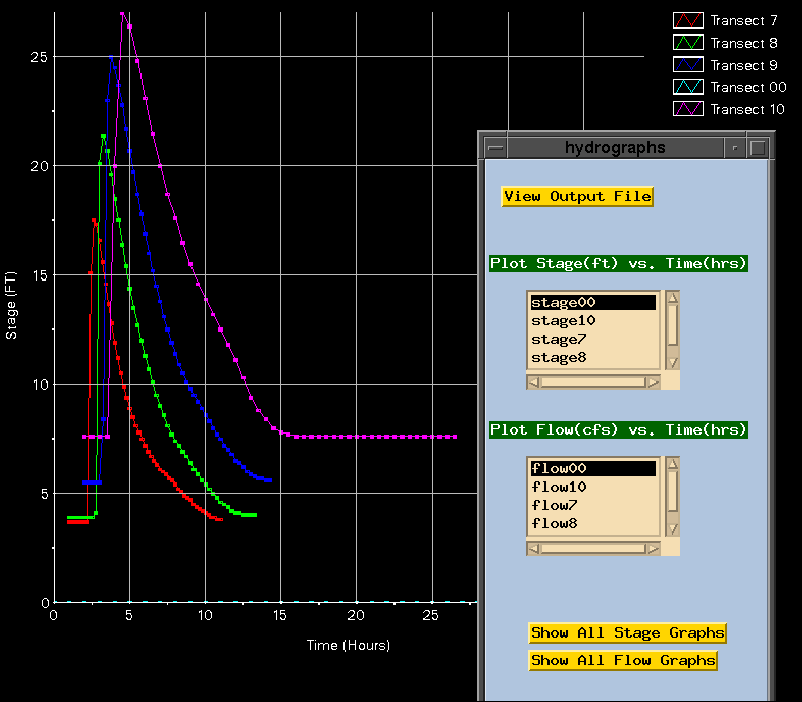
All model results can be visualized directly in the interface. For example, maximum water depths may be presented using color remap tables overlaid on a hillshade. Other data may be subsequently added (Fig. 8). Hydrographs at user selected transects can be plotted (flow or stage vs. time). The hydrographs are generated entirely in ArcInfo. No outside graphing package is used (Figure 9).
Other Model results that can be visualized include maximum inundation, maximum water depths, maximum velocity and time to leading edge grids (ancillary procedures were developed for the leading edge calculations).
The DBI system also allows a user to generate time series based visualization. This added option produces all the required grids for a time series animation of the flood event. This becomes very useful in the planning of emergency response requirements at a given time. The option to drape maximum or time series based flood events is also built into DBI. The entire suite of TIN surface generation and draping tools are made available through Form menus.
We find that the DAMBRK model works well in areas where cross sectional profiles were well defined, usually in mountainous regions. However, in areas that open into large, unconfined valleys, such as the California Central Valley, a one dimensional modeling approach fails to adequately describe the two dimensional flows that occur. Additionally, levees become an important factor in low lying areas as they divert and delay the flood wave.
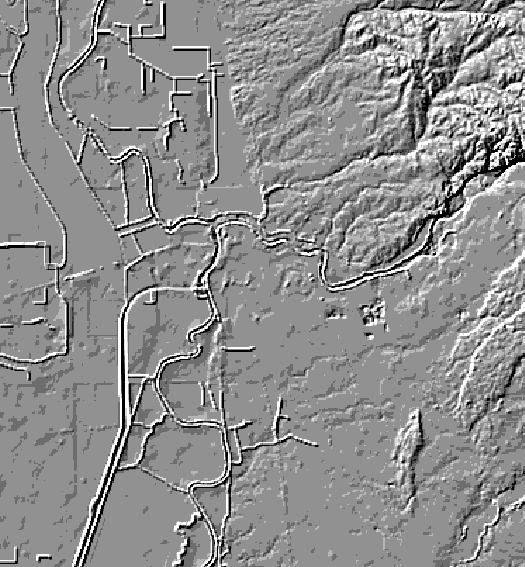
In these cases we have found it useful to implement a two dimensional model. MIKE21 (2), a finite difference engine, is currently being evaluated at MPGIS. MIKE21 facilitates the transfer of GIS data in and out of the model with relative ease. We manage the data on a GIS system, where we 'burn in' vector levee data onto the DEM. The DEM lattice spatially mimics the finite difference mesh. An example of the result of adding levees is shown in Figure 10.
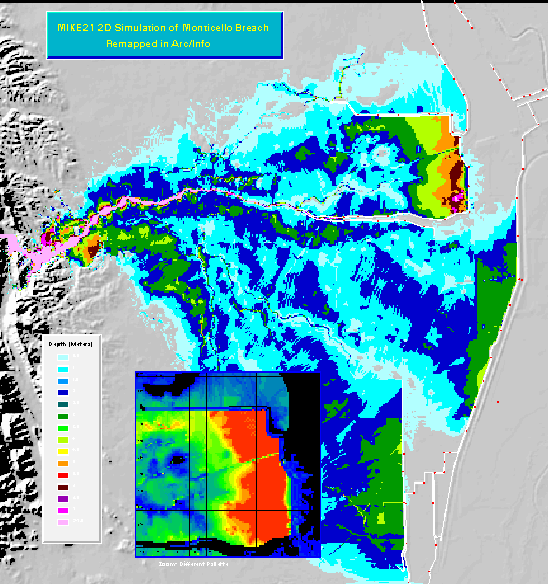
Conceptually, the flood event propagates over the elevation lattice, being influenced by the terrain and the levee structures. The input hydrograph is obtained from a DAMBRK analysis. Model results are then brought into the GIS system for subsequent analysis and visualization. The Monticello Dam simulation processed with the MIKE21 model is show below in Figure 11. Note the zoomed inset showing the effect of levees around Davis, California.
Hydrologic models can benefit greatly when interfaced to GIS. Although development cost and time are issues, we feel the benefit of model data manipulation and functionality far outweigh these factors. Specifically, creating a GIS interface to the DAMBRK model has enabled us to:
The use of USGS DEMs in the construction of DAMBRK top widths is a current topic of discussion in our agency. Clearly, the new 10 meter USGS DEM or interpolation of attributed hypsographic data is preferable. We have found, however, that while there may be some inaccuracies in the 30 meter DEMs in the local vicinity of hydrographic features, when modeling large scale inundation such as a dam breach (where >95% of the flow occurs outside the normal banks), the land surface where the majority of the water will reside is in general agreement with USGS topographic sheets ( usually less than two feet difference). In these cases, when considering other inaccuracies at the conceptual model level, the contribution of highly defined 'in bank' flow is arguably negligible. Additionally, if 10 meter USGS DEMs do not exist, the cost/benefit ratio may be too high.
The DBI system helped us realize that in many cases where a one dimensional model had been applied in past studies (ignoring levees, etc.), large errors were introduced due to numerous assumptions that had to be made. Although some one dimensional models allow for a rather eloquent handling of 'flood plain compartments', we found that in complex levee networks the procedure can be quite tedious, and in many cases impossible. After realizing a two dimensional model was required in many of our study areas, and since the GIS data we were using was easily transferable, preparing the simulation for MIKE21 input was academic.
For the two dimensional MIKE21 analysis, implementation of levees systems in the DEM are handled very well in a GIS. Varying Manning coefficients in two dimensions about the surface is well accommodated in a GRID environment. The ability to categorically breakout raster model output and convert it to polygon vector data for subsequent analysis in conjunction with other vector data sets can only be performed in a GIS. Finally, we feel through experience that modeling efforts, especially large scale endeavors such as those found in government agencies, are by far both more scientifically sound and cost effective in the long term when GIS systems are utilized effectively.
Authors:
Tom Heinzer
MPGIS Consulting GIS Analyst, U.S. Bureau of Reclamation, 2800 Cottage Way MP-GIS, Sacramento, CA. 95825
Tel. (916)-979-2441 Email theinzer@mpgis2.mp.usbr.gov
Michael Sebhat
MPGIS Project Manager, U.S. Bureau of Reclamation, 2800 Cottage Way MP-GIS, Sacramento, CA. 95825
Tel. (916)-979-2441 Email msebhat@mpgis1.mp.usbr.gov