Atbstract: This study utilizes SPOT Imagery to update USGS public domain
DLG data in a PC (ArcView) environment. Typically, vector updates
for digital line graph data require extensive digitizing and
extensive GIS updates. Using SPOTView Panchromatic data we exceed
the accuracy requirements for most updates and can perform vector
corrections in a PC environment quickly and easily. This project
incorporates a technique for DLG data ingestion and SPOT
co-registration. This is followed by an interpretation technique
for line graph editing and updates. The results reveal that this
technique saves time and money while producing very accurate
vector data sets.
A wealth of public domain data is available for a variety of digital mapping and GIS needs. Advancements in computing have made possible the use of PC-based GIS. No longer the domain of high-power, high cost UNIX platforms, GIS is now available to anyone from the casual user to the 'power' user. Advancements in Internet technology have increased accessibility to all manner of data, both domestic and foreign.
Databases depicting land cover, linear networks, as well as wetland delineation are used popularly as baseline data for many GIS projects. Two problems have arisen when many of us have tried to use the data. First, much of this data is in a Digital Line Graph (DLG) format which was originally intended for the UNIX environment. As many GIS packages move to the personal computer environment, the transfer and ingestion of this data can be cumbersome and requires the use of data translators to reformat the data. Second, while this data is extensive much of it was derived over twenty years ago. Obviously, a strong need exists for current imagery for accurate analysis.
As many have discovered, the costs of updating data sets can be prohibitive. While field work is the most desirable data collection source, it is not often possible to complete such an endeavor. Hardware and labor costs for even a small scale project can exceed budgetary constraints. Many look for alternative ways to collect data easily and efficiently. We feel a brief discussion of a few of these methods is warranted. It is important to note that we are only mentioning a brief number of solutions. Any substantial investigation into alternative data sets should be extensive and is beyond the scope of this paper.
Commercial data sets (usually vector) are extremely popular and can be cost effective however one must question their source. Many commercial vendors do not or can not publish their data source. Without a known data source accuracy assessment is impossible. When accuracy statements are made they can often be too generalized to be considered valid.
Airborne Photography offers the advantage of a synoptic view at apparently low cost but requires intensive data manipulation before it can be co-registered in a GIS. We also found that file sizes were too large for easy manipulation in a pc environment. A single quarter quad over our area of interest was 170mb. Although this provided more than enough spatial and spectral resolution for feature update we found we could not sufficiently manage a raster file of this size. We also found the costs prohibitive when attempting to outsource digitization and rectification. Further explanation of this can be found in the Cost Analysis section.
Satellite Imagery offers two distinct advantages. First, there can be a cost savings when project conditions warrant. To satisfy these conditions we suggest looking at the following list of guidelines:
The second advantage is the ease of ingestion and use of satellite imagery. Most commercially available GIS packages have a raster ingestion feature. ArcView can support almost any raster file that is saved as a map projection. A wide variety of projections are supported as well. File sizes can are manageable (approximately 25 megabytes for 30 minute area) and vector layers can be displayed with raster layers.
We have assessed three raster based data sets for this analysis. Each data type was assessed for cost, area, and final cost per square kilometer. Please note that the SPOT data pricing varies widely based upon the product purchased.
Cost Comparison for OrthoRectifiecd Imagery
|
The first step in the process entails acquiring the appropriate data. SPOTView data of the area of interest will be used as a basemap to which DLG data will be referenced. The DLG data will then be modified to reflect topologic changes, as shown in the SPOTView. A techniqure for updating the dlg is presented and two accuracy assessments are made
The U.S. Geological Survey (http://www.usgs.gov) is, arguably, the largest provider of DLG data. Data are available via the appropriate web page (http://edcwww.cr.usgs.gov/doc/edchome/ndcdb/ndcdb.html), and can be downloaded at different scales and topological categories(?) appropriate to the project. As this paper is concerned with updating hydrographic DLG data, it is necessary to procure appropriate data. An excellent source of data of this nature can be found at the National Wetlands Inventory (NWI) web site (http://www.nwi.fws.gov/data.html).
In order to conserve disk space on FTP servers and shorten download times, most DLG data is compressed using one or more compression algorithms. Typically, the files are compressed using Tar and GNU Zip, schemes native to the UNIX operating system. Once downloaded to the user's PC, it is necessary to decompress the DLG data. Any number of PC-based decompression utilities are available that can handle UNIX compression schemes. One of the more popular utilities is Winzip (http://www.winzip.com). In one simple step, Winzip can unTar and unzip the file and save it to disk.
The next step in the process involves converting the DLG data into a format that ArcView can interpret and manipulate. Many ArcView scripts exists that allow the DLG data to be converted to a shapefile, which can then be loaded into ArcView. One of the better DLG-to-shapefile conversion scripts, DLG2SHP.TXT, can be found at the National Wetlands Inventory web site (ftp://www.nwi.fws.gov/). There are complete instructions as well as a sample exercise at this site that can help you covert dlg to shape files.
In the same View that we displayed our converted dlg data we used the following commands:
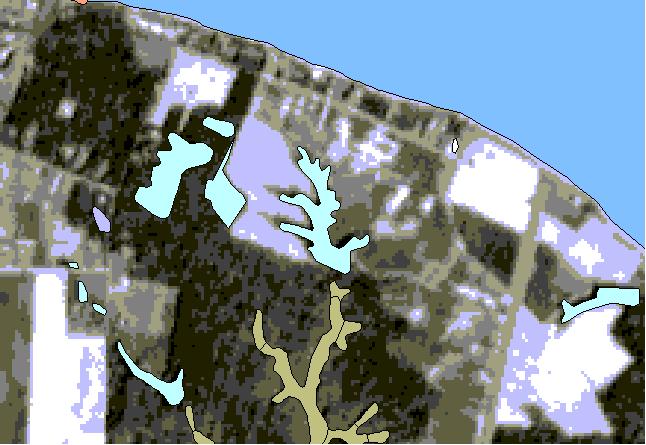
Fig 1: The DLG and SPOTView data combined. Noticed the wetland feature at the center of the image. The two fingers on the western side of the lake do not complete the polygon area.
Once both the original dlg data and the satellite imagery were loaded both data sets were co aligned over the same geographic region. Place the SPOT data below the dlg data. We suggest that you convert the dlg to a polyline format if it is in a true shape mode Select each line you wish to update. Using the extensive tools found in ArcView you can add/remove line points as well as adjust them. For each point we tried to place the updated line within three pixels (error allowed for mixed pixels) of the demarcating line in the satellite imagery.
We used the following decision criteria for decision rule line placement: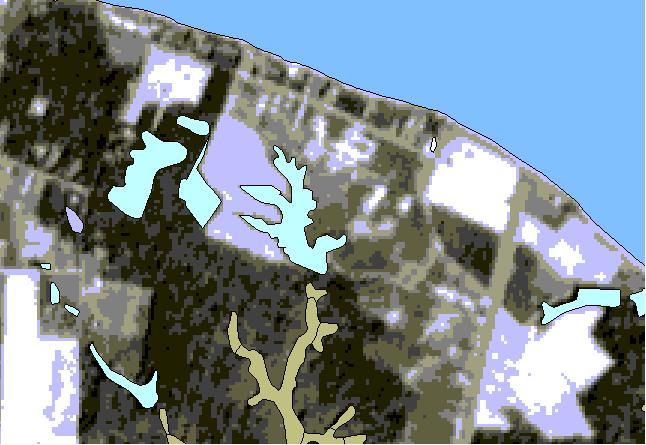
Fig 2: The DLG and SPOTView data combined. We have updated the center wetland feature in this image. Notice that the borders of the new dlg have been extended to capture the entirity of the feature.
For this exercise we have assessed both the plannimetric accuracy (largest possible actual error) as well as used a random sample to verify our results. The plannimetric accuracy was calculated using the following formula: SV+MMU+3(MP)=LA Where: SV = SPOTView Accuracy MMU = Minimum Mapping Unit (Amount of possible line displacement) MP = Mixed Pixel Tolerance LA + Locational Accuracy
Using these tolerances we derived a maximum possible locational accuracy of 142 meters. This was derived using the minimum mapping unit value of 100 meters. Although we very rarely found features that we excluded from our study we want to make sure that features that fell below this value were included in our assessment. Next, we added the total amount of error possible from the SPOTView imagery. Using USGS 1:24000 Topo quads and 3 arc second USGS DEM data orthocorrected SPOT data has an accuracy of 12 meters or fifty feet. We then simply added the tolerance set for mixed pixel values.
We also performed a simple random sampling of the data to assess overall accuracy. Overall accuracy was calculated at 92% with most of the error occuring in regions of mixed pixels.
We strongly reccomend a field test to reverify these accuracies. In this scenario where there were no external funds allocated for hardware or software update it was not possible to perform such an analysis.We were generally satisfied with the results from this manual update technique. Using basic air photo interpretation skills we were generally able to fulfill the requirements to update the imagery. DLG ingestion and transfer took far less time than we expected. The use of DLG converters alleviates the Unix file format problems we expected to encounter.
Although the time per frame for dlg update was slower than expected we are very satisfied with our accuracy results. As soon as time permits we plan to collect field data to verify these findings and will post them as soon as they are complete.
We suggest that anyone cosidering this low cost/low tech alternative to source data updating review the available options for base data. End of File
Terrence V. Busch
Sales and Technical Support
SPOT Image Corporation
1897 Preston White Drive
Reston, VA 20191-4368
Phone: (800) 275-7768 ext. 125
Fax: (703) 648-1813
Email: busch@spot.com
Home Page: www.spot.com
Paul T. Dilick
Satellite Programmer
SPOT Image Corporation
1897 Preston White Drive
Reston, VA 20191-4368
Phone: (800) 275-7768 ext. 159
Fax: (703) 648-1813
Email: dilick@spot.com
Home Page: www.spot.com