
Authors
Daniel B. Cozad*
Peter Vitt
Jerry Oldenburg
Title
SAWPA SAGIS 2 Tools for Groundwater Management
Abstract
The Santa Ana Watershed Project Authority of Riverside California, with its member agencies, is charged with watershed management and improvement for the Santa Ana River Watershed. Based on our solid history in groundwater data management, SAWPA has embarked on a new project (SAGIS 2) to create water management tools for use by SAWPA, its member agencies, and other managing groundwater. SAGIS 2 will utilize the existing databases available and provide tools utilizing Arcview, the Spatial Analyst Extension, the Dialog Designer Extension, and the 3-D Extension from Esri. The tools will simplify the connection between well location information and detailed groundwater data, allowing point and click availability of simple analysis and reporting tools. By packaging the tools as extensions that load into Arcview we capitalize on the power of Arcview and simplify difficult or repetitive tasks. This paper and presentation will discuss the need for the tools, the project management and scoping requirements, the technical challenges, and progress to date.
SAWPA, The Agency and the SAGIS 2 Project
The Santa Ana Watershed Project Authority (SAWPA) of Riverside California USA, with its member agencies, is charged with watershed planning, management, and improvement in the Santa Ana River watershed. The agency was formed in 1972 and is comprised of five member agencies. SAWPA's planning department has a solid history of groundwater data management success. This history includes the development of Santa Ana GIS (SAGIS) a customized ArcInfoÒ application developed in cooperation with the US Bureau of Reclamation. This application uses Santa Ana Basin Relational Information Network Application (SABRINA) an OracleÔ database developed for management of groundwater data by SAWPA.
SAWPA has embarked on a new project called SAGIS 2 to create water management tools for use by SAWPA, its member agencies, and other managing groundwater. SAGIS 2 will utilize the existing available databases and provide tools utilizing ArcViewÒ , spatial analyst, dialog designer, and the 3-D extensions.
The tools will simplify the connection between well location information and detailed groundwater data, allowing point and click availability of analysis and reporting tools by users who are not trained to used ArcInfoÒ . By packaging the tools as extensions that load into ArcViewÒ , we increase ArcViewÒ 's power to simplify complex, multi-step, and repetitive tasks.
SAWPA's SAGIS 2 project is building ArcViewÒ Extensions using Avenue to simplify and expand groundwater analysis and mapping with the following tools:
General Tools and Data
The general tools will include a utility to identify the projection of your theme in California. This allows the theme's projection to be changed to fit existing data. Standard legends, layouts, templates, and water symbols will improve and standardize water-related maps and simplify map generation. Sample data will accompany the extensions for initial work and as examples.
Water Level Tools
This tool shows water depth to water as contours or color-coded points and shows water depth and land surface or historical water depth to calculate water gain or loss. It also charts level changes by year, season, or period.
Water Quality Tools
This tool identifies wells exceeding basin objectives, maximum contaminant limits, or a user-entered level for contaminants or water quality parameters. Upon selection a map of the area affected with concentration contours, shaded bands or color-coded points are presented. The tool also charts changes in concentration of contaminants or water quality parameters over time in maps and tables.
Data Management Tools
This tool allows the selection of wells by area, or other information and the import or export of data via SQL or ODBC. Edit local copies of data or import new data for mapping or use with other tools. Specialized links to special well data are supported for photos, logs, and tables. Tools to update and manage data are included. Database access is accomplished through a universal initialization integration or abstraction layer to provide customization for individual databases while maintaining code consistency. Location of wells by Name, State well number, Alias, or other methods are also provided.
Water Production Tools
This tool integrates the specific needs of watermasters to the toolset. The tools will allow analysis of production information by basin, area, or summary areas with comparisons to historical data and legal requirements. Well access and contact information and data export and reporting tools are included.
These tools provide easy to use utilities in a unified interface to simplify the use of GIS for groundwater planning and management. The tools also allow experienced ArcViewÒ users or Avenue programmers useful documented utilities to customize for their organization. The project will build these tools in tasks and phases over approximately one year and make them available to member agencies and stakeholders on a continuing basis.
New Tools Needed
In discussions with the users of SAWPA's data, we found many agencies did not have full time GIS or ArcInfoÒ operators. Smaller agencies and departments had the same data management tasks and planning requirements as the larger agencies, but water resources engineers and others had little if any GIS support for their activities. SAGIS 2 tools allow engineers and planning staff easy access to water data in a simplified interface that focuses on the types of analysis they need the most. The flow chart below indicates the planning and production steps and data integration requirements for the tools.
Project Scoping, Management, and Funding
Project management activities for the development of software applications are frequently overlooked. The Project Management Institute's Guide to the Project Management Body of Knowledge indicates that inadequate project scoping, planning, and management is a major cause of project delay or failure.
Project Scoping: The scope of the SAGIS 2 project was drafted initially on assessed needs of the SAWPA and potential project stakeholders. This needs assessment and initial scope was discussed with staff and management to provide project awareness and solicit responses. This process also communicated the project's requirements and value produced. This process was documented in a brief memorandum forming an initial project plan. Because the project is funded through continuing support of our member agencies, the next step was to discuss the project with them. Our member agencies and stakeholder provided excellent feedback on the draft and allowed a refinement of the scope to better server their current and future needs. A stakeholders meeting was held to discuss the concepts and prioritize the tools. The meeting successfully provided the prioritized list of tools.
An important part of project management is scheduling. An initial schedule was developed for discussion and presentation. Software development projects have the reputation of finishing late and over budget. Because this project is resource limited the schedule must take into account existing projects and support of our member agencies and staff availability. Resource limited scheduling is slightly different from deliverable deadline scheduling because budget must remain constant. With a constant budget there are two variables Time and Staff, resource limited projects determine the date that the project tasks can be completed by consideration of staff availability and task effort. Deadline driven tasks require the ability to add staff as needed to accommodate the deadlines. Commercial software developers and consultants frequently use this type of scheduling.
As a function of this scheduling and planning activity, "make or buy" determinations should be made. The "make or buy" determination is a careful analysis of the organization's ability to accomplish all needed tasks to complete the project. SAWPA has determined that we will develop most tools in-house, and that we will likely use outside consultants for development of the database connectivity portion of the tool, described later.
Most project funding for development is provided by our member agencies as part of their continued commitment to properly manage groundwater data in the watershed. Funding discussions with stakeholders who are not represented by one of SAWPA's member agencies or are outside the watershed have been initiated, with cost to be determined based on the needs of the organization.
Additional funding or rescheduling of other staff activities may be required to accelerate completion of project tasks in accordance with the schedule. A project schedule is a living document intended to forecast the completion of tasks based on the original baseline schedule and changes based on scope and project efficiency. This project schedule will be updated monthly during the duration of the project indicate the projects progress and any changes to delivery of tools.
Why Extensions to ArcViewÒ ?
The project team discussed various programs and user graphical user interfaces for the project. ArcViewÒ was chosen because of its ease of use and ability to be customized through Avenue. Additionally, ArcViewÒ builds on the coverages and experience gained in the original SAGIS and spatial analyst and 3-D analyst extensions allow ArcViewÒ to accomplish the analyses needed.
Our stakeholders include member agencies that are familiar with GIS and water districts and departments who do not have any GIS capabilities. Utilizing ArcViewÒ and the SAGIS 2 toolset, both groups can benefit maximally. Users with sophisticated GIS personnel and skills will be able to accomplish some of the tasks they do routinely with greater speed and consistency. Users with little GIS experience will be able to quickly perform analysis and produce maps and documents that they need with little training. Additionally, as their skills grow they will have coverages, data, and all the power of ArcViewÒ to create their own analyses and applications.
Extensions can be loaded into any ArcViewÒ project and make all the scripts and special interfaces available to the user without additional loading or complications. In addition, the extension will have a main control panel providing easy linkage to all features of the tools, seen below. In addition, extensions can be unloaded when no longer needed freeing up memory.

Groundwater Data Management
The management of groundwater data is complex. Data is collected from a number of sources. A large variety of data must be collected and accuracy is paramount. Well and groundwater information can be substantial. SAWPA maintains positional and analytical data on well over 10,000 wells in the watershed. Some of these wells have hundreds of samples and thousands of analytical details.
SAWPA has located the wells in the basin based on a number of methods. The California State Well Number contains approximate positional information, many wells are located on watermaster maps and district maps, and SAWPA and its member agencies are locating wells using GPS technology.
Technical Challenges and Solutions
Several technical challenges are presented by this project. The most significant is the integration of the tools to many different databases and file formats. The tool must accommodate similar data known by different names and in different formats. This technical challenge will be accommodated by the use of a data abstraction or initialization interface layer. This layer as indicated below "customize" the tools to the database or databases of an organization. Building this interface will likely involve the efforts of consultants to integrate the different methods of access and insure universal operability after installation.

Detailed Description of the Tools
Theme Locator Tool
Theme locator is designed to help define projection parameters for a theme of unknown projection located within Southern California. The extension uses dialog designer for its GUI interface. The user selects the theme by using a button on the tool GUI. After clicking the OK button, the View is zoomed in the location of the theme relative to Southern California Counties. A message is displayed in the dialog box indicating all input projection parameters required for re-projecting the theme with the ArcView Projector Extension.
The projection information is obtained by adding the theme of unknown projection to a View containing polygon themes of Southern California Counties projected into several different coordinate systems. This could be used in any location by taking common areas and projecting them into different coordinate systems. The extent of the theme is compared to the extent of each of the Southern California Counties themes and if the theme of unknown projection intersects any of the county themes, a message is displayed indicating the projection parameters.
The Theme Locator can identify the following projections appropriate to SAWPA and Southern California:
Water Quality Analyst Tool
The Water Quality Selector Tool selects water quality or elevation data from a .DBF table and well coverage based on input from the user. The user selects a .DBF table, chemical/parameter of interest, dates of interest, and area of interest from scroll down menus and buttons located on the tool GUI. This process is intuitive and similar to the process used to filter a database or spreadsheet. This process allows the use of data that has unique columns, from a flat file, or data that is from a database export.

The utility achieves this functionality with the following processes. A file dialog prompts the user to select a .DBF table to bring into the project. The .DBF table is either native to ArcView or is generated as a temporary table from an ODBC, OLE or SQL connection to the target database. This tool uses the .DBF table; database connections are made in the database management tool area. A bi-directional link is created between the table and the SAWPA well coverage. The bi-directional link allows for a one-to-many relationship between the well coverage and the table, and also updates the selected set for both the table and the well coverage in response to changes in the selected set of either. After the link is created, the user selects the column in the table with the measurement name and the column with the measurement values from drop-down list boxes on the tool GUI.
By using this type of selection, data to be selected from a table with parameter measurement values in separate columns (common for spreadsheet data), or with parameter measurement values in one column (common with data extracted from a database). The user may then select data according to date ranges. After selection of tabular data is complete, the user may select wells graphically or by groundwater sub-basin or any other polygon coverage or shapefile. An average is computed of all selected measurements for each selected well to achieve a one-to-one relationship. A new shapefile is created with selected wells and the new averaged data. The attribute data from the shapefile may be exported to an MS Excel file, or the shapefile may be color or symbol coded in Arcview by using buttons on the GUI. The shapefile may be transferred to the contour tool for calculation of contour lines using Arcview Spatial Analyst.
Database selections may be "hard coded" on installation to reduce the selections needed by the user. The attribute data from the shapefile may be exported to an MS Excel file, or the shapefile may be color or symbol coded in Arcview by using buttons on the GUI.
Contour Tool
The contour tool allows the user to create contour lines for a point theme using a variety of interpolation methods including Spline, IDW, Ordinary Kriging, Universal1 and Universal2 Kriging methods. The tool coverages. The user is aided in the selection process with statistics on selected data. The user may also label points with values and color-code points based on values. Contour lines may be labeled after they are created, and background coverages may be added as basemaps to the view.

The tool works uses the following process to achieve its results. A file dialog prompts the user to select a point theme; the tool adds it into the view. After selecting the data to be used for contouring from a pull down menu supplied from the attribute table, the user may click on a button to calculate statistics on the point coverage. The statistics include information useful for contouring and grid analysis:
These statistics will assist the user in selecting defaults and picking which points to include when contouring. The statistics can be recalculated each time the selected set changes to provide a dynamic view of the data. Other highly useful features on the dialog GUI include:

Points are selected using a checkbox to select or unselect all points, and tools are available to add or remove points graphically. After points are selected for contouring, the user selects the surface interpolation method. These methods include Spline, IDW, Ordinary Kriging, Universal1 and Universal2 Kriging methods. Default values are set for all variables based on test data sets and give the user and idea of what values usually work well with groundwater. To accommodate site specific conditions the user may change all variables. After the surface has been created, contour lines are calculated at the click of a contour button and converted to a new shapefile. Like points contour lines may be labeled individually using a graphical tool, or all lines may be labeled or unlabeled using a check box.
Other Tools in Process
Water Well Pallet

The water well pallet allows symbols that are relevant to wells and groundwater to be used easily. This tool works like the symbol pallet supplied with ArcView and is based on standard well symbology. Other specialty symbols for the water industry will be added to simplify mapping of water resources.
Base Map Management Tool
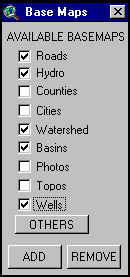
The base map management tool provides a customized method to add and delete basemaps from a view or project. The advantage to using this system is that it minimizes confusion about the location and version of commonly used basemaps. Common types of basemaps are included and customized during the install process. After installation as long as the name and location is constant basemaps can be changed and the tool will provide the latest base map for the project.
What have we accomplished, and where we are going from here?
SAWPA has completed the stakeholder needs assessment, scoping, and initial scheduling. We are about 60% complete in building our tools and exporting them as extensions. The next few months will see vigorous activity completing tools and testing of individual tools. Full release of the toolset is scheduled for November 1998.
Primary Author Information:
Daniel B. Cozad REA
Project Manager Planning, GIS/IS
Santa Ana Watershed Project Authority
11615 Sterling Ave.
Riverside, California 92503
(909) 785-5411
(909) 352-3422 Fax
Email dcozad@usa.net