Authors: Maggie Smith, Jeff Lucas
Abstract:
Natural Resource Managers are continually seeking historical and current information pertaining to the natural resources they are charged with stewarding. Continual decline in water quality and quantity, which affects all other natural resources, compounds the difficulty in managing these resources so they will be available and consumable for coming generations. The Rainwater Basin Joint Venture has developed a management tool, using various Esri GIS software, to assist resource managers in easily tracking the status, trends, and quality levels of the natural resources within the Rainwater Basin area. Utilizing over 25 layers of spatial information provided on CD by the RWBJV GIS Committee, resource managers will have the capability to research and analyze soils, groundwater levels, nitrate contamination levels, elevation contours and neighboring landuse characteristics, to name a few. This information can assist managers in reviewing current land and water use practices in addition to planning or restricting future agricultural, municipal, and industrial development. Resource information available in digital format on a portable medium in a GIS will improve information delivery to the landowners, improve quality of decisions, and allow the Joint Venture agency partners (state and federal) to deliver more uniform and timely technical assistance. The ability to take this data to the field will place the technology and data into the hands of those specialists that provide technical assistance to landowners and operators. Bringing the natural resources discipline into the technology age will allow for on-site analysis concerning resource management issues.
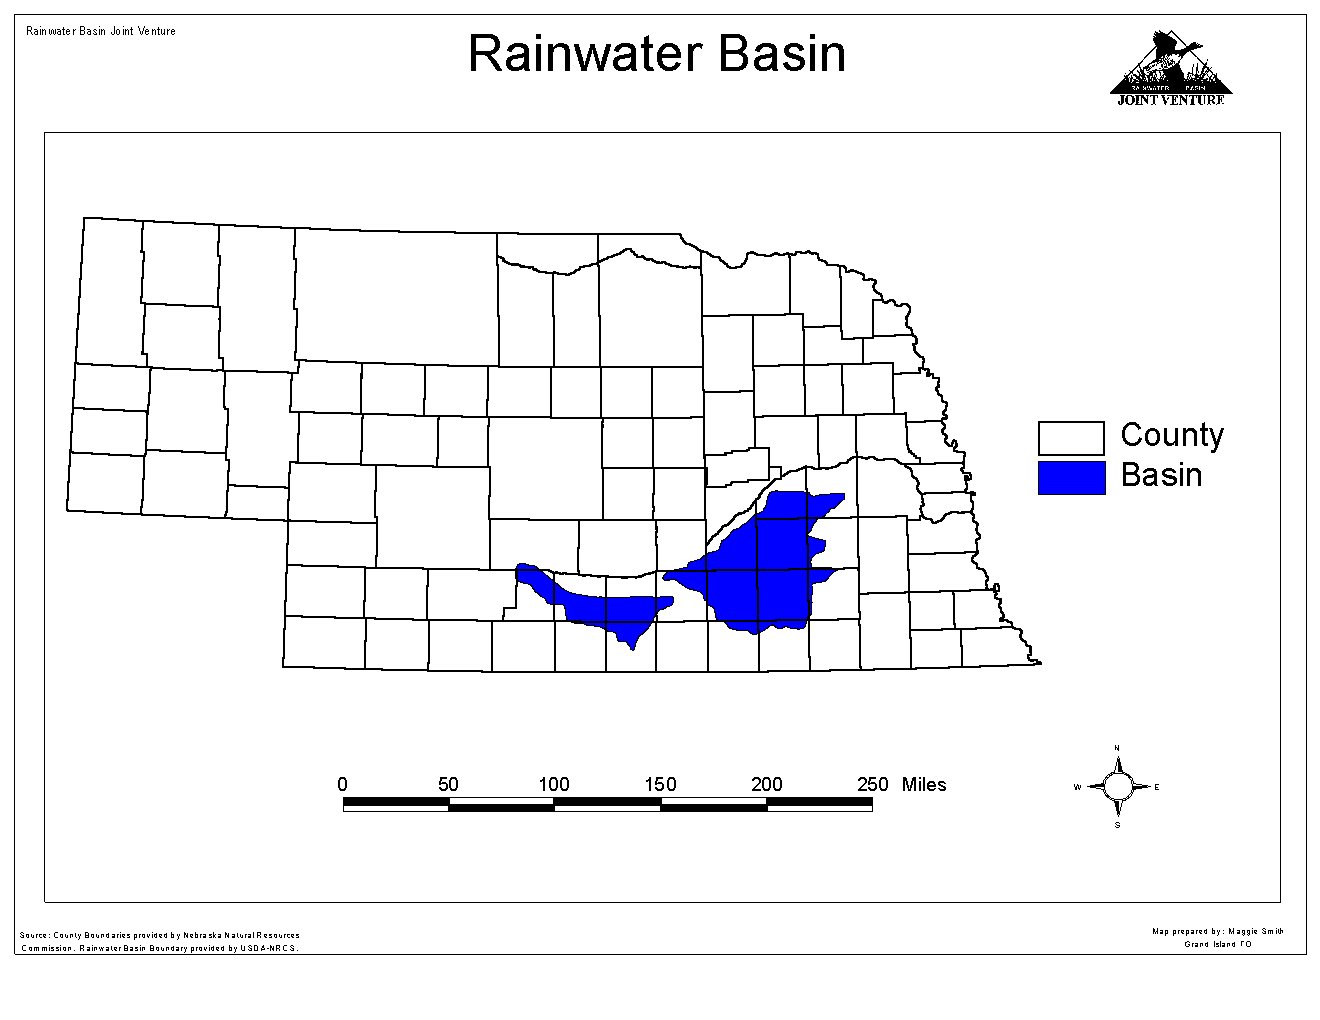
The Rainwater Basin Joint Venture (RWBJV) is a program approved as part of the North American Waterfowl Management Plan (NAWMP) which is a partnership strategy for preserving, restoring, and improving habitat for waterfowl populations across the entire North American continent. The Basin landscape encompasses 4,200 square miles within 17 counties in South Central Nebraska. The Joint Venture, with participants from several federal, state and local entities, recognizes the need to be on the cutting edge of technology. Establishing partnerships and securing funds has enabled the Joint Venture to begin to provide necessary equipment for an effort in Geographic Information Systems (GIS).
GIS technology gives us the ability to satisfy our never ending need for new and historic information quickly. This technology will soon prove to be a resource manager's main information analysis tool for the twenty-first century. With the software capabilities of ArcView and/or ArcExplorer, every resource manager can have volumes of information available on compact disk when attempting to deal with a natural resource related issue. This information will be taken to the field on a laptop computer, or used in the office on an affordable personal computer. Preliminary research and fact finding efforts, surrounding every natural resource issue, can usually be done using a GIS before stepping foot on site.
The "amount" of GIS information is not a problem for natural resource managers, but the "distribution" is. Numerous layers of digital data have been created and are available through various federal, state and local agencies in Nebraska. Some data is available via download through the Internet, and some isn't. Data is created in different projections. The goal of the Rainwater Basin Joint Venture GIS Steering Committee is to promote GIS as a working resource inventory field tool. This requires the organization and packaging of digital data in the same projection and datum on an accessible medium (CD) through an interagency partnership of local and federal agencies. This goal is becoming a reality as the RWBJV partners, working in cooperation with Environmental Systems Research Institute (Esri) continue to work together gathering existing digital layers pertinent to the natural resource field, converting them to a common projection and packaging them for use by technical experts in the field. Resource information available in digital format on a portable medium in a GIS will improve information delivery to the landowners, quality of decisions, and allow the Joint Venture agency partners to deliver more uniform and timely technical assistance. The ability to take this data to the field will place the technology and data into the hands of those specialists that provide technical assistance to landowners and operators.
The Rainwater Basin Joint Venture (RWBJV) GIS Steering Committee founded several years ago was originally comprised of individuals from mid-level managerial positions. The agencies represented included Nebraska Game & Parks Commission (NGPC), US Fish & Wildlife Service (USF&WS), US Army Corps of Engineers (USACE), Nebraska Natural Resources Commission (NRC) and USDA-Natural Resources Conservation Service (NRCS). These individuals understood the need for improved availability of geographic information pertaining to natural resources. Recently, as GIS has become a more recognized discipline, agencies have hired GIS Specialists, and the Committee has grown. However, the growth of the GIS department did not reflect a growth in availability or accessibility of GIS information at the field level.
The first step toward completing the needed tasks was to secure funds. The Joint Venture submitted a grant application to the Federal Geospatial Data Committee (FGDC) in the spring of 1997. The application process prompted the RWBJV GIS Steering Committee to develop a workplan, designate leadership roles, and develop a resource inventory of digital coverages already available, and those to be developed. The Esri Arc platform was chosen as the platform of choice with the data to be projected in UTM, NAD83. The FGDC grant application was denied, but $35,000 was secured in grants from US Fish and Wildlife Service, North American Waterfowl and Wetland Office, and US Bureau of Reclamation because of their interest in the RWBJV GIS effort.
The Esri platform was selected as the platform of choice between the cooperating agencies. Esri Corporation provided several complimentary copies of ArcView 3.0 to the Joint Venture to promote use throughout the agencies. The copies were distributed to partner agencies that did not, at the time, have GIS software. This allowed for greater ease in data transfer and use. Many of the existing digital coverages were created in ArcInfo and could therefor be accessed in ArcView.
The Joint Venture GIS Project Leader collected the existing digital data and coordinated the efforts of creating and collecting the digital data not yet developed. Those digital layers already developed included the Digital Orthophoto Quarter Quads (DOQQ), section lines, section corners, TIGER files, Digital Elevation Models (DEM), 2 acre cell soils, National Wetlands Inventory (NWI), USF&WS public lands, NGPC public lands, 1988 Landuse, Thematic Mapper Imagery, and registered wells for the Rainwater Basin. Those to be developed or acquired included soil survey lines, historic wetland data, agency program projects on private lands, and USGS topographic maps.
Each contributing agency was responsible for specific layers. Several agencies hired temporary help to complete the tedious workload of creating new digital layers. NGPC created a new historic wetlands layer, USF&WS and NGPC created a Microsoft Access database to encompass all of their program information which was then linked to an ArcView coverage, and the NRCS created a CRP layer linked to attribute data from another Access database. The Nebraska Natural Resources Commission contributed a tremendous amount of time and resources to gather already existing data from their databases and make it available to the Project Leader. The partner agencies worked well together to complete the layers.
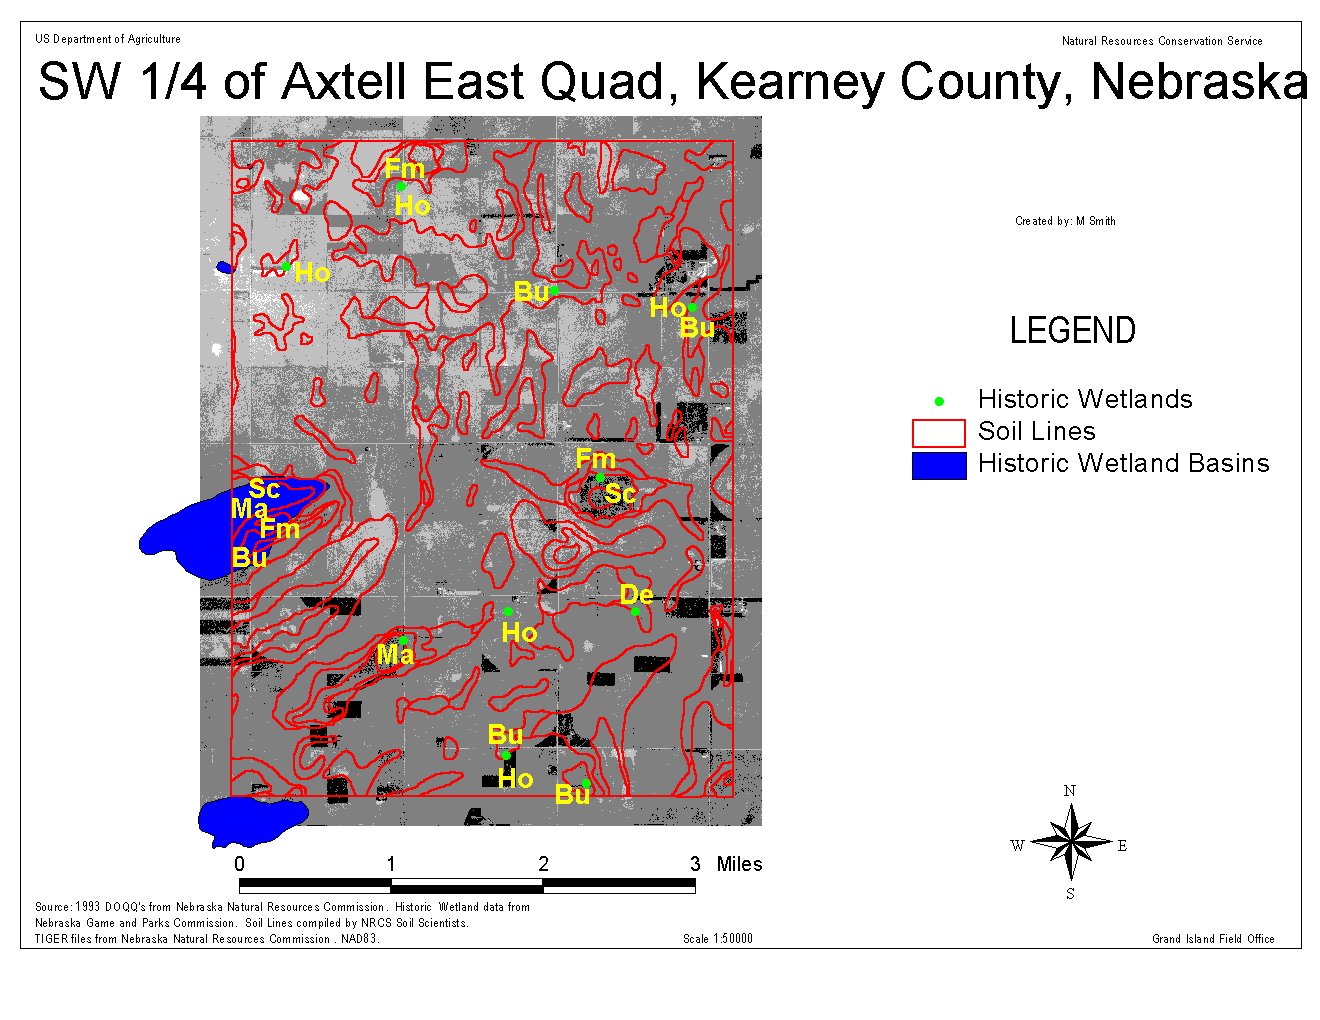
A prototype quarter quad in South Central Nebraska was developed so the demonstration could provide a visual example of the project in order to promote it and solicit volunteer hours from other government agencies. In order to make viewing the layers available to everyone, a media was needed that would only require limited funds. ArcExplorer was chosen as the software of choice to take to the field on laptops.
Using spatial information, historic and current, natural resource managers in the Rainwater Basin can view and analyze resource information to assist them in managing resource decisions efficiently and effectively. An example of this is:
Farmer X is having trouble with irrigation tail water flooding out the lower portion of his cornfield. Farmer Y, three sections away is having trouble maintaining enough water in his re-use pit to make it efficient to run the pump because he has trouble getting the water through his field. Chances are that Farmer X is not aware of Farmer Y's problem and vise versa.
Farmer X comes to a Natural Resources District (NRD) to ask for advice on how to alleviate his problem. The manager or technician can turn on the computer, pull up the elevation contour map layer, the land-use layer, and the quadrangle photo layer of the area in question. The manager can then overlay these maps to decide if it is geographically possible (do the elevation contours lend to moving the water from X to Y) and economically feasible (what type of structures need to be built or do we have existing ditches to utilize, etc.) to get the water from Farmer X's field to Farmer Y's re-use pit. If the project does seem feasible, the technician can then determine the exact length and design options (ditch design, culvert sizes, etc.) of the project using these same map layers of information.
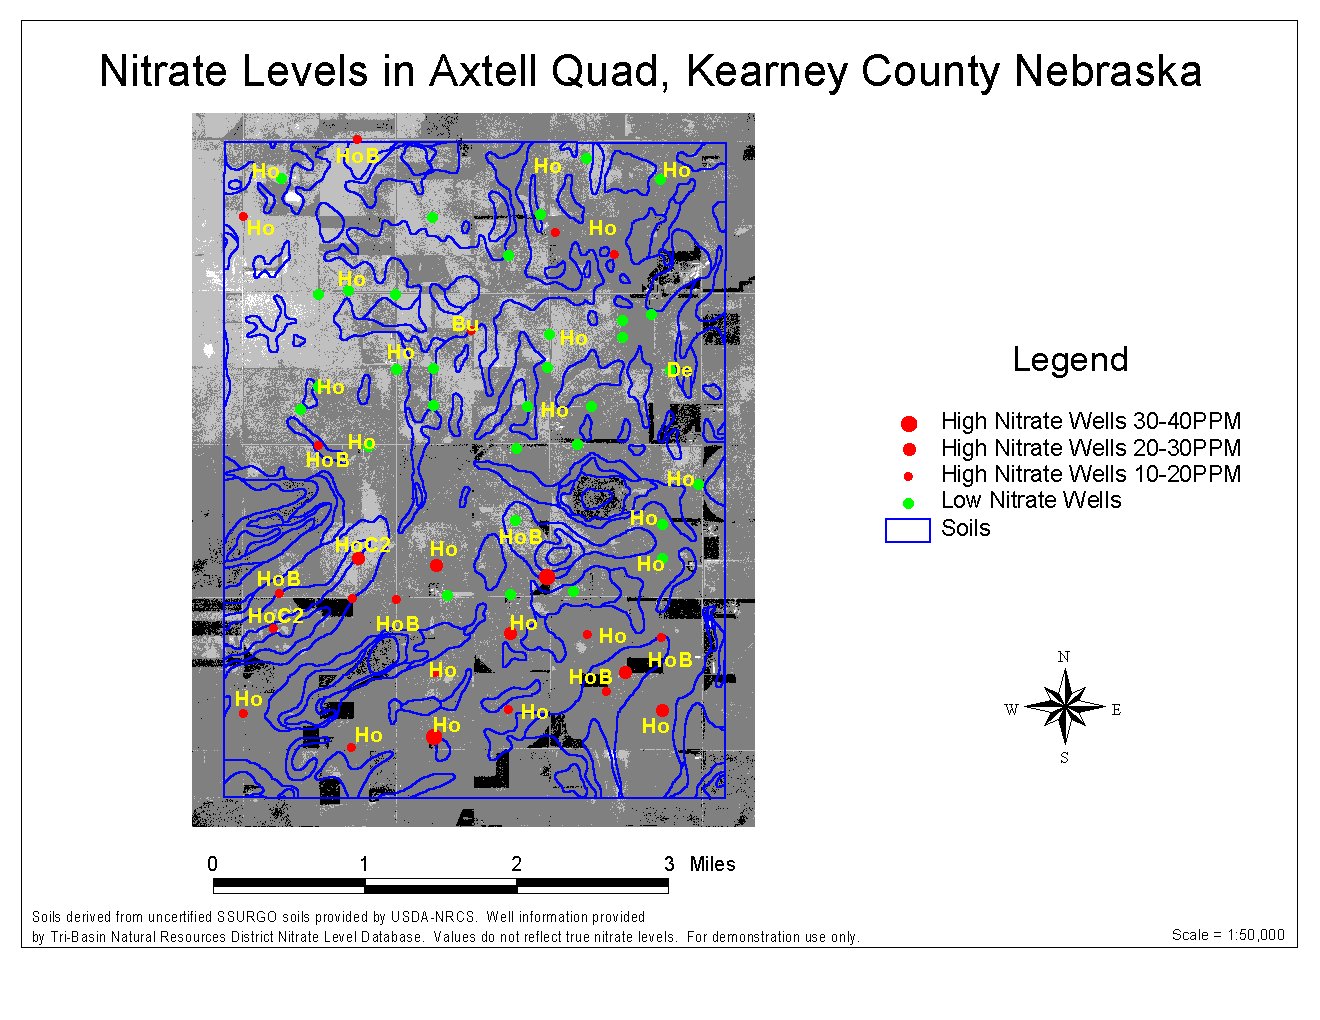
Monitoring nitrate contamination levels in irrigation and domestic wells in the Rainwater Basin has become a high priority of natural resource managers. Using registered well database information, supplied by the Nebraska Department of Water Resources (DWR), and nitrate level information supplied by many Natural Resources Districts, water resource managers can attempt to analyze trends of nitrate levels in specific areas. Spatial information layers such as soil layers, Digital Elevation Models (DEM), well information layers, landuse layers, aerial photos, static water level information, and weather trend information, can assist managers and technicians in directing specific education efforts toward specific geographic areas. Targeting specific high nitrate areas, with different educational needs, may help curtail escalating nitrate accumulation in the groundwater supply.
Many factors affect the concentration of groundwater nitrate levels. These factors include, but are not limited to; soil types and slope characteristics, depth to ground water aquifers, irrigation methods, nitrogen fertilizer use application methods, livestock facility locations and waste dispersal methods, and weather trends data. Using an area that consists primarily of an agricultural based economy, one of many scenarios maybe played out in the following manner.
One duty of an NRD technician is to conduct Nitrogen Certification Training for all crop producers with fields in a Ground Water Quality Management Area (GQMA). Using ArcView or ArcExplorer, the technician decides to look at the nitrate level trends along a certain reach of Platte River. The first layer to bring up in a project would be a Digital Ortho Quarter Quad covering the area of interest. This layer allows the technician to identify the actual features of the area (roads, streams, field boundaries etc.). Next, he/she would bring up the well layer depicting NRD monitor wells and label the wells with the average nitrate levels for the past five and ten year periods. By manipulating the legend symbol, wells with nitrate levels at or below 10 parts per million (PPM) would be given a different symbol than those above 10 PPM. Ten-PPM is the maximum contaminate level (MCL) for a municipal drinking water supply. The intervals created to be displayed would be: 1) 0 - 10 PPM, 2) 10 - 20 PPM, 3) 20 - 30 PPM, and 4) Above 30 ppm. With different symbols representing these intervals, the technician could instantly determine which areas would need to be included in the analysis effort.
The next step would be to overlay a soil layer depicting soil characteristics in the area. This information provides insight to the vulnerability of the soils to leach nitrates into the groundwater table (i.e. is the soil a sandy loam, straight sand, clay loam, etc.). Depth to groundwater would also be critical input to the analysis formula. Groundwater depth information would be extracted from the same well layer, querying a different column in the database describing the past and present static water level readings of these monitor wells. Combining soil characteristics with depth to groundwater information, the technician can determine how long, in general, it takes nitrates to leach into the groundwater supply under different circumstances. Rainfall events, irrigation application amounts, soil characteristics, slope and fertilizer application amounts would all be factors associated with this general determination. The technician has determined the soils of the area are predominately sandy soils and depth to groundwater is less than fifty feet. With this information alone, education emphasis may begin to move toward nitrogen fertilizer application timing as well as irrigation methods and amounts of water used in crop production.
Interagency and interdisciplinary projects like the RWB effort require considerable coordination. The Steering Committee meetings and teleconferences ensure continued focus. Distribution of the work assures a participatory partnership. Continued emphasis on the vision assures continued commitment. However, "time" is the precious commodity in the effort and individuals talents and contributions must be continually monitored so that the project continually moves forward.
ArcExplorer will allow the field technicians to work with maps digitally at the same scale, with the ability of overlaying coverages, zooming into areas, performing queries and easily accessing attribute information. No longer will the technicians need to bring along maps, soils surveys and rulers, nor will they have to account for the differences in scales between the maps. Now they will simply grab their laptop and a CD with digital data corresponding to their area of work. Bringing the natural resources discipline into the technology age will allow for on-site analysis concerning resource management issues.
Software: ArcInfo, ArcView, and Spatial Analyst were used to create the new data layers. ArcInfo was used to re-project existing layers from NAD27 to NAD83. ArcExplorer will be used as a field GIS viewer.
Author Information:
Maggie Smith
GIS Specialist, Grand Island Field Office
United States Department of Agriculture - Natural Resources Conservation Service
2550 North Diers Road, Suite L
Grand Island, Nebraska 68803
(308) 382-0814
msmith@ne.nrcs.usda.gov
Jeff Lucas
GIS Specialist
Tri-Basin Natural Resources District
1308 2nd Street
Holdrege, Nebraska 68949
(308) 995-6688
tribasin@wil-net.com Attn: Jeff Lucas