 Edgematched the individual base map layers. The CAD mapping layers were registered in digitizing units, once imported, the sections were transformed to a real-world coordinate system.
 Implementing a Citywide GIS: Building an Educational Partnership - City of Fort Lauderdale and Florida Atlantic University Experience
Scott Burton, Dr. David Prosperi, Pedro Flores, Vivian Brooks, Kathy Connor, Jay Hutchison, Marc Kurbansade, Chrissy McDermott, Dan O'Connor, Gloria Putiak, and Tracy Zullick
Abstract
In April 1997, the City of Fort Lauderdale approved an innovative partnership between the City and Florida Atlantic University Geographic Information System Laboratory (GIS Lab), housed in the Department of Urban and Regional Planning. The purpose of the partnership is to assist the City in developing an Enterprise GIS (Geographic Information Systems). As an educational partner, Florida Atlantic University has been charged with assisting the City in the following areas: (1) produce GIS implementation action plans for each city department, (2) develop and maintain the Citywide GIS base map, and (3) provide GIS training for city staff. This paper focuses on these implementation tasks from conceptual design to application development, with special emphasis on the partnership between a local government and a state university.
Introduction
Local governments have long known the benefits of using GIS applications. The strategy for many cities is not only to improve productivity but also to collect revenue more efficiently. An implemented GIS forms an important part of the infrastructure of government operations. However, without proactive strategies backed by a cooperative environment, the implementation of an Enterprise GIS will be costly for all involved.
The City of Fort Lauderdale welcomed this challenge by developing an "Educational Partnership" with the GIS Lab. The Department offers several master-level GIS courses where students work on "real-world" projects with public agencies. The GIS Lab is also an educational training center for Esri, which is able to provide technical training to many employees of the city of Fort Lauderdale.
Background
Fort Lauderdale is situated on the southeast coast of Florida. The City shares boundaries with nine other municipalities, as well as unincorporated areas of the County. Encompassing 34 square miles within its corporate limits, the City's population is approximately 163,000. Fort Lauderdale is the seventh largest city in the State and largest municipality in Broward County. The City shares boundaries with nine other municipalities, as well as unincorporated areas of the County.
For many years, a citywide GIS was discussed by the City of Fort Lauderdale. There was a great need to automate, exchange, and integrate geographic data from multiple sources throughout the city. Between 1990 and 1993, the City assembled an ad-hoc committee comprised of city staff from the following departments: Public Services, Engineering and Information Systems Services. The purpose of the committee was to identify potential GIS applications that could be used by various departments. This GIS committee identified 30 potential applications. However, these GIS applications never got off the ground because there was no implementation framework in place.
Building the Educational Partnership - Building the Implementation Framework, Phase One
In 1994, the discussion of a GIS turned into "action" when the City of Fort Lauderdale approached FAU�s GIS Lab. The City's need for an Enterprise-wide GIS created a new cooperative relationship between a local government and a public university. There were several factors that led to the formulation of this partnership:
In the summer of 1995, The City and FAU developed an educational partnership. This challenging partnership entailed the following: (1) a citywide user needs assessment,
(2) development of a seamless GIS base map and (3) the development of a work order management program for Public Services. This was the first phase of the partnership.
During Phase One, the GIS Lab and four graduate students enrolled in the Department conducted a citywide Needs Assessment. The needs assessment utilized two surveys. The first survey was distributed to Department and Division heads. The second survey was provided to the technical staff and contained more detailed questions regarding data flow, work procedures, system design, and user needs.
The purpose of the needs assessment was to identify the framework required to implement an enterprise-wide GIS based upon user needs and functional requirements.
The GIS Lab developed the citywide GIS base map within a nine-month time frame. Using ArcInfo, utilizing ArcTools, and creating several AML Graphical User Interphases for Quality Control and Quality Assurance, the GIS Lab graduate interns completed the following tasks:
Edgematched the individual base map layers. The CAD mapping layers were registered in digitizing units, once imported, the sections were transformed to a real-world coordinate system.
 Developed Two Pilot Projects: To test the many unknowns related to installation, configuration, software development, and work order procedures, the GIS Lab also conducted two pilot projects on behalf of the City. The graduate students developed a zoning notification application using ArcInfo and a routing application using ArcInfo's Network module. The menu interface for base map maintenance, routing, and zoning applications were developed by the graduate student interns, see Figure 1
The first phase of the partnership served several purposes:
1. identified user needs citywide;
2.conceptualized the implementation framework required to build an enterprise GIS; and
3.created a seamless citywide GIS base map.
Enhancing the Educational Partnership - Implementing the Enterprise GIS Phase Two
In April 1997, the City of Fort Lauderdale approved the continuation of the partnership between the City and FAU's GIS Lab. The purpose of the partnership was to assist the City in developing an enterprise GIS. As an educational partner, the FAU GIS Lab accepted the responsibility of assisting the City in the following areas:
Implementation planning and management, developing the digital map library for the City, and training of staff were the primary elements to implement a functional citywide GIS.
GIS Implementation Action Plans
The purpose of the Department�s GIS Implementation Action Plan was to narrow the conceptual applications identified in the Citywide GIS Needs Assessment Final Report (1995-1996) to a more focused strategy of implementing GIS applications in each division. Although there was a need to share information and databases among different departments, each department has its own specific functions, ranging from crime analysis to issuing permits to prove water services. To address the specific needs of each division within the City, a series of workshops were held for each department.
The next phase of the project was to assist each department with their GIS implementation efforts based upon a participatory framework developed by FAU. The participatory model for deploying the Citywide GIS consists of representation from each department that will use or support GIS activities. The participatory model is defined below:
Citywide GIS Implementation Framework
In order to narrow the conceptual implementation framework identified in the Citywide GIS Needs Assessment to a more well-defined set of implementation tasks, a series of workshops were arranged for each department.
This format allows all stakeholders to organize and agree on what they will be responsible for and how they will do it.
The FAU GIS Lab served as the facilitator throughout the process and was responisble for the coordination of approximately 30 GIS workshops for the departments scheduled up to September 1998, see Table 1.
Table 1. Timeframe for Departmental GIS Workshops - April 1997 - September 1998
|
|
APR |
MAY |
JUN |
JUL |
AUG |
SEPT |
OCT |
NOV |
DEC |
JAN |
FEB |
MAR |
APR |
MAY |
JUN |
JUL |
AUG |
SEPT |
|
Police |
|
|
|
|
|
|
|
|
|
|
|
|
|
|
|
|
|
|
|
Fire-Rescue |
|
|
|
|
|
|
|
|
|
|
|
|
|
|
|
|
|
|
|
Public Services |
|
|
|
|
|
|
|
|
|
|
|
|
|
|
|
|
|
|
|
Administrative Services |
|
|
|
|
|
|
|
|
|
|
|
|
|
|
|
|
|
|
|
Planning & Econ. Devt |
|
|
|
|
|
|
|
|
|
|
|
|
|
|
|
|
|
|
|
Parks and Recreation |
|
|
|
|
|
|
|
|
|
|
|
|
|
|
|
|
|
|
|
Commissioners |
|
|
|
|
|
|
|
|
|
|
|
|
|
|
|
|
|
|
|
Finance |
|
|
|
|
|
|
|
|
|
|
|
|
|
|
|
|
|
|
|
City Attorney/City Mgr. |
|
|
|
|
|
|
|
|
|
|
|
|
|
|
|
|
|
|
|
|
|
|
|
|
|
|
Legend |
|
|
|
|
|
|
|
||||
|
|
|
|
|
|
|
|
|
Kickoff |
|
|
|
|
|
|
|
|||
|
|
|
|
|
|
|
|
|
Workshop 2 |
|
|
|
|
|
|
|
|||
|
|
|
|
|
|
|
|
|
Workshop 3 |
|
|
|
|
|
|
|
|||
|
|
|
|
|
|
|
|
|
Workshop 4 |
|
|
|
|
|
|
|
|||
|
|
|
|
|
|
|
|
|
Implementation Plan |
|
|
|
|
|
|
|
|||
The workshops promoted a collaborative approach that allowed participants to work with rather than against one another. The workshops represent the collective interests of each division in the department. The workshop format is described below:
The participants at this GIS workshop were all departments in the City that participated in the implementation plan. Each TRC member had to identify the stakeholders in their divisions and invite them to attend this workshop. The FAU GIS Lab presented applications that were being utilized by other cities, applications that were being utilized by department, and asked the participants to identify potential GIS applications in their department/division.
During the workshop, participants were divided into groups that represented their department. The participants were given an implementation questionnaire that required them to complete a mapping and database inventory and to identify potential GIS applications that were considered to be a revenue-generating and/or productivity-enhancing.
The FAU GIS Lab summarized the results from the implementation questionnaire and presented them to the Workshop participants. During this process, the participants prioritized the GIS applications, determined the data requirements for processing the GIS applications, and reviewed how these applications would be integrated into the organizational structure.
The Workshop members were provided a second questionnaire that required them to provide information regarding the GIS applications they identified, a listing of data requirements for implementation, and a detailed data flow showing the current infomation processing procedure . The participants had between 1-2 weeks to complete this questionnaire
The FAU GIS Lab organized the workshop and provided technical expertise in the field of GIS application development. The FAU GIS Lab also developed the questionnaire, tabulated the results, and presented them at the next GIS Workshop
The FAU GIS Lab prioritized the GIS applications identified during the second GIS Workshop. The prioritization was based upon the following criteria: (1) revenue-generating and/or productivity-enhancing applications, (2) data requirements, (3) applications meeting short-term/long-term project objectives, (4) benchmarking manual procedures vs. automated procedures, (5) the degree of reengineering data flow procedures, and (6) system design requirements (hardware, software, personnel), and potential funding sources.
Once the applications had been identified the participants will complete a third questionnaire that addressed the existing data flow procedures (manual process) and benchmarked the time period to complete the tasks that are designated for future GIS applications (automated process).
The FAU GIS Lab compiled all of the information collected by the project teams and presented a draft document for final approval by the project team.
The implementation plans : (1) outlined the functionality of divisions participating in this effort; (2) identified software/hardware/data requirements; (3) outlined existing information flow procedures; (4) outlined new data flow and policy procedures; (5) prioritized applications; and (6) established a timetable for implementation of prioritized applications.
Status of the Implementation of the Citywide GIS
The GIS applications identified by most departments cannot be placed in operation simultaneously. A small number of applications were chosen initially for each department. The GIS Implementation Action Plans were based on a "phased" approach in which applications were developed incrementally dependingon the intensity of need. This gave departments the opportunity to focus on the following implementation and management issues:
Since April 1997, several departments have moved forward in implementing their GIS activities. This section provides a summary of implementation activities for (1) Police, (2) Fire-Rescue, and (3) Public Services.
All three departments have developed a "self-directed" GIS Team to oversee the implementation of GIS activities within the Department. A "self-directed" team is a group of employees brought together to focus on a particular task, project or problem. This concept has been utilized by such organizations as the Palm Beach County GIS Implementation Team.1 The Team was given clearly defined responsibilities and authority to plan, implement, control and resolve issues related to GIS projects. Several minds working together creates the potential of increasing productivity and efficiency, thus reducing operating costs.
Phase One: Initial GIS Application Identification
Police
Applying the phased approach toward application development, the GIS Department Action Plan recommendation for Phase One was to develop or utilize a user-friendly mapping program that would automate incident mapping, analyze trends, provide more sophisticated analysis capabilities, and generate maps and reports for internal and external consumption in a timely manner.
Based upon the user needs and recommendations set forth by the GIS Department Team, the Police Department acquired CrimeView™ as their official geographic analysis product tailored specifically to incident reporting and crime analysis.
CrimeView™ acts as a suite of integrated crime analysis tools designed for use in object-oriented ArcView™ GIS™ 3.0x environment operating under Microsoft Windows NT™. This software package facilitates the accomplishments of both simple and more complex crime analysis, including mapping, and reporting tasks under a common interface.
The primary reason for this recommendation was based upon the cost savings associated with automating the process of incident mapping. The following presents a cost-benefit assessment comparing the existing method of plotting incidents versus automating incident mapping.
Prior to GIS, the Crime Analysis Unit (CAU) manually plotted incident maps of major crime types. The task of manually plotting incidents was divided into three police districts. There were three CAU analysts who were each assigned a district. Due to the time requirements to manually plot incidents, the CAU only plots major types of crime by police district.
The time required to manually plot major offenses for three (3) districts per day was 9 hours. There are 240 working days per year (48 weeks), thus the total hours per year to manually plot major offenses for all districts was 2,160 hours. Table 2 depicts the annual costs associated with manually plotting major offenses.
Table 2. Annual Costs Associated with Manually Plotting
Major Offenses
|
Total hours per year |
Hourly rate |
Total Cost |
|
2160 |
$15.00 |
$32,400.00 |
|
Based upon Workshop responses and follow-up interviews with the Crime Analyis Unit |
||
Utilizing ArcView™ and CrimeView™, the average time required to plot the same number of incidents is described in Table3 .
Table3 . Automating the Plotting Process: Time Requirements
|
Task |
Time Frame |
|
Import Data from RMS |
20 minutes |
|
CrimeView™/ArcView™ Geocoding for all three districts |
40 minutes |
|
TOTAL |
60 Minutes |
Table4 depicts the automation costs associated with manually plotting the same number of incidents for all three (3) districts per year.
Table4 Annual Costs Associated with Automated Plotting of Major Offense Incidents
|
Automate Plotting of Major Offenses |
||
|
Total hours per year |
Hourly rate |
Total Cost |
|
240 |
$15 |
$ 3,600.00 |
|
Based upon Workshop responses and follow-up interviews with the Crime Analysis Unit |
||
 Figure below compares the existing costs of manually plotting versus automating this process. Based upon the cost comparisons, the direct benefits derived is an annual cost savings of approximately $28,800 dollars per year.
Other benefits derived through the use of CrimeView™ and ArcView™ include:
Police Application Development: Phase One
The Fort Lauderdale Crime Analysis Unit has seen substantial benefits from implementing a GIS. Whereas a few months ago, the department could only manually track business and residential robberies, vehicle theft, and burglaries, they can now plot any crime for any time frame within a short period of time. Crime analysis using a GIS is much more extensive and feasible now than the tedious limited manual process.
One of the most useful applications has been the ability to visually display problem areas to show crime trends and concentrations by locale, shift, and type. This in turn has assisted in patrol planning and resource allocation. Another application involves locating auto theft on a map based upon auto recoveries. This has allowed the department to target patterns of organized crime. As a long term application, the department can locate and track sexual predators by name and residence to ensure their whereabouts when a sexual offense occurs, aiding the police in their investigation.
Implementing a GIS within the department has also allowed data sharing capabilities between the city departments and other external agencies. By plotting traffic accidents, the Crime Analysis Unit has identified areas of concern that the Transportation Division can address. A Buffer Application developed for the Planning and Economic Development Department is also being used in the Police Department to locate incidents within 300 feet of convenience stores and assess whether or not convenience stores or grocery stores generate more criminal activity.
A Buffer Application developed for the Planning and Economic Development Department is also being used in the Police Department to locate incidents within 300 feet of convenience stores and assess whether or not convenience stores or grocery stores  generate more criminal activity.
 Another application involved the analysis of an unsolved homicide occurring in Palm Beach County. A prostitute, murdered in Palm Beach County, had been apprehended several times in Fort Lauderdale. Palm Beach County officials approached the Fort Lauderdale Crime Analysis Unit for assistance in learning more about the woman to target possible suspects. Cataloged sex offences and vehicular theft near her previous known locations were geographically sited and analyzed. This has allowed analysts to better understand the circumstances surrounding the woman�s disappearance and murder. The Police Department is also making progress toward sharing data with Broward Sheriffs Office in an effort to locate problems and crime in proximity between the city's jurisdiction and the county's jurisdiction. ArcView™ is the common denominator while data standardization is the key to successful integration.
Fire-Rescue and Building
This department is comprised of both Fire-Rescue and Building Inspections. The mission of this department is to reduce the risk to life, property, and the environment that the community faces through emergency response, inspections, and construction services. Working together, the Fire-Rescue and Building GIS Team are developing incident mapping applications. Using ENCOMPASS, the citywide land record database containing property-related information and Fire-Rescue's Inspection Database, the two divisions are using GIS to plot the following incidents:
Building upon this application, the Fire Inspection is working with ArcView™ to analyze and display all repeat violators who had faced criminal prosecution as a result of their excessive code violations.
Public Services
Public Services is the largest of all the departments. It is comprised of 56 divisions including: Customer Services, Water and Wastewater, Environmental resources, Engineering Distribution and Collection, Treatment, Maintenance, and Solid Waste.
According to the Public Service GIS Department Team, the single most critical need is to convert Water and Wastewater Infrastructure into digital format designed not just to view digitized maps, but to help manage and follow the day-to-day operations of the city's water, sewer, and customer service needs.
The recommendation of the GIS Department Team is to develop an Enterprise Water and Wastewater Infrastructure Management system that interfaces HANSEN (their future IMS) with GIS. This IMS/GIS must be user-friendly, allowing Public Services staff to access, to query, to display, and to update critical information on a timely basis.
Public Services Department is currently moving in that direction by creating the framework for a comprehensive utility information management. Public Services Department is reengineering their information management system by phasing out their existing work order program with HANSEN IMS.
In August 1997, Public Services Department personnel went through an extensive HANSEN training program. The installation and use of HANSEN will begin in phases. First, Customer Services will utilize HANSEN IMS for processing work orders and tracking customer complaints. HANSEN 's Work Order capabilities offer a unique array of data entry, costing, scheduling, tracking, condition assessment, analysis, and work completion features. Second, HANSEN 's Customer Service capabilities are designed specifically to manage incoming calls from customers and citizens having utility service problems. Some typical service problems and requests are low water pressure, no power, sewer backups, sewer overflows, abandoned vehicles, no water, missed garbage pickups, high utility bills, and general information requests.
Eventually HANSEN will be incorporated by all the divisions in Public Services. Public Services administrators foresee using HANSEN for implementing performance-based criteria in the area of customer satisfaction, service response time, job costing, crew productivity, and resource management.
The long-term objective is to interface HANSEN 's IMS with GIS. In contrast to many GIS projects that simply wish to automate maps, Public Services is looking to interface HANSEN 's IMS with GIS to perform a number of specific work management applications: (1) work order management, (2) customer service, (3) job costing, (4) field inspection, and 5) map production.
If You Build It They Will Come
As GIS implementation efforts evolve, so too does the need to share data among different departments. Part of the implementation of the citywide GIS has been the development of the digital map library. Using ArcInfo's LIBRARIAN™, the FAU GIS Lab has been creating a map library partition by section and stratified by theme. The FAU GIS Lab graduate research assistants and the citywide GIS Coordinator are conducting the Quality Control and Quality Assurance. Once the section tiles are verified, they are indexed and stored on the City's Window NT Server where various departments have network access to the spatial information. Additionally, the spatial data has been linked to ENCOMPASS utilizing ODBC compliant drivers.
Additionally, FAU has developed the citywide parcel map and a series of special overlay zones for Planning and Economic Development, Fire-Rescue and Building, and Public Services.
The Citywide GIS Data Exchange Protocol
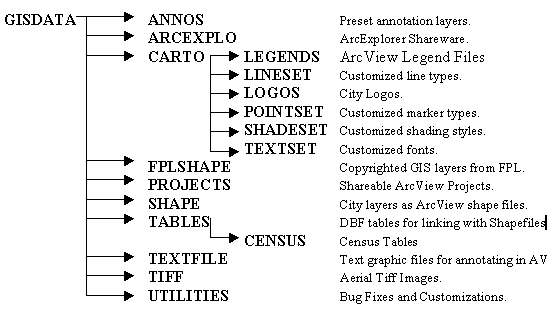
Annotations (ANNOS Directory)
The Annotations directory includes two (2) ArcInfo coverages to be used with ArcView™ for placing text in maps. Shape files cannot manipulate annotation files; therefore, these layers are being maintained as ArcInfo coverages. CITYANNO and BCANNO have a predefined text size; therefore, the user cannot change the size of the text from ArcView™ .
ArcExplorer (ARCEXPLO Directory)
ArcExplorer is free shareware from Esri to view GIS data, including ArcInfo coverages, ArcView™ shape files, and images. In addition, it allows the user to view GIS data on a network and on the Internet (if the user�s PC is "Internet enabled"). This product is limited in its query capabilities and its ability to produce outputs plots.
Cartographic Tools (CARTO Directory)
This directory contains tools to help improve the quality of maps.
FPLSHAPE (Copyrighted ArcView™ Shape files)
Table 5 is a list of GIS layers that Florida Power and Light (FP&L) provided for the City of Fort Lauderdale. All of these layers are in State Plane, NAD83. These layers are protected by copyright laws. City employees are allowed to use this data for any City related work. Vendors and Outside Consultants are not allowed access to this data without prior approval from FP&L and the City-wide GIS Coordinator. Providing this data in digital form to anyone who is not a City of Fort Lauderdale employee would severely violate the City of Fort Lauderdale�s license agreement with FP& L.
 Paper map products that in anyway display this data can be provided freely to public but they must contain reference to the following disclaimer in a clear and unobstructed area of the map:
|
FILE |
TOPOLOGY |
DESCRIPTION |
|
Fplwater |
Polygons |
Planimetric Layer showing bodies of Water. This layer was derived from aerial photography shot in 1995. It is more spatially accurate than the Cartographic layer WATER in the SHAPE directory. |
|
Largebuild |
Polygons |
Planimetric Layer showing Large Building footprints derived from 1995 aerial photography. It contains an attribute that provides height information for some building. |
|
Lotblock |
Polygons |
Shows Lot and Block information as it was platted. This layer does not show Lot Ownership (Parcels). The Attribute information includes the LOT and Block Number. |
|
Pavement |
Lines |
Planimetric Layer showing the edge of pavement derived from 1995 aerial photography. |
|
Pavementcl |
Lines |
The Center Line of the Pavement derived from calculating the midpoint from the layer "Pavement". |
|
Propaddress |
Points |
A point layer to be used in ARCVIEW™ for address matching to the parcel centroid in the City of Fort Lauderdale. Addresses in a Condominium association are matched to the centroid of the common area. |
|
Property |
Polygons |
Property Ownership (parcels). The attribute information contains Owner name, parcel address and Owner�s mailing address. |
|
Propparcel |
Points |
A Point layer used to Geocode 10-digit parcel_id (folio numbers). |
|
PropPoint |
Points |
A Point layer containing multiple points per parcel showing different business addresses in the same parcel and all units in a condominium association. The attribute information contains Owner name, parcel address and Owner�s mailing address. |
|
Railroads |
Lines |
Planimetric layer showing railroad lines, including spurs. This layer was derived from 1995 aerial photography. |
|
Smallbuild |
Points |
Planimetric Layer showing small building locations. |
|
Subdivision |
Polygons |
Subdivision Plats. The attribute information includes the Subdivision Name and the Plat Book and Page number. |
Table 5.
Shape (ArcView™ Shape files)
Table 6 is a list of GIS layers that have been compiled from various sources. All of these layers are located in NAD83. All of the Shape files contained in this directory are public domain and can be used and distributed freely to the public.
|
FILE |
SOURCE |
TOPOLOGY |
DESCRIPTION |
|
Bankline |
Engineering |
Lines |
The Canal Banklines in the City of Fort Lauderdale |
|
Bcbound |
Broward |
Polygons |
The political boundary of Broward County |
|
Bccomdis |
Broward |
Polygons |
The district boundaries for Broward County Board of County Commissioners |
|
BchCRA |
PED |
Polygons |
Fort Lauderdale Beach Community Redevelopment Area |
|
Bcmunic |
Broward |
Polygons |
The political boundaries of the cities within the county |
|
Bcstreet |
Broward |
Lines |
The digital street map with address ranges for Broward County |
|
Censusbg |
Broward |
Polygons |
The boundaries of the US census block groups for Broward County |
|
Censustr |
Broward |
Polygons |
The boundaries of the US census tracts for Broward County |
|
Cityhalls |
Broward |
Points |
The locations of city halls for cities in Broward County |
|
Citypark |
Broward |
Polygons |
The location and names of city-owned parks in Broward County |
|
Cntypark |
Broward |
Polygons |
The location and names of county-owned parks in Broward County |
|
Colleges |
Broward |
Points |
The location of local, state and private colleges within Broward County |
|
Commission |
IS |
Polygons |
The Commission Districts for the City of Fort Lauderdale. |
|
Corplim |
Engineering |
Polygons |
The corporate limits of the City of Fort Lauderdale |
|
DDA |
PED |
Polygons |
Downtown Development Board Area |
|
Easeline |
Engineering |
Lines |
Easement Lines |
|
Femaflod |
Broward |
Polygons |
FEMA flood areas and categories |
|
Femapanl |
Broward |
Polygons |
FEMA flood panels |
|
Firedist |
FRB |
Polygons |
The Fires Districts for the City of Fort Lauderdale Fire Department. |
|
Flstreet |
IS/GIS |
Lines |
The Street Network for the City of Fort lauderdale and the immediate area around the city. |
|
Fzonebuf |
IS |
Polygons |
A 50 feet error buffer to be used with FEMAFLOD |
|
GAarea |
PED |
Polygons |
City of Fort Lauderdale General Aviation Area |
|
Highways |
IS |
Lines |
Main Highways in the City of Fort Lauderdale |
|
Hospital |
Broward |
Points |
The location of hospitals in Broward County |
|
Library |
Broward |
Points |
The location of Broward County libraries |
|
Lotline |
Engineering |
Lines |
The interior Lot lines in the City of Fort Lauderdale |
|
Majorst |
Broward |
Lines |
The major streets in Broward County |
|
Navspeed |
PED |
Polygons |
The Navigation Speed Areas in the City of Fort Lauderdale. |
|
Neighood |
Planning |
Polygons |
The neighborhood civic associations for City of Fort Lauderdale |
|
Nwneigh |
PED |
Polygon |
NW Neighborhood Improvement Area in the City of Fort Lauderdale. |
|
Nwra |
PED |
Polygon |
NW Redevelopment area in the City of Fort Lauderdale. |
|
Parks |
Parks & Rec |
Polygons |
City of Fort Lauderdale Parks |
|
Police |
Police |
Polygons |
The Fort Lauderdale Police Department reporting areas, zones and districts |
|
Pssewer |
PS |
Polygons |
The Areas in and outside the City of Fort Lauderdale where Public Services provide sewer services. |
|
Pswater |
PS |
Polygons |
The Areas in and outisde the City of Fort Lauderdale where Public Servises provides Water services. |
|
Rowfees |
AS |
Polygons |
The different Areas associated with fees charged to telecommunication companies for occupying the right of way of the city. |
|
Rowline |
Engineering |
Lines |
The right of way lines (block lines) for city of Fort Lauderdale |
|
Schools |
Broward |
Points |
all levels of public and private schools in the county |
|
Sectgrid |
Broward |
Polygons |
The section lines for Broward County |
|
Statpark |
Broward |
Polygons |
State Parks in Broward County |
|
Taz |
Broward |
Polygons |
The traffic analysis zones used for planning purposes |
|
Tsignals |
Broward |
Points |
The map of signalized intersections in Broward County |
|
Water |
Broward |
Polygons |
All Bodies of Water in Broward County |
|
Zipcodes |
Broward |
Polygons |
The US. Postal zip code boundaries for Broward County |
|
Zones |
Planning |
Polygons |
The new zoning categories for the City of Fort Lauderdale |
Table 6
Lookup Tables (TABLES Directory)
This directory contains tables that can be linked with GIS Shape Files to enhance query tools. Tables included are:
|
Building.dbf |
Parced Addresses from the Encompass address standard file. |
|
Business.dbf |
Registered Fort Lauderdale Businesses |
|
Busowner.dbf |
Detail of City of Fort Lauderdale Business Owners who have applied for Occupational Licenses. |
|
License.dbf |
Detail of City of Fort Lauderdale occupational licenses. |
|
Property.DBF |
Pacel detail file from Encompass. |
Table 7
There is a Subdirectory Called Census which is links up with the CENSUSBG, CENSUSTR, and TAZ GIS layers. Contains Census information. At the present time, it only contains the Census DATA from Broward County�s Planning department and is located in a directory called BCPLANNING. This Directory is further Broken up into 3 subdirectories, BLOCKGROUP, TRACT, and TAZ.
Content of GISDATA/TABLES/CENSUS/BCPLANNING/BLOCKGROUP
DU_BG.DBF 1990 Census Dwelling Units, by Type, by Block Group
INCPOVBG.DBF 1990 Census Income and Poverty Characteristic, Census Block Group
INDUSTBG.DBF 1990 Census Resident Employment by Industry, by Block Group
JOB_BG.DBF 1990 Census Resident Employment by Occupation, by Block Group
OWN_BG.DBF 1990 Census Value of Specified Owner Occupied Units, by Block Group
POP_BG.DBF 1990 Census Population Characteristics, By Block Group
RENT_BG.DBF 1990 Census Rent for Specified Renter Occupied Units, by Block Group
Content of GISDATA/TABLES/CENSUS/BCPLANNING/TRACT
DU_CT.DBF 1990 Census Dwelling Units, by Type, by Census Tract
FC_DU_CT.DBF Dwelling Unit Forecasts, 1995 - 2020, by Census Tract
FC_PP_CT.DBF Population Forecasts, 1995 - 2020, by Census Tract
HUI_CT.DBF Dwelling Units by Type (4/1/85, 4/1/90, 4/1/95, and 4/1/96) by Census Tract
INCPOVCT.DBF 1990 Census Income and Poverty Characteristic, Census Tract
INDUSTCT.DBF 1990 Census Resident Employment by Industry, by Census Tract
JOB_CT.DBF 1990 Census Resident Employment by Occupation, by Census Tract
OWN_CT.DBF 1990 Census Value of Specified Owner Occupied Units, by Census Tract
POP_CT.DBF 1990 Census Population Characteristics, by Census Tract
RENT_CT.DBF 1990 Census Rent for Specified Renter Occupied Units, by Census Tract
Content of GISDATA/TABLES/CENSUS/BCPLANNING/TAZ
DU_TAZ.DBF 1990 Census Dwelling Units, by Type, by Traffic Analysis Zone
FC_DU_TZ.DBF Dwelling Unit Forecasts, 1995 - 2020, by Traffic Analysis Zone
FC_PP_TZ.DBF Population Forecasts, 1995 - 2020, by Traffic Analysis Zone
HUI_TAZ.DBF Dwelling Units by Type (4/1/85, 4/1/90, 4/1/95, and 4/1/96)by Traffic Analysis Zone
OWN_TAZ.DBF 1990 Census Value of Specified Owner Occupied Units, by Traffic Analysis Zone
POP_TAZ.DBF 1990 Census Population Characteristics, By Traffic Analysis Zone
RENT_TAZ.DBF 1990 Census rent for Specified Renter Occupied Units, by Traffic Analysis Zone
Graphic Textfiles (TEXTFILE Directory )
The files contained in this directory provide ArcView™ uses with an alternative way to annotate their Views without having to use ArcInfo annotations. They include:
|
associations.odb |
Home owner associations for the City of Fort Lauderdale. |
|
blockno.odb |
Block Numbers |
|
censustracts.odb |
Census Tract Numbers |
|
citynames.odb |
Names of all Municipalities in Broward County. |
|
majorstreets.odb |
Major Streets. |
|
majorstreetlg.odb |
Major Street at a slightly larger font. |
|
statepark.odb |
State of Florida Area Parks. |
|
supertaz.odb |
Super Traffic Analysis Zones. |
|
taz.odb |
Traffic Analysis Zones |
|
zipcodes.odb |
Zipcodes |
|
zones.odb |
Zoning Categories |
 Table 8
Aerial Images (TIFF Directory)
Currently, the City of Fort Lauderdale has archives of digital aerial photography in selected areas. Figure# shows the extent of aerial coverage.
Figure 2
This aerial photography is grayscale photography provided by the Broward County Planning Department and the State of Florida Department of Transportation. It should be noted that it is scanned from a second generation aerial photograph and while it is registered to the NAD83 State plane Coordinate System, it is not Ortho-photography and contains some edge-matching errors.
Citywide GIS: Funding Procedures and Guidelines
The GIS CIP fund was approved by the City Commission as a five-year project to develop a Citywide GIS infrastructure and promote GIS development within the City of Fort Lauderdale. The project includes $3,000,000 for GIS development during these 5-years, appropriating $1,200,000 at phases I and II, and $600,000 at phase III. Table 8 provides the original budget schedule.
|
Phase I |
Phase II |
Phase III |
|||
|
Year 1 |
Year 2 |
Year 3 |
Year 4 |
Year 5 |
|
|
Description |
96-97 |
97-98 |
98-99 |
99-00 |
00-01 |
|
Personnel |
75,000 |
78,000 |
80,000 |
82,000 |
85,000 |
|
Implementation Plan |
50,000 |
25,000 |
0 |
0 |
0 |
|
FPL Acquisition |
150,000 |
0 |
0 |
0 |
0 |
|
Base Map Management |
100,000 |
100,000 |
110,000 |
128,000 |
130,000 |
|
GPS Services |
120,000 |
250,000 |
200,000 |
240,000 |
200,000 |
|
Citywide Applications |
0 |
57,000 |
100,000 |
70,000 |
60,000 |
|
Hardware |
45,000 |
30,000 |
50,000 |
20,000 |
65,000 |
|
Software |
45,000 |
45,000 |
45,000 |
45,000 |
45,000 |
|
Training |
15,000 |
15,000 |
15,000 |
15,000 |
15,000 |
|
Annual Total |
$600,000 |
$600,000 |
$600,000 |
$600,000 |
$600,000 |
Table 8
This Document will explain all of these items, provide a status of where we stand, and will provide the standards and procedures on how the City will spend this fund.
Personnel:
This item covers the salary and benefit package for the position of Citywide GIS Coordinator. This position was approved by the City Commission on 4/6/97, and was filled on 07/28/97. The Citywide GIS Coordinator oversees all GIS activities in the City, works with all GIS users in technical and managerial matters, and coordinates GIS tasks between the City and FAU.
Implementation Plan:
The City of Fort Lauderdale has contracted with FAU to develop an action plan for each department in the City. This action plan details the GIS needs of each department and provides direction on how to proceed with GIS implementation for the department.
Base Map management:
The City of Fort Lauderdale has contracted with Florida Atlantic University to have FAU develop and maintain a citywide library of GIS layers. The total cost of this project for the first phase is $200,000 being paid in quarterly installments. This project includes several large task including:
GPS Services:
In order to develop an accurate layer of facilities such as water lines, fire hydrants, sewer lines, etc., it was necessary to contract a reputable firm that has experience using Global Positioning System (GPS) technology to inventory such facilities for the implementation of a Facilities Management (FM) GIS.
Citywide Applications:
There was a need to develop applications that will not be specific to any particular department, yet will benefit all departments. These applications consist mostly of data queries and address tasks such as:
Hardware:
This item covers all hardware costs associated with the implementation of a citywide GIS. These include servers, network components, and peripherals. This item does not cover hardware needs that are specific to a particular department.
Software:
This items covers all software costs associated with the implementation of a citywide GIS. These include a full ArcInfo and ARCVIEW™ license for the Citywide GIS Coordinator. Future GIS software needs will possibly include internet Mapping Software such a Map Objects and Spatial Database Engine.
Training:
The City of Fort Lauderdale contracted Florida Atlantic University to provide basic GIS training to City staff. The total cost of this contract was $30,000 for Phase I, paid in quarterly installments from the CIP fund. More specialized training was necessary for some users.
Budget:
According to Table , a total of $150,000 was originally reserved for the acquisition of FP&L Parcel Base Layer for the City of Fort Lauderdale. Information Systems was able to negotiate free delivery of this data. In addition, a late start in FY96-97 limited the amount of money that was spent on the other items. The late start freed up a substantial amount of money that was used by the departments for departmental GIS expenditures. Table shows a revision of the items where a substantial amount of money was assigned to help departments develop GIS applications. This money was used as seed money for each department to spend on GIS-specific tasks. According to Table , $342,000 was available for application development for department specific applications. In order to avoid the misuse of these fund and to encourage buy-in from all departments, some rules needed to be established for the use of the fund.
|
Phase I |
Phase II |
Phase III |
|||
|
Year 1 |
Year 2 |
Year 3 |
Year 4 |
Year 5 |
|
|
Description |
96-97 |
97-98 |
98-99 |
99-00 |
00-01 |
|
Personnel |
75,000 |
78,000 |
80,000 |
82,000 |
85,000 |
|
Implementation Plan |
17,000 |
58,000 |
0 |
0 |
0 |
|
FPL Acquisition |
0 |
0 |
0 |
0 |
0 |
|
Base Map Management |
18,045 |
115,955 |
110,000 |
110,000 |
110,000 |
|
GPS Services |
0 |
250,000 |
240,000 |
270,000 |
250,000 |
|
Citywide Applications |
0 |
60,000 |
60,000 |
40,000 |
40,000 |
|
Hardware/Supplies |
15,000 |
50,000 |
50,000 |
34,000 |
44,000 |
|
Software |
20,000 |
50,000 |
35,000 |
39,000 |
39,000 |
|
Training |
0 |
51,000 |
25,000 |
25,000 |
32,000 |
|
Departmental Applications |
0 |
171,000 |
171,000 |
0 |
0 |
|
Annual Total |
145,045 |
883,955 |
771,000 |
600,000 |
600,000 |
Table 10
Rules Governing GIS/CIP Department:
Any exemptions to the following rules had to be approved by the GIS Executive Review Committee on an individual basis.
GPS SERVICES:
Hardware:
Software:
Training:
Departmental Applications
Conclusion
As departments complete their GIS Action Plans and have acquired the Esri products for installation on their systems, FAU and Esri have continued to provide training. FAU has been providing ArcView™ training at the GIS Lab. The GIS Lab is also an official Esri Training Center, city staff has the opportunity to take Esri courses offered at the FAU campus.
The GIS Action Plans serve as the guiding force in terms of implementing a GIS within the department's divisions. The GIS applications identified by the GIS Department Team cannot be placed in operation simultaneously. The timing for developing applications are based on the need of the users, system design requirements, and financial feasibility.
All implementation activities are carefully reviewed by the GIS Department Team, GIS Executive Review Committee, and the Citywide GIS Coordinator. The GIS Department Team (the Team)is a "self-directed" team who identify user needs, assess implementation requirements, and seek funding through the department. The GIS Executive Review Committee serves as the oversight committee of all implementation activities occurring citywide. They must give the Team the authority necessary to make decisions. The City GIS Coordinator's responsibility will be to assist, to monitor, and to evaluate the Team's performance.
No matter how carefully the implementation planning has been completed,even with a solid commitment towards implementation, some changes will always be required. It is important to understand that the Action Plans are a living thing. Once implementation begins, end users and technical staff will identify new opportunities and modifications to applications in progress or already implemented. Thus, Action Plans must be flexible for any reengineering of applications or system design that may occur.
Scott Burton
Director / Adjunct Faculty
GIS Lab
Department of Urban and Regional Planning
College of Architecture, Urban and Public Affairs
Florida Atlantic University
220 SE 2nd Ave, Room 728
Fort Lauderdale, Florida 33301
Email: s_burton@fau.edu
Telephone: 954-762-5646