REAL TIME DATA & ANALYSIS (50 pts)
PART I -- EARTHQUAKE DATA -- DISCRETE DATA
Earthquake data is descrete data or values that represent phenomena
in categories. With discrete data it's easy to define precisely where an object begins and ends.
- Search an online database
NEIC (National
Earthquake Information Center)
Search Parameters:
- S-earch Earthquake Database
- Global (Worldwide)
- Expanded File Format with Headers and Spacers
- USGS/NEIC (PDE) 1973-Present
- 1995-1996
- Magnitude 1-9.9
- Save the data as a text file the appropriate directory.
- Preparation of data in EXCEL
- Open the file.
- Start the import at appropriate header row.
- The file type that best describes the data is fixed
width.
- Create correct columns with inserted lines. COLUMNS NEEDED:
- Year
- Month
- Day
- Time
- Latitude
- Longitude
- Depth (km)
- Mangitude (mb)--Magnitude, a logarithmic measure of the "size" of an earthquake, is related to the energy released as seismic waves at the focus of an earthquake. The highest magnitude known was about 9.5, the lowest about -3.0. Mb is the body-wave magnitude which is the magnitude to be used in this exercise.
- Delete the columns and rows not needed. All rows
that do not contain data need to be deleted. To delete empty rows, highlight the entire year column and sort (descending). The empty rows will be sorted to the bottom and can be deleted all together.
- Save the modified data as a DBF 4 (dbase IV)(*.dbf) file, but give it a new name in order to save the original data as an archive.
- Bringing the Data into ArcView as a Table
- Activate table icon.
- Click on Add.
- Change the file type to text.
- Click on the file.
- If the table comes into ArcView with the columns and rows delimited it is correct.
- Displaying the Data spatially in ArcView
- Activate the view icon.
- Select new.
- Add the country 94 theme.
- Set the view properties so that map units are decimal degrees and the distance units are miles.
- Go the the file menu and select View and then Add Event Theme.
- The table to be added is the table brought into ArcView.
- The x field should be long and the y field should the lat.
- Click OK and turn on the earthquake data theme.
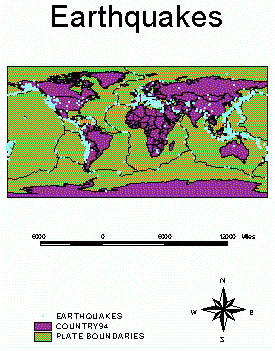
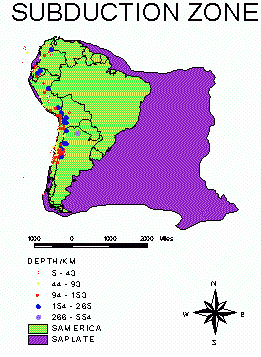
- Analyzing the Data
- Support the plate tectonics theory by diplaying the plate line theme and seeing how closely the earthquake data matches.
- Statistically prove subduction OR statistically compare divergent and convergent plates. The statistics should be displayed spatially within the context of a map.
PART II -- WEATHER DATA -- CONTINUOUS DATA
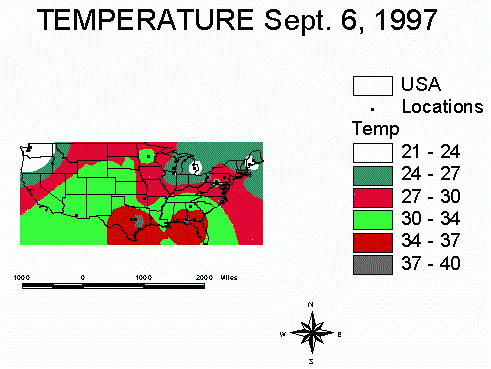
Continuous data is represented in a GIS as surfaces, where the value for each cell is the value for a point at the center of the cell, and the value of other locations within the same cell can be interpolated from the cell center and the centers of neighboring cells.
In this lesson data from GLOBE school sites are used to create a surface weather map.
- From the directory globe add the USA theme and the atmtemp database table.
- Examine the data for errors.
- Add the data as an event theme.
- Interpolate the surface.
- There are two groups of surface functions, a category for creating surfaces and a category for analyzing surfaces. The functions in the first category, called surface interpolators, create a continuous surface from sampled input point values. There are four types of surface interpolators.
- IDW -- The Inverse Distance Weighted interpolator assumes that each input point has a local influence that diminishes with distance.
- Spline -- The Spline interpolator is a general purpose interpolation method that fits a minimum-curvature surface through the input points. BEST TO USE FOR THIS EXAMPLE!
- Kriging -- The Kriging interpolator is a specialized interpolation method that assumes the distance or direction between sample points shows spatial correlation that helps describe the surface.
- Trend -- The Trend interpolator fits a mathematical function, a polynomial of specified order, to all input points.
- The second category uses a continuous grid theme to perform a specified calculation that results in different representations of a surface or that derives patterns not readily apparent in an original surface. Surface-analysis functions typically produce aspect, slope, contour, or hillshade maps.
- Create an appropriate layout.
 ACTIVITIES