Ming Zhang, Tim DeWitt, Mike Robison and Bob Sprout
The Gallia Rural Water Company (GRW), Gallipolis, Ohio currently maintains a 1,400-mile water distribution system serving nearly 7,500 customers in a five county service area in southern Ohio. Bennett & Williams Environmental Consultants, Inc. (B&W) was retained by GRW to develop a GIS to assist them with water distribution modeling and long-range planning needs. They accomplished this by utilizing ArcInfo, ArcView, and WaterCAD software. The water distribution model was created by integrating GIS technology with numerical pressurized water flow modeling software. Using existing public domain spatial data and system monitoring data, ArcInfo was used to generate a water distribution network, establish water supply system operational parameters, and input water consumption data to the model program. The model output is then displayed using ArcView for visualization and reporting purposes. Bennett & Williams provided other demographic, infrastructure, and environmental data sets including the following: TIGER and census data, 10m SPOT imagery, DEM’s, 7.5’ DLG’s, and Ohio Capability Analysis Program (OCAP) Land Use/Land Cover and Soils data. The integration of these data will be utilized to aid GRW in planning for their long-range water supply and service needs.
The complexity of the Gallia Rural Water Association (GRW) water delivery system presents a unique challenge for water distribution network modeling. Serving nearly 7,500 customers over a five county service area (largest in the region), GRW owns over 1,400 miles of pipeline. This pipeline is located in diverse terrain and has rapid and ongoing system expansion pressures. The system includes 23 elevated water storage tanks containing 22 pressure zones.
In 1996, GRW determined the need to develop a new water atlas, along with water distribution modeling capabilities, to assist them in the evaluation and analysis of its current delivery system needs, while also integrating planning and design capabilities into the overall management system. GRW desired an effective and affordable means to gather and manage spatial and aspatial information in support of their overall mission.
The decision to utilize GIS technology was an easy one says GRW General Manager Bob Sprout. "I wanted to be able to transfer my working knowledge of the system to a database, so that when I retire, my successor would have the benefit of my 10+ years of working on the system. Once the capabilities and benefits of GIS were demonstrated to me, the decision was easy; it was the only alternative worth pursuing."
Bennett & Williams Environmental Consultants, Inc. (B&W) was selected to make Bob Sprout’s dream a reality. B&W chose to utilize Esri’s ArcInfo and ArcView GIS software along with Haestad Method’s WaterCAD water distribution flow modeling software. The combination of ArcInfo’s massive spatial data manipulation capabilities afforded easy data input and updating capabilities. These capabilities linked with WaterCAD’s predictive modeling capabilities provided the desired output results requested by GRW.
ArcView will soon be installed at the GRW offices, thus providing staff the capability of visualizing model inputs and results, along with the ability to manage the overall spatial components of the water supply system. Additionally, GRW personnel will be able to utilize the demographic, infrastructure, and environmental coverages to support the future water supply planning needs of the company.
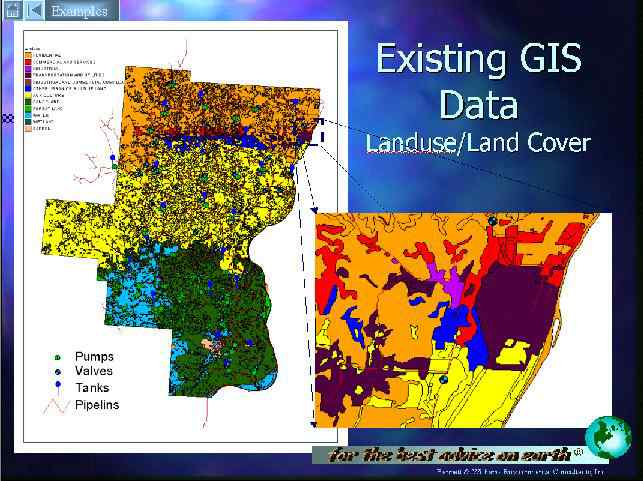
There were two primary reasons GRW wanted to build a GIS: first, despite the fact that WaterCAD is Windows based software, the task of building a digital modeling network and assigning the system operational parameters could be very time consuming. The use of GIS technology offered a powerful and cost effective tool in the utilization of existing spatial data; second, many governmental spatial data sets were available in Ohio with more data scheduled for release in the near future. The use of GIS will provide a dynamic planning management tool for linking water supply and distribution system analysis requirements with historic demographic trends, projected growth scenarios, environmental and infrastructure constraints, and economic trends within the GRW service area. (Figure 1)
Figure 1: Example of GIS Environmental Data
WaterCAD, developed by Haestad Methods in Waterbury, CT, was the modeling software chosen for the project due to its friendly user interface and the company’s commitment to provide software upgrades linking their product to Esri’s ArcView shape files. WaterCAD is a stand-alone Windows-based commercial water flow and water quality modeling software package. Its numerical computations are based on research conducted by U.S. EPA, Drinking Water Research Division, Risk Reduction Engineering Laboratory.
GRW’s digital pipe network was created from existing road centerline data obtained from the Ohio Department of Transportation (ODOT). Nearly 7,500 customers have been geo-coded in the system and assigned to the nearest demand junction. Other system components, such as tanks, reservoirs, pumps, and valves were generated from network nodes. These data were then imported into WaterCAD for model calibration. The outputs of the model calibration or various scenarios are directly updated in ArcView for visualization and high quality reporting. Other water supply system data, such as pipeline maintenance records and customer billing records can be added in the future for system management purposes.
The primary goal of this project is to create a water distribution model for GRW. WaterCAD, developed by Haestad Methods in Waterbury, CT, was chosen to calibrate the model and perform the network analysis due to its friendly user interface and the developer's promise to link WaterCAD to Esri’s ArcView shape file. WaterCAD is a stand-alone Windows-based commercial water flow and water quality modeling software package. Its numerical computations are based on research conducted by U.S. EPA, Drinking Water Research Division, Risk Reduction Engineering Laboratory.
A water distribution model satisfies two basic needs for any water system: first, it provides an inventory of all system capabilities ("water atlas"); and second, it provides a powerful diagnostic and predictive planning tool for the overall system. The significance of a current water atlas should not be overlooked because once established, only incremental modifications to the atlas are necessary, reflecting repairs, line extensions, or new tank installations. The "water atlas" alone pays for the cost of software and data input. Costly, periodic revisions and annual updating of records are avoided in an electronic water atlas. By incorporating GIS functions, output maps can be customized to meet the users needs.
This dynamic system provides a powerful planning tool in the development of "what if" growth scenarios once the water atlas is current and the model has been calibrated. Once calibrated, the model will reflect the true reality of the system. WaterCAD also provides diagnostic capabilities, identifying potential or existing problem areas, in addition to conducting fire flow, and water quality assessments throughout the system. As of this writing, B&W is finalizing the model calibration. This is an essential and critical step; however, once completed the model will essentially "be" the actual system.
Despite the fact that WaterCAD is a easy to use Windows-based program, massive data collection and preparation is required to create the water distribution model. Data input for model calibration falls into three categories: the modeling water distribution network and associated pipeline attributes, other network components such as storage tanks and their operational parameters, and water consumption data for each network junction node (Figure 2). By utilizing ArcInfo for the conversion of existing spatial data for the model input, considerable cost savings were achieved.
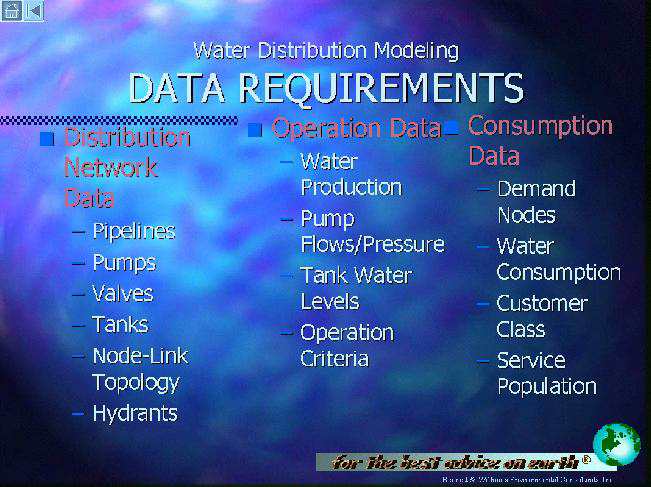
Figure 2. Illustration of Modeling Data Requirements
The conventional method for network encoding involves the digitization of pipelines from hard copy maps, or the utilization of existing digital drawings containing topographic and planametric features as a backdrop for "heads-up" digitizing. This data preparation process is very time consuming and labor intensive. In particular, this is especially true for rural water suppliers like GRW, whose service area covers 5 counties and contains over 1,400 miles of pipeline. Since most pipelines follow roads, and water distribution modeling does not require high positional accuracy, pipeline information can be linked to existing road centerline coverages. The pipeline route system can be generated by using dynamic segmentation or in ArcEdit. The ODOT digital Road Inventory Database was selected to serve as the foundation of the network due to its abundance of attributes, the relative high degree of accuracy of the data, and its standard linear reference system (LRS).
The ASCII format Road Inventory Database was first converted into ARC coverage. After initial clean up, pipe diameters were assigned to each road segment for pipelines in excess of 2-inch diameters. Road segments were split at locations where pump, valve, tank, or pipe size changes existed. A Spot-pan satellite image (Figure 3), which was rectified to the ODOT road coverage, was used as the backdrop in ArcEdit to add a few pipeline segments that did not follow road alignments. Finally, selected road segments and newly added pipelines were used to build the water pipe network with link-node topology. Utilizing the plotted line segments with ID numbers and worksheets, other pipeline attributes were collected by GRW and B&W staffs. Not only was the modeling network created with minimum effort, the relationships between the road and water pipe databases were identified by sharing the same linear reference system (Figure 4). In fact, attributes in the road inventory database, such as road pavement width, base or material, and average daily traffic (adt) volumes will ultimately prove valuable to the water supply management system and decision making process.
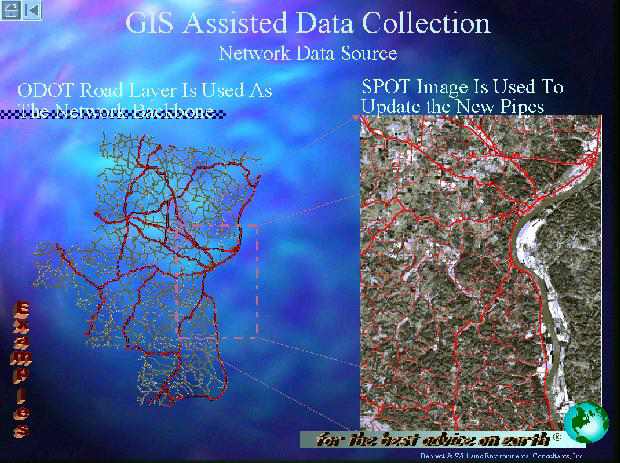
Figure 3: 10m Spot-pan was used to digitize the off-roads pipes
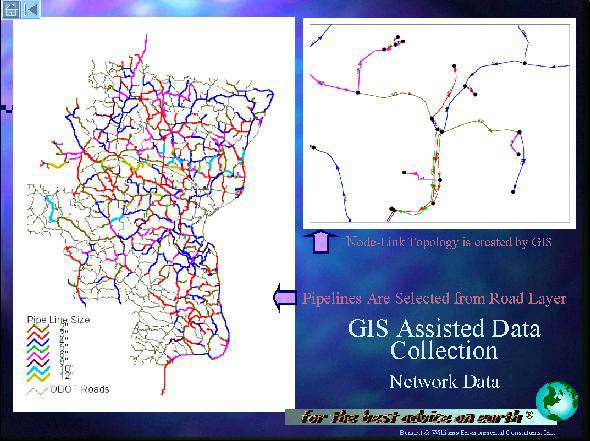
Figure 4: The Water Atlas Map
Network Operational Parameters
Once the pipe network is created, the coverages for other components of the distribution system including valves, pumps, reservoirs, and storage tanks are generated by identifying the corresponding network nodes (Figure 5). Operational parameters of each component are then added into the features attribute tables.
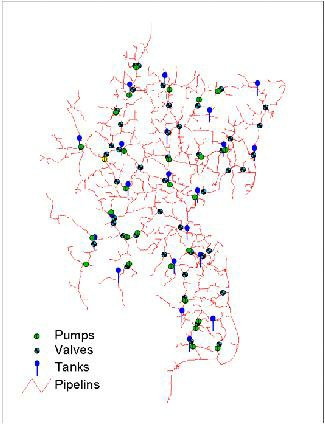
Figure 5: The Water distribution Network
Daily, hourly, or seasonal water consumption data must be calculated for each network junction node. Traditionally, this data can only be estimated due to the lack of detailed user distribution information. In this project, the ArcInfo Geocoding process was used to locate each customer by pipeline segment.
Like many water companies, GRW maintains a customer billing records database containing current and historical monthly water consumption data for each user. In this database, customer mailing addresses and water meter addresses were also included. Ideally, a geo-coding (address-matching) process can be conducted to locate each customer in the network by utilizing address information and a street network such as the TIGER/Street file or other commercial street data. Unfortunately, the quality of public as well as commercial street network data is marginal for most rural areas. An attempt was made to geo-code GRW’s 7,500 customers using TIGER/Street file, however, due to the nature of the five county GRW service area, less than a 5% hit-rate was achieved.
The GRW customer billing database also contains information about how the meter-reading procedure is organized. The entire pipe-network was divided into several books based on a specific geographic area, with each customer assigned a unique identifier number, sequentially ordered and starting from the beginning of each road segment. This is actually the same logic format utilized in contemporary street address systems. The sequential-number was used as the house number while the book-number was treated as the street name. This information was then used to build a "street" network and then utilized in performing the geo-coding using the book number and sequence number of each customer.
During the pipe data collection process, the book-number, beginning sequence-number and ending sequence-number of each pipe segment was assigned to the pipe network. Based on this information, a "Single-Range" style geo-coding network was built and address matching was performed. An address-matching accuracy of over 98% was achieved utilizing this methodology. (Figure 6)
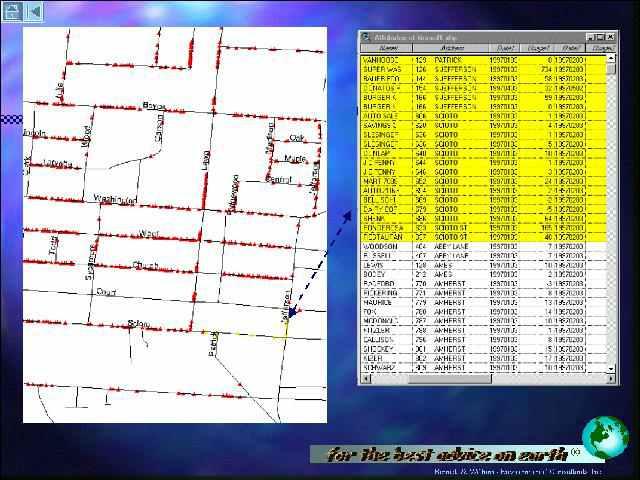
Figure 6: The Geocoded Customer Locations
Once the customer location point coverage was generated, the ArcInfo dynamic segmentation function was used to add the route-measure to each point. An AML was also developed which calculates the average monthly water demand for each network junction node, based on the previous three years of consumption data.
Coupling a stand-alone modeling program with GIS presents many data integration problems. In the past, users often had to write a translator, which converted data into a desired format, then export and import data between the two programs. Recent developments in operating systems, program development environments, and system architecture makes this data integration process more seamless. One of the major reasons that WaterCAD from Haestad Methods was chosen as the hydraulic network modeling program was their promise to develop the ability for WaterCAD to read ArcView shape files and to develop database connections between WaterCAD and other popular databases such as FoxPro, dBase or Paradox. At the outset of this project, B&W wrote a translator to integrate data for ArcView and WaterCAD. Recently, a new release of WaterCAD (3.0) was introduced to the market, which can directly read ArcView shape files such as pipe networks, demand junctions, along with other network components, and other required modeling attributes. Wherever attribute changes are made in either ArcView or WaterCAD, the other database will be updated automatically. This allows GRW personnel to update the model’s condition inputs and to visualize the model run results from ArcView free from the traditional import-export protocol.
The functionality of integrating GIS with water distribution modeling capabilities is not limited to data preparation and visualization. By utilizing the spatial data integration function of GIS, the system can be expanded into a comprehensive facility management and planning tool (Figure 7). Over time, GRW’s strategic and capital planning capabilities will result in improved customer service and the realization of additional economies yet to be determined.
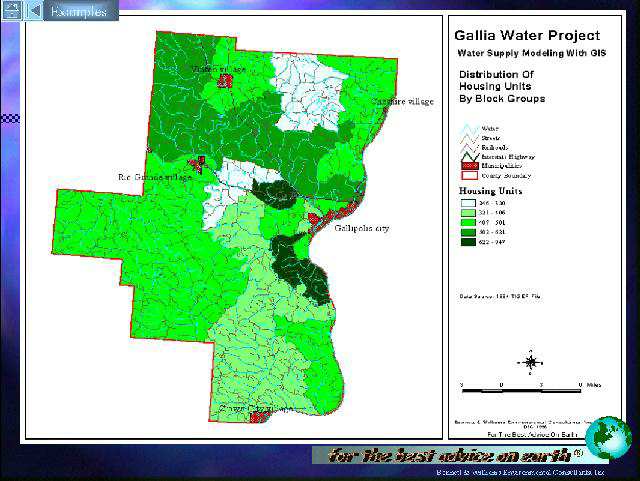
Figure 7: Example of Demographic Data
Once the water atlas was created, system facility inventory, maintenance, system operation, and customer service information were linked to the existing spatial features in the GIS database. The resulting AM/FM/GIS not only transferred information from various paper maps, tables, and documents into digital form; but also paved the way for enhanced inventory management, work task management, automated meter reading, and automated customer services. For instance, wherever a service event occurs in the system, the location can be quickly identified and diagnostic system analysis conducted to determine the potential problem. Affected customers can be contacted, told the extent of the repairs and the estimated timeframe for the completion of the repair.
Coupled with GIS, modeling becomes more relevant to the decision-making process. With this integrated system, pictures and graphics of modeled alternatives or "what-if" scenarios can be instantly displayed utilizing ArcView and overlaid with other demographic, geographic, planametric, and environmental data sets. Utilized together, WaterCAD and ArcView provide a powerful and cost-effective management tool for GRW.
Water supply is a part of the regional infrastructure and is closely linked to regional social-economic development. This ArcView based GIS includes many existing spatial data reflecting social-economic, infrastructure and environmental status in this region, such as TIGER and census data, 10m SPOT imagery, DEM’s (figure 8), 7.5’ DLG’s, and Ohio Capability Analysis Program (OCAP) Land Use/Land Cover and Soils data. The integration of these data will be utilized to aid GRW in planning for their long-range water supply and service needs.
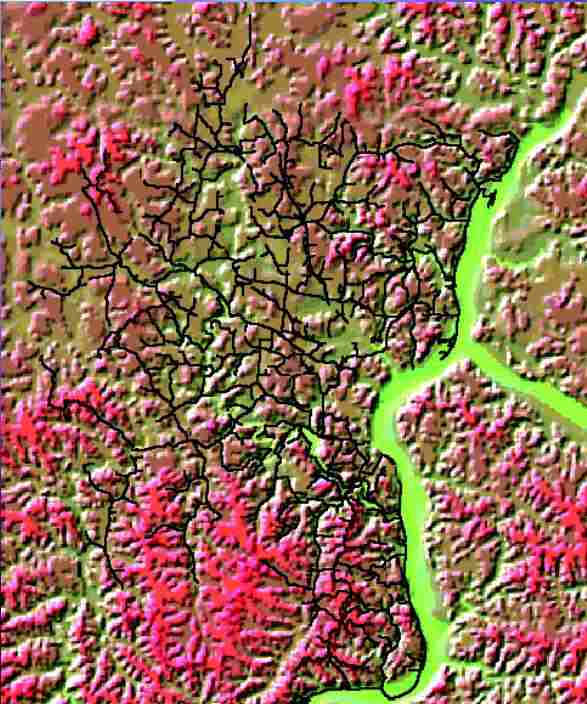
Figure 8: Example of Demographic Data
By the turn of the century, DOQQ's will be available for the entire State of Ohio. Also, the Ohio Department of Natural Resources has recently completed a Land Use Inventory update for the entire state. This new coverage will provide updated land use coverage through 1995. Census data from the 2000 census will be utilized (upon release) to update the existing 1990 census data.
Future planning applications currently under consideration include the following: additional data input for the purpose of refining demand forecasting procedures, the implementation of an Emergency Response Plan based upon lessons learned during the 1997 Ohio River flooding event, the development of a Wellhead Protection Plan, and the utilization of the GRW database to foster the development of a strategic economic development plan for the five county southern Ohio region.
Rural Ohio has discovered the benefits of GIS. As the millennium approaches, more accurate and diverse data will be available throughout the state. Many counties in southern Ohio are beginning to see GIS technology as a new economic development infrastructure, one which will improve their quality of life. The Gallia Rural Water Company has positioned itself to take a leading role in utilizing this technology, not only to benefit its current customers, but those yet to come.
Ming Zhang
GIS Coordinator
Bennett & Williams
Environmental Consultants, Inc.
2700 E. Dublin-Granville Rd.
Suite 400
Columbus, Ohio 43231-4054
Tel. (614) 882-9122
Fax: (613) 882-4260
b&w@iwaynet.net
Tim DeWitt
Director of GIS/Planning
Bennett & Williams
Environmental Consultants, Inc.
2700 E. Dublin-Granville Rd.
Suite 400
Columbus, Ohio 43231-4054
Tel. (614) 882-9122
Fax: (613) 882-4260
b&w@iwaynet.net
Mike Robison
Engineer (P.E.)
Bennett & Williams
Environmental Consultants, Inc.
2700 E. Dublin-Granville Rd.
Suite 400
Columbus, Ohio 43231-4054
Tel. (614) 882-9122
Fax: (613) 882-4260
b&w@iwaynet.net
Bob Sprout
General Manager
Gallia Rural Water Association
308 Burnett Road
Gallipolis, Ohio 45631
Tel. (740)446-9221
Fax: (740)446-9586