Several groups within a network operator use the information related to coverage. Those groups range from Engineering, Network Optimisation, Customer Care, Marketing, etc. This information, required by those groups, should be consistent and up-to-date. Besides, each group needs a different view of that information, depending on the final use.
This article describes an integrated tool: the Coverage Information System (CIS), developed by Telefónica I+D and Telefónica Móviles for handling coverage information. Its main characteristics are the scalability of the information -each user receives only the information it requires, and the possibilities of the associated tools for coverage analysis.
The CIS is not just a database of coverage information. Linked with other information sources, such as traffic databases or the Operation and Maintenance System, it can provide a useful insight into network operation. At the end of the article, a number of exemplary uses of the CIS system are given. They range from the generation of maps to the analysis of the use and possible malfunctioning of a group of Base Stations.
There are already several data sources in the system, though the number can be expanded in the future:
These are obtained through cellular planning computer tools, which are the basic elements of the Network Planning department.
These are obtained in the field through various different kinds of communication quality measuring equipment. The CIS uses mostly information from the Sistema Automático de Medida [Automatic Measurement System] (SAM) as will be explained later, though other information devices from different manufacturers can be employed.
Data can be obtained from the network switching centres to analyze the traffic in a given cell. This information can be of value in checking the level of use of a particular base station and to decide places where new sites are required.
Marketing departments can provide information on strategic commercial area. That information is also stored in order to plan future base station rollout.Using information based on those data sources, a wide variety of applications can be realised. Detailed below are some of the functions that the CIS already performs:
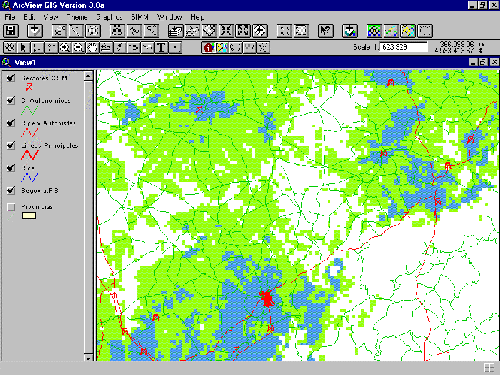
With the combination of real measurements and planned coverage, increasingly exact coverage maps can be generated, thus providing an analytical tool and an important source of information for planners, whose queries can be answered instantly and reliably. The correction of planned coverage with real measurements will be filled out using ARCINFO grid capabilities.
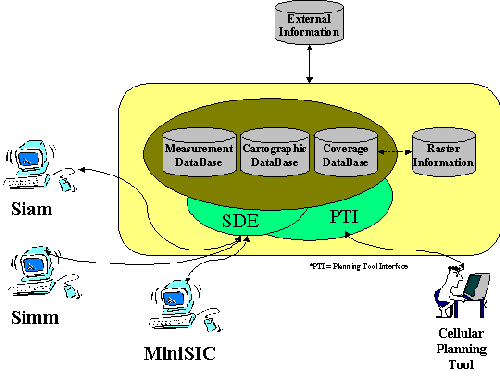
Coverage maps will be generated automatically whenever a new base station enters service, so that coverage information is always up to date. This enhances the customer perception of quality and promotes Operator's image. The CIS is able to maintain a large number of shapes (one for each base station) using SDE capabilities, offering to other client applications (both Arcview or MapObject) an efficient interface to obtain the set of shapes which compose the radio coverage (both real and measured).
The combination of digital cartography with information on coverage (real or measured) of network parameters and socioeconomic information on users is a very valuable tool for Commercial Planning. Its use allows detecting business opportunities or weak spots in the network that can then be dealt with by Network Planning. Influence areas are calculated employing Network Analyst extension, which is able to analyze the distribution channel in order to determinate potential business opportunities.
Analysis of the network parameters combined with network information (such as traffic for example) will enable better identification of problems and more effective decision-making based on objective elements.
Following is a functional description of each of the components.
The SDE also incorporates spatial analysis capability and provides a comprehensive set of spatial and geometric analysis functions such as calculation of distances, generation of areas, overlaying of geographic elements. In all cases it uses a structured spatial query language similar to SQL, with which it is possible to establish the scope of queries and the set of conditions for selection of elements, with WHERE clauses on the attributes of geographic elements.
One of the crucial points of development was the integration of the CIS in the existing Telefónica Móviles infrastructure so as to take maximum advantage of the existing resources, incorporating only those elements which were required.
The database is loaded from different sources. These are basically as follows:
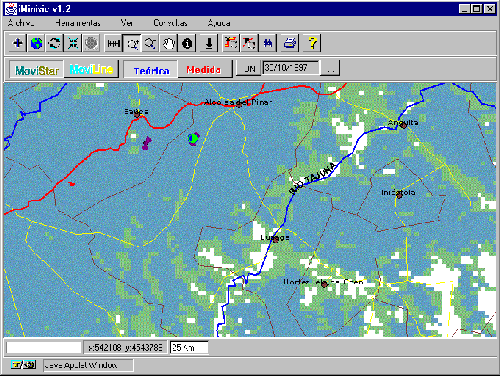
SIAM is a special purpose tool developed within the CIS. This tool is used to display the measurements made on Analog TACS and GSM networks. It will therefore be useful in optimization of the radio subsystem.
It can be used to display a test (a set of measurements executed on one or more calls) in terms of geographic evolution (plotted on an area map) and/or evolution over time (variation of position and quality parameters).
The tool is based on Arcview and therefore incorporates all of its display capabilities. The SIAM further incorporates three additional types of function:
Spatial display functions. They are used for presentation of different parameters on the Arcview desktop. Temporal display functions (ITIME). They are employed for presentation of the various parameters on X-Time graphs. Both spatial and temporal presentation are synchronized via DDE. Analytical functions. It provides statistical and graphical information based on performed measurements.
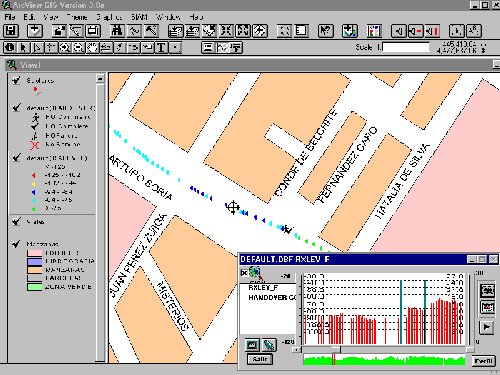
The SIAM can also provide information on the signalling processes performed when a test communication is made. This information can be used to make a detailed track of the communication. This would help to identify possible failure causes.
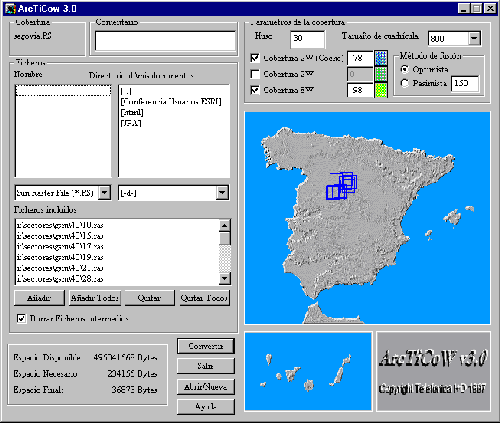
The SIMM is a set of tools designed to provide a rapid solution in the process of generating coverage maps. It provides flexible presentation of the data and effective handling and maintenance of all the information that will be generated in the process of planning and preparing mobile networks for service.
The principal possibilities are:
- Selection and modification of grid size resolution. Selection of the grid size is perhaps the most crucial step in generating a coverage file, as an inappropriate grid size can result in an enormous coverage file containing little information, or a file in which much of the information is sacrificed to save disk space. This application is integrated in an Arcview project, and it allows modifying the grid size, the radio threshold, joining isolated coverage in a multiple coverage file, which could be represented by Arcview as a simple raster file.
- Modification of coverage thresholds. Coverage area depends not only on the Base Station characteristics but also on the mobile unit performance. High quality mobile units have a larger operation area due to the superior transmit receive performance. To provide adequate coverage maps reflecting different transceiver capabilities and other environment situations (indoor, open areas, inside vehicles, etc), coverage thresholds can be modified and different maps are produced.
- Statistical analyses. A series of tools have been developed and integrated in the Arcview project, combining Avenue scripts and DLL, so that coverage analyses (i.e. percentage of area covered) can be run on different geographic units.
Owing to the large volume of information stored in the system, alternative modes of access need to be sought. Systems based on Intranet technology may provide the best solution to many of the coverage information requirements.
With these technologies it will be possible to achieve minimum learning times and centralised configuration management -a very important problem where PC networks are concerned.
Connection will be provided to the O&M (Operation and Maintenance Systems) to include more detailed and up-to-date traffic information. Connection to new measuring devices can also be made. Those new measuring devices can provide information on the Spectrum Usage, levels of interference, etc.
Once the new information sources are implemented, a new variety of information possibilities arise and new tools will have to be developed to handle and relate the new information.
As regards to the CIS architecture, the following evolution is foreseen:
- Distribution of the CIS databases. Information on base stations will tend to be distributed not only because of reliability reasons but also because of security requirements.
- The CIS as a gateway to calculating tools. The objective would be to design a common user interface, which would separate the prediction planning process of the commercial tools available for it. This would reduce the time required for the introduction of future planning prediction tools.
- Adaptation of applications to new Telefónica Móviles departments.
Javier Gavilan.
Information Systems for Mobile Comm. Division Manager
Telefonica I+D.
C/Emilio Vargas 6. 28043 MADRID (SPAIN).
Phone: +34 91 3374785
Fax: +34 91 3374402
email: gavilan@tid.es