
Anthony Catalano, Ming Zhang, Julie Rice
GIS was used during a hydrological investigation of a proposed landfill site, in order to visualize the spatial relationships between the various geological, hydrological, and geographic features as they relate to the proposed landfill. The proposed landfill site is adjacent to the Mad River Valley immediately west of Tremont City in Clark County, Ohio. The Landfill's proposed location is situated upland approximately 130 feet from the Mad River Valley, atop and next to two major aquifers and several sand seams. Both publicly available digital data and field observation data were used to develop a GIS presentation to be used during litigation, to present complex geological and environmental observations in a non-technical way.
For research to be truly usable, not only must it be possible to formulate ideas about the data but, even more importantly, it must be possible to clearly communicate those ideas to others. The focus of this paper is to explain how GIS was used both as an analytical and as a presentation tool, during an investigation of a proposed landfill site near Tremont City, in Clark County, Ohio. Tremont is a small farming and bedroom community located about 50 miles west of Columbus, almost directly between the cities of Urbana and Springfield. Geographically, Tremont City is located in the Interior Lowlands province and sits in the Mad River valley (Figure 1).
Figure 1. Location map of Tremont City, the proposed landfill, and the Springfield City well field.
The Danas Corporation of Dayton, Ohio owns a closed landfill near Tremont City which is currently in remediation. They have proposed to build a new landfill west of the old one, closer to the Mad River Valley. Their permit to install has been approved by the Ohio Environmental Protection Agency allowing them to construct the new landfill upland, northwest of Tremont City, and 130 feet in elevation above the Mad River Valley. The residents of Tremont City sued the Danas Corporation and the Ohio EPA due to concerns that the proposed landfill site may impact the surface and ground-water supplies, natural resources, upon which the community greatly relies. Their concerns were based on the fact that the older, closed landfill is already leaking and the proposed landfill will move wastes closer to the river. The Clark County Commissioners became involved, due to public concern, and contacted Bennett & Williams Environmental Consultants, Inc. for assistance in developing a visualization tool. Bennett and Williams was asked todevelop a site visualization program that could be used for public education as well as for ongoing litigation support. The total possible budget was set at $10,000 .
The scope of the project was to present the information collected during an earlier study of the potential for environmental impact from the proposed landfill. This project was to present the information in a way that a non-technical audience could understand. The approach taken was to examine the fundamental geologic and hydrological characteristics of the area and question whether or not an environmental impact from the proposed landfill was a possibility. The environmental issues of concern were based on the location of the proposed landfill relative to Tremont City, relative to the Mad River and its buried-valley aquifer, and the locations and elevations of the major aquifers under the landfill. In addition, the locations and elevations of the springs and seeps, and the location of the Springfield well field were also considered.
A field study of the area around the proposed landfill was conducted, after a review of the existing documentation, to describe the glacial deposits and fundamental hydrogeological characteristics of the study area. The field study was completed by Bennett & Williams personnel and included, the excavation of a 20 feet long, 12 feet wide, and 12 feet deep test pit, and the mapping and surveying of springs and seeps. The test-pit was constructed in order to characterize the glacial till located below the proposed landfill, and to confirm the presence or absence of fractures within the glacial till. The maps and pictures used to describe the field observations were either scanned or digitized and added as digital data to the project file.
GIS was utilized for this project in order to help present the stratigraphic relationships and field observations in a familiar way. ArcInfo was used for the data manipulation and ArcView was used for minor editing and presentation purposes. Because of the large supply of publicly-available digital data, GIS was a valuable asset for this project. For nearly every county in the State of Ohio, there exists 7.5 minute U.S. Geological Survey quadrangles in Digital Line Graph (DLG) format. The DLG's consisted of the hydrology (lakes and streams), roads, boundaries, railroads, public land survey, and hypsography. The relatively high degree of map-accuracy within the DLG files helped to keep the data manipulation cost down, providing more time for analysis and presentation. ArcInfo and ArcInfo Grid were used to read the DLGs and render a digital elevation model (DEM), 3-D perspective views, a fly-over movie (in MPEG format) and coverages of drainage, hypsography, townships, and county boundaries. With the exception of the fly-over movie, and the 3-D perspective views, the ArcInfo coverages were converted to shape files and loaded into ArcView for presentation. The DEM was color coded based on elevation and used in ArcView as a base map. The 3-D pictures of the area were saved as sun raster images, readable by ArcView, and subsequently added to the presentation (Figure 2). The fly-by movie of the site remained separate from the ArcView presentation file. Other digital-data elements used for this project included engineering drawings of the landfill and scanned photographs of the area.

Figure 2. 3-D image of the landscape surrounding Tremont City.
The ArcView presentation was used to help demonstrate the following relationships during litigation and during technical meetings with the Ohio EPA:
In order to support these relationships it was important to clearly show the location of the proposed landfill, as it fit into the surrounding area, and to demonstrate how the locations and elevations of the springs, seeps, major aquifers and sand seams, relative to the landfill, could be used to asses the potential for environmental impact on the surface and ground-water supplies. This was accomplished by first presenting the material in terms of a regional picture inward to local areas, proximal to the location of the proposed landfill.
The regional picture was presented by first showing a location map of Tremont City, the proposed landfill, the city of Springfield and the Springfield City well-field. Supporting the location map, was the fly-by movie of the regional landscape created in ArcInfo. The movie demonstrated the texture of the landscape, and the changes in relief between the upland areas relative to the Mad River valley and the Springfield City well-field. The combination of the movie and the location map demonstrated that the direction of surface water movement was towards the Mad River and that the location of the proposed landfills is approximately 3.0 miles from the closest water-well at the Springfield City well field.
From data gathered in the field, and the known locations of the aquifers and water bearing units, maps were created showing the locations of these zones within the area of the proposed landfill. The maps were displayed in ArcView by first breaking out key contour intervals from the hypsography coverage, and subsequently turning them on and off, in order to display them as markers for the elevations and lateral extents of the aquifers and water bearing units (Figure 3).
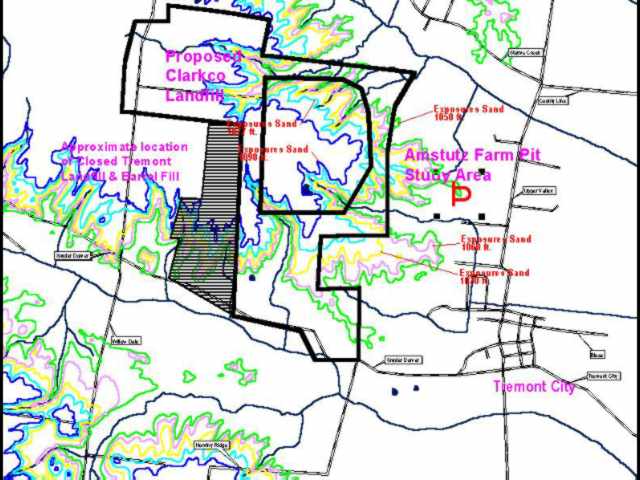
Figure 3. Map of the water bearing zones (shown as the colored contour lines) around the proposed landfill.
A similar map was prepared for ArcView, from field data as supporting evidence, showing the elevations and locations of springs and seeps relative to the landfill. Presentation of this material was used to support the assumption that the area surrounding the proposed landfill location was capable of transmitting ground water, and that the proposed landfill's location is in close proximity, both vertically and laterally, to the major aquifers and water bearing units. Furthermore, it provided insight into the identification of areas that would most likely be impacted environmentally from contamination associated with a leachate plume, should one occur.
The principal path for water movement within the tills was determined from the field studies of the test-pit. Data collected at the test pit included several pictures of till-fractures and a map of fracture orientations. The map was digitized, and the pictures were scanned, then both were added to the ArcView presentation. A location map of the test pit was also used within the ArcView presentation to relate the orientation of the observed fractures to the proposed landfill site. The scanned pictures of the fractures were "Hot Linked" to marker symbols on the fracture-orientation map and used to provide visual proof of the till fractures (Figure 4).
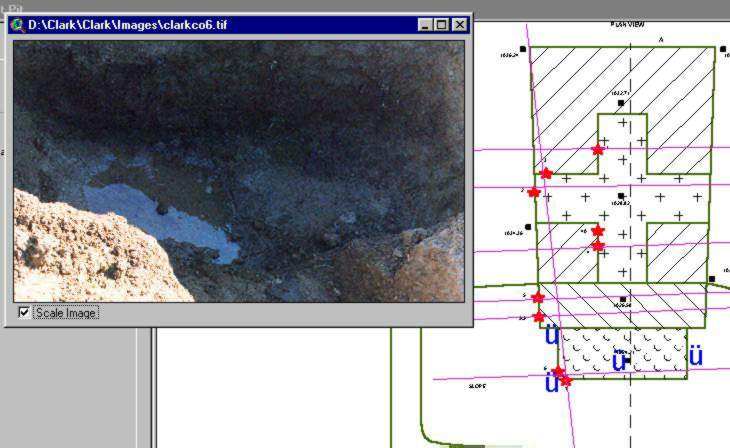
Figure 4. Hot linked photograph of a fracture and a the ArcView drawing of the test pit.
One of the scanned photographs was taken a day after the test pit was completed. This photograph was of a fracture at the bottom of the test pit beneath several gallons of water that had seeped into the test pit over night(Figure 4). The observations from the test pit, and the known literature regarding till-fractures, were used to support the argument that the fractures are capable of transmitting ground-water, and acting as conduits which can intersect both sand seams and aquifers, providing possible landfill-derived contamination plume pathways to private and municipal ground-water supply.
Utilizing GIS as a data management, analysis, and visualization tool for this project helped to present complex geological and environmental observations in a manner that was both familiar and easy to understand. Combining field data, and maximizing the use of publicly available data, helped keep data manipulation costs down while providing more time for analysis and presentation.
We wish to thank Mr. and Mrs. Maynard Amstutz for access to their property; and the citizen organization of Citizens for Water, the residents of Tremont City, Ohio, German Township, the City of Springfield and the Clark County Commissioners for including us in this project. In addition, we wish to thank Dr. Ann Christy and Dr. Jerry Bigham, Ohio State University, Peter Townsend, Anitoch College, Dr. John Szabo, Akron University and staff from the Ohio Department of Natural Resources, Division of Water and the Ohio Environmental Protection Agency for their assistance in document review, site investigations and laboratory preparation of samples from several sites in the area.
Anthony W. Catalano
Geologist
1503 Brookforest Dr.
Columbus, OH 43204
614.276.6027
acatala@iwaynet.net
Ming Zhang
GIS Coordinator
Bennett & Williams
Environmental Consultants, Inc.
2700 E. Dublin-Granville Rd
STE 400
Columbus, OH 43231
614.882.9122
b&w@iwaynet.net
Julie Rice
Senior Geologist
Bennett & Williams
Environmental Consultants, Inc.
2700 E. Dublin-Granville Rd.
STE 400
Columbus, OH 43231
614.882.9122
b&w@iwaynet.net