Jeffrey Cowen
Dr. Kirk Waters
Making Digital NOAA Nautical Charts ArcView Accessible
Abstract
In recent years there has been a call from the Geographic Information System (GIS) user community to be able to use navigational charts as a back ground data layer in their studies. The National Oceanic and Atmospheric Administration (NOAA) Coastal Services Center (CSC), recently partnered with BSB Electronic Charts and Environmental Systems Research Institute, to create an ArcView extension for reading in scanned NOAA navigational charts. BSB has entered a Cooperative Research and Development Agreement (CRADA) with the National Ocean Service branch of NOAA, to produce CD-ROMs of all the scanned NOAA navigational charts. The charts are in a proprietary format and therefore cannot easily be brought into any Geographic Information System software package. The goal of this project is to produce a freely distributed ArcView extension that will read in the charts, in BSB format, and maintain the georeferencing information so that other data layers may be overlaid.
Introduction
The navigational charts produced by the National Oceanic and Atmospheric Administration (NOAA) have been used by the recreation and commercial boating community; however charts, especially in a digital form, can provide important base data to a much wider audience. These charts, displayed as images, can provide a useful background layer for ocean and coastal geographic information system (GIS) projects. A problem for the GIS community has been that the current BSB format was not widely supported by mapping software vendors. Maptech, Inc., has an exclusive agreement to distribute NOAA charts in the proprietary BSB format, under a Cooperative Research and Development Agreement (CRADA). To address the issue of viewing these BSB images in a common desktop GIS, the NOAA Coastal Services Center (CSC), has partnered with Maptech Inc. and Environmental Systems Research Institute (Esri®), to create an ArcView® extension that allows the desktop GIS users to read a BSB-formatted chart. This freely distributed extension will provide a valuable product to the coastal and ocean GIS resource management community. This paper discusses the technical software development process that enabled the creation of this ArcView® extension.
One application of this extension has been to illustrate landfill in the New York harbor to create the John F. Kennedy International airport. Figure 1 shows historic NOAA bathymetry data locations overlaid on the most current nautical chart for Jamaica Bay in New York harbor. The bathymetry points that fall on land indicate areas of landfill in the harbor.
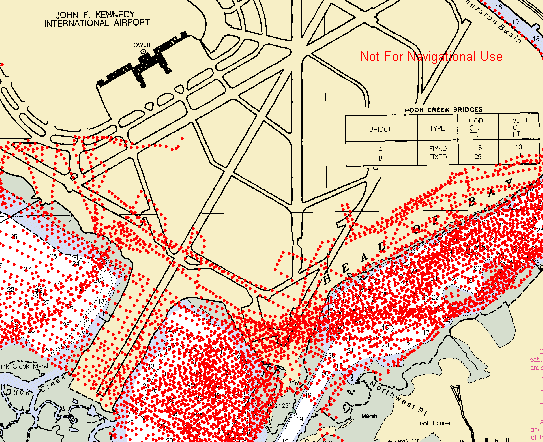 |
Figure 1. Historic NOAA bathymetry data, overlaid on current nautical chart to detect areas of landfill in New York harbor. |
Technical Development Issues
The extension is comprised of two components, the dynamic link library (DLL), which is written in the C programming language and the graphical user interface (GUI), which is written in Avenue® and will be discussed in another section (see Graphical User Interface). The DLL’s purpose is to calculate and pass to ArcView® the appropriate location of the upper left cell in the image and the appropriate pixel size, based on information in the chart header. The ground distance represented by a pixel varies across the image, however only one value can be passed to ArcView®. A set of reference points in the chart header are used to determine the average distance covered by a pixel in each of the x and y directions. Each reference point contains the pixel location in the image and the latitude longitude location on the earth. These latitude and longitude coordinates are converted to coordinates in the chart's projection. For each pair of points the pixel size in meters is calculated as the ground distance between the points divided by the number of pixels between the points. The average x and y pixel sizes are calculated from all possible combinations of two reference points. While this method provides satisfactory results, the nature of the image makes it impossible to determine a single pixel size that is accurate across the image. The user should realize that the variability in the pixel sizes within the image will result in some error regardless of how a single pixel size is chosen.
The paper versions of nautical charts are intended for navigational purposes, therefore it is desirable to minimize distortion caused by projecting spherical information onto a horizontal surface. In general, this means that each chart has a unique set of projection parameters such that distortion is minimized for that chart. This makes it impossible to put two charts in the same View correctly unless one or more of the charts are reprojected to a common projection. For the Mercator projection, the only projection parameter that is different between charts is the Latitude of True Scale (LTS), which is the line of latitude upon which distance measurements are accurate. The error in distance measurements increases with distance from the LTS. Changing the LTS causes only a change in the scaling; it does not warp the image. This extension allows the user to set the LTS that will be used for the current View, enabling "on the fly" reprojection and the ability to display multiple Mercator charts in the same View. After the LTS has been set for a View, it should not be changed, therefore the user must have knowledge about the area in which he is working before setting the LTS or he can set the LTS to zero. The first time a Mercator chart is added to a View, the user is prompted to set the LTS and is given a choice of using a value taken from the image or setting the LTS to zero. In either case all subsequent Mercator charts will be loaded using the LTS that has been set for the View.
Multiple charts in projections other than Mercator, such as Lambert Conformal Conic and Transverse Mercator, cannot be reprojected to a common projection with ease. Image warping and resampling would be required to allow two charts with different projection parameters to display together. The processing that would be required to warp a chart each time it is repainted was beyond the scope of this project. Moreover, the resulting wait for the redisplay would be unacceptable to most desktop users. If two charts did happen to have the same projection parameters, they could be displayed together without any problems.
Some of these charts also contain a "skew" factor, such that they are not aligned with north straight up. Many water bodies, such as rivers or the Intercoastal Waterway, lend themselves to a non-North orientation. In order for these charts to be displayed with the correct geographic orientation, this skew factor or rotation must be applied. This process requires additional processing and system resources; therefore in the case of large files, these charts will take noticeably longer to display. The skew correction requires significant resources because the entire image must be read into memory first and pixels are subsequently read from memory as needed. An image that is 10,000 pixels wide and 5,000 pixels high will require fifty megabytes of memory to temporarily store the image.
Figure 2 shows an example of multiple charts in a single View, including a chart that contains a skew factor. The colormap for the skewed chart has been altered to set color 0 to transparent. The larger image has a scale of 1:1,200,000 and the smaller image has a scale of 1:40,000. The ArcView® user can zoom in on the inset chart for a more detailed view.
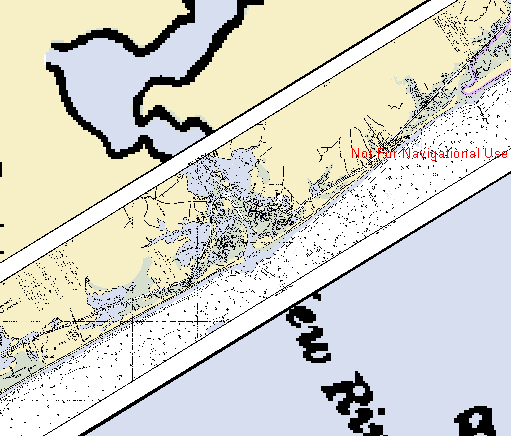 |
Figure 2. Multiple nautical charts displayed in ArcView. The inset chart contains a skew factor. |
Quality Control
Several methods were employed to ensure that the charts are displayed in the correct geographic location. Initially, the "Medium Resolution Vector Shoreline" (MVS) data set produced by NOAA was overlaid on the images. This gave the developers a reasonable estimation of accuracy, but because the two data sets are derived from slightly different sources, the MVS did not prove a sufficient source for evaluating the geographic accuracy of the charts. The most accurate method of measuring the location error of the extension was to generate a point file of the latitude and longitude intersections of each graticule. Because the graticule is a part of the chart image these points could be overlaid on the image and distance between the point and the graticule could be determined. In the opinion of the developers, this method provided the best assessment of geographic location. Preliminary tests show that while pixel sizes may vary within an image, the NOAA charts tested are displayed within National Map Accuracy Standards.
Figure 3 shows an example of the testing phase. The red triangles represent point locations generated from known graticule intersections. To test the accuracy, each point was zoomed in on and distances where measured from the points to the graticule intersection on the chart.
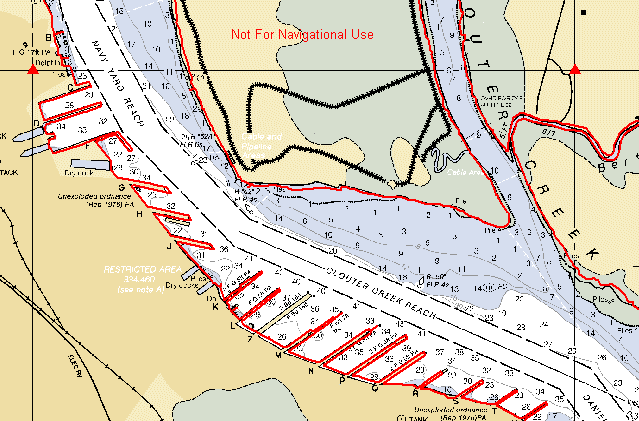 |
Figure 3. Testing the positional accuracy. The red triangles depict point locations based on graticule intersections. The red line, represents data digitized from a NOAA shoreline map. |
Graphical User Interface
The GUI for this extension was developed using Avenue®, the programming language used within ArcView®. This GUI was designed to report back to the user as much information about the chart being displayed as possible. When the extension is loaded, a new button is added to the View Document GUI. The code behind this button presents the user with a directory navigation dialog box for selecting the BSB image to be displayed. If the chart projection is Mercator and the LTS has not been set for the current View, the user is presented an input box for entering the LTS. Two recommendations are suggested for setting the LTS, zero and the LTS as read from the chart. If the chart contains a skew parameter, a message box is presented to warn the user that it will take additional processing time to display this image. Next, the user is presented with a message that reports information about the chart to the user. This information includes the name and scale of the chart and projection parameters for the chart. This information is also written to the Comments section of the image’s Theme Properties. Finally, if the Projection Parameters have not been set for the current View, the user is presented with the option of setting these parameters, based on the information contained in the chart header.
Limitations
All charts are displayed using the projection parameters which are reported in the chart header and are taken directly from the original paper charts.
In order to overlay other data sets, these data sets must be in the same projection as the chart or stored in Decimal Degree coordinates. If the data is in Decimal Degrees, the appropriate View Properties must be set for data to overlay properly. If data exists in the same projection as the chart it may be overlaid without setting the View Properties.
ArcView® only records the location of the upper left cell and pixel size the first time the image is opened in a view and stores this information for future use. This means that it is difficult to change the Latitude of True Scale for a View after it has been set. Images with different projections will not be displayed properly within the same View.
ArcView® does not support a Polyconic projection, so that to overlay vector data on these charts, the vector data must be in the same Polyconic projection as the chart. Polyconic charts are generally only found in the Great Lakes region.
Future Development
The developers at NOAA are working on software that will allow users to change the projection of the BSB-formatted image file of a chart. The user would be presented with a number of common projections. The image file will be reprojected based on user input and written as a new image to the user’s hard drive in the BSB format. Thus, the chart will overlay with the users existing database. This will be of great benefit to users who already have an existing database in a certain projection. This same process could be applied to skewed charts to create a non-skewed version for faster display.
Conclusions
This extension provides coastal and ocean resource managers a means of displaying raster NOAA nautical charts in a widely used GIS software package, making this data source readily available to this extended community. These expanded uses include providing both a backdrop for existing data and a means for collecting or updating the user’s vector data. The extension is available on the Esri homepage at http://www.Esri.com or the NOAA Coastal Services Center homepage at http://www.csc.noaa.gov.
Jeffrey Cowen
Technology Planning and Management Corporation, contractor at the NOAA Coastal Services Center
2234 South Hobson Avenue
Charleston, SC 29405
jcowen@csc.noaa.gov
Dr. Kirk Waters
NOAA Coastal Services Center
2234 South Hobson Avenue
Charleston, SC 29405
kwaters@csc.noaa.gov