Active Metadata: Using Metadata to Drive Applications for GIS Data Access and Analysis |
| In many organizations, Geographic Information Systems (GIS) dwells on the edge of mainstream information technology. GIS remains a separate entity, not just another analytical tool. The biggest hurdle to integrating spatial analysis with other systems is data. One of the most annoying problems facing all users of information technology today is getting a handle on data, but for GIS users, it is an everyday struggle. Because spatial data is different, only the creators of data can hope to comprehend attributes. In order to capture and circulate knowledge of data, developing and using metadata seems to be the answer. While metadata can help, its main product is a paper document, which must be stored, searched and referenced manually. This paper will outline an approach to make metadata a more useful and integral part of spatial data analysis. Using ArcInfo Open Development Environment tools, Visual Basic and MapObjects, a suite of tools can be built to find, edit, and store metadata in a database. Building on these tools, applications can be developed and driven by that metadata database. Making metadata an active component of GIS application is Active Metadata. |
| The National Environmental Policy Act (NEPA)
requires Federal agencies to evaluate the environmental impacts of major actions, and
integrate such evaluations into their decision-making processes. The scope of the proposed
action is reviewed to determine the level of NEPA documentation required - categorical
exclusion, environmental assessment (EA), or an environmental impact statement (EIS). The
appropriate document is then prepared by a multidisciplinary team of principal
investigators (PIs). Each PI identifies the existing environment and analyzes the
potential environmental effects of the proposed action and alternatives. A PI may concentrate on one or more of 14 resources, and may need to reference one or more of those resources in their analysis. Each PI may need certain data layers for maps, and may share layers with other users. Land Use investigators, for example, make use of the results of the Noise Impact Analysis. Other data layers are consistently required as base maps. Some data layers can be derived from TIGER or TIGER-derived datasets, but many come from local, state or other agencies. Datasets from a variety of sources, in a variety of coordinate systems and data formats, must be reconciled to a common datum to fuel analysis and present a coherent message. Each project therefore requires a considerable effort in translation, coordinate transformation and attribute investigation to bring all of the data together. |
Table 1. Common resources investigated during an environmental study.
| Air Quality |
| Airspace |
| Biology |
| Cultural |
| Geology/Soils |
| Hazmat/Waste |
| Health & Safety |
| Land Use |
| Noise |
| Socioeconomic |
| Transportation |
| Utilities |
| Visual & Aesthetic |
| Water Quality |
| An EA or EIS project may need some spatial analysis, but in the end
product, GIS is also utilized as a cartographic tool. Project managers, PIs, clients and
the public respond to maps, not data. Making spatial data useful includes turning the data
into information that is presentable. Maps are often used for public meetings, but the
majority of the maps will go into a report in letter or legal size pages. The PIs know what they want to show in the map, the GIS staff know how to wring maps out of ArcInfo, which makes for an iterative process. PIs describe the maps they want, and the GIS team develops the maps in Arcplot. The draft maps are sent to a plotter, red-lined by PIs, and sent back to edit in Arcplot.. After several iterations, the approved maps are translated and sent to the graphics production staff to place in a document style and format. Using ArcInfo as a primary cartographic tool separates the investigator from the map and reduces productivity. Because project staff do not have GIS tools, they must request paper maps; maps to send away, mark up or use in public displays. Over the months or years of a project, investigators and project managers forget and collect the same data again, or request data or maps they originally obtained through another source. They may also request copies of data or maps which never existed. It is not always possible for GIS staff to know what is available; some redundant effort is avoided, but not all. Both GIS and project staff need tools to help keep track of results, maps and data. To reduce redundancy, we decided to deliver GIS to the desktop. Investigators with direct access to spatial data would be able to experiment with layers and map extents to design the map graphics themselves. They would be more aware of data that is available, missing or incomplete. The tool would also deliver the latest analysis results - attribute tables, frequency tables, buffers, acreages, noise impacts, and so on. Data, results, even documents, could be organized by resource, spatial area and other categories. Documents would be launched in their native applications from a single interface. To drive the application, the collection of data for a project would need intelligence. |
| Spatial data is intelligent, but data collections are not. Every GIS user
has the power to create data, to develop attributes and edit tables, but few attribute
standards exist. Most spatial databases are not normalized. Many GIS users use number
codes for attributes. Few users complete data dictionaries, and even fewer keep their
documentation up to date. The commonly accepted solution is metadata. Metadata is
"data about data." At the very least, it translates the code names used for
attribute columns and file names. To GIS users, metadata is a document that summarizes
what is known about a dataset. In data warehouses, metadata describes where data is, what
it is, and how it is organized. Metadata is a very good idea; if GIS software won't help
users, users can help themselves. The Federal Geographic Data Committee (FGDC) promotes the Content Standard for Digital Geospatial Metadata (CSDGM) to document data being transferred between organizations. The FGDC standard is a content standard stating which elements are required and which are optional. Early implementation attempts produced word processing forms to lay out documentation; they didn't make it any easier to produce and manage it. GIS programmers at the USGS developed the DOCUMENT AML system, providing AML menus to collect metadata. Despite the need for metadata, facilitating tools like DOCUMENT have not been widely adopted. Most private sector and local GIS users still do not assemble metadata regularly. Private-sectior GIS departments often function as service departments, subject to project budgets and requirements. Unless a project is part of a data development contract, managers and clients rarely see any benefits. Metadata and data management are overhead. Different organizations and developers have designed some new tools to help users develop metadata, and the FGDC provides a web page to access some of these tools. The majority of the tools are similar to the DOCUMENT AML system. Some collect metadata from the datasets, the AML directive &DESCRIBE, and provide a utility to collect and store user input. Most store the resulting information in an ASCII text file. Text is better than nothing, but a paper document or text file is just one more thing the user must track down. It is more convenient than asking questions directly of data providers, but a document causes its own problems. The user must store the documents somewhere. Someone must organize them and track down the inevitable unreturned copies. Some developers store metadata in databases which can be searched and normalized for fast access and powerful analysis. Metadata stored in a database can be printed to a variety of formats and reports, but most tools stop there. They are designed to make document production more flexible. The database adds output and searching functions, but provides no new intelligence. Metadata is a good idea, but metadata alone does not solve all data problems. It stores knowledge, but it doesn't add intelligence. |
| With today's technology, GIS software and data formats could include
elements to store and make use of metadata. If it is important to know what a dataset
contains, why is there no data element for comments and identification? If operating
systems track which user created, last modified, or last accessed a file, why shouldn't a
GIS system check and use those attributes? Word processors on personal computers record
comments and user identification inside the documents. Metadata is far more critical to
spatial data, but isn't considered essential in design. The technology exists, but
implementation takes more than techology. It would take an unlikely agreement between
vendors on standards, data exchange, and database formats. The solution, then, is to
develop a shell application to store and use metadata. We can call this Active Metadata,
as opposed to passive, document-based metadata tools. An Active Metadata application must store information about data in a database separate from the GIS software. Separating the database from the data insulates the metadata system from changes in Esri data formats and software. Using a commercial database (in this case, Microsoft Access) assures us that we can find people who can use the database and customize it with macros, form and reports. We can use the database's own tools to produce reports and track project costs. The database should also drive an application to publish data and analysis results to the desktop. The desktop application's purpose is to provide access to project staff who cannot, should not, or will not learn to use GIS software. Some of our planners and project managers have experience using ArcView, but other PIs have never used GIS. While it is positioned as a desktop GIS, ArcView provides a wide array of desktop GIS functions PIs will not use. Like all GIS products, ArcView demands too much knowledge from its users and is unforgiving. Our application interface must work harder. Data access must be intuitive; it must empower users and save them time, not frustrate them and make them jump through hoops.. The interface should help the user to see the data as information, and avoid misusing data.. Since the target platform is Windows 95, Visual Basic 5 was selected for the interface and database segments. Visual Basic supports Access, dBase and other databases and includes tools for data display and table views which use common Windows elements. Because the majority of our data is analyzed and stored in coverages, the GIS component required MapObjects 1.2. MapObjects does not replace ArcView. It does not support all the image formats of ArcView, and has no CADD data support. MapObjects provides no support for projections, but neither does ArcView. The application will need to compensate for the lack of projection support in MapObjects. The desktop application will be a viewer only. Data editing and quality control remain the responsibility of the GIS team. Collecting and reconciling data requires ArcInfo and technical knowledge and experience. GIS analysts will concentrate on data collection, quality assessment, conversions and transformations. Metadata collection from coverages also requires ArcInfo, so a second, "back office" application will assist the GIS team in collecting metadata. The back office GIS application will use the Open Development Environment (ODE) in addition to Visual Basic and MapObjects. |
| Delivering data to the desktop does more than get GIS analysts out of the
drafting business. The GIS staff can spend more time on data accuracy and quality control.
They can capture and store properties in the metadata to categorize data and control
access. Database properties can be used to reduce the risk of giving spatial data to users
unaccustomed to GIS. Competent GIS professionals are aware of common rules of mapping and
analysis, but inexperienced users are not aware of the suitability of data sources and
"just want a map." It is not enough to deliver data. Some rules and practices
should be coded in the metadata. Users need an application that will deliver tools with
the intelligence to use the data properly. As stated above, the main problem is data. The data format for coverages, grids, tins, info files and map compositions is a legacy of ArcInfo's main-frame origins. Coverages store spatial data in one directory and relational tables in one INFO directory for all datasets in a workspace. This data format has doomed decades of Arc users to fight their data in order to use it, but they have adjusted. Windows users without experience will move data around and rename coverages in Windows Explorer. As Arc users know, operating on ArcInfo data in the file system will break the data. If an application will deliver data to casual users, it must conceal obsolete data format from the user. To conceal the data, the metadata must be collected in ArcInfo and stored in a database set up to store and deliver Active Metadata. |
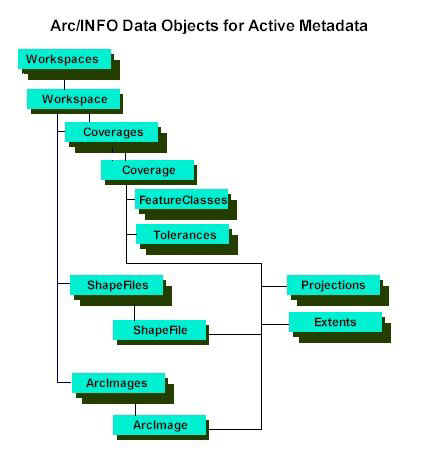
| Both the back office and desktop applications share an Active Metadata database. The overall structure of the database is determined by the object model design. Using the ODE objects as a starting point, a number of ArcInfo-dependent modules were developed to encapsulate methods for finding, creating, recording and editing metadata records. All objects have common members. Each instance of an object has a unique identifier, a Name, and a Display Name. The Name is an internal name and may be a pathname, a URL, or a short name. The Display Name is a descriptive name which can have up to 125 characters. The Display Name is meant to store the name of an object which would be commonly used. All objects are referenced by their Display Name in the desktop application. |
| The main data objects in the ArcInfo application are:
|
Figure 1. Object diagram of objects developed for the back-office application.
| The majority of the metadata is collected using ArcInfo's &DESCRIBE directive, and operating system file information functions. The GIS staff then add the Display Name and identify the source and scale of the data, and record the attribute metadata and citation. Projection and Extent objects are stored in separate tables so they can be shared by multiple data objects. |
Figure 2. GIS Explorer tool viewing the USA Coverages workspace from the sample data collection included with MapObjects and ArcView 3.

| To provide an interface to metadata collection, several tools were developed. First, a browsing tool modeled after the Windows Explorer can be used to browse data folders. The GIS Explorer scans directories as Explorer does, and identifies folders which are coverages, grids, tins, info directories or map compositions. These folders are then excluded from display as folders and are shown in the right-hand window as data files. Other files, such as shape files, images, plotfiles and AMLs are identified with specific icons. Any coverage, shape file, image or other dataset can be launched for edit or viewed by double-clicking or dragging to a viewer application. Metadata is edited through the file properties menu. Properties dialogs for coverages and images display data from the DESCRIBE command in ArcInfo. The shape file property dialog displays data from MapObjects. From the properties dialog, the user has access to comments, projection, source data and any properties the user can define or view. A report function generates an HTML metadata report, including a map graphic. Any changes made in the properties dialog are saved in the Active Metadata database when the user clicks the OK button. |
Figure 3. Coverage object properties dialog.

| In addition to the data source, format and accuracy properties in the data objects, each object also has a DataScale property, which can be set by the GIS analyst in the properties dialog. Selecting from a set of standard scales, the GIS analyst classifies a data object within a range of accuracy and suitability parameters. ArcInfo stores scale only when a projection requires a parameter for the scale at the projection's origin. No Esri data format stores the scale of source data internally. The DataScale property will allow the desktop application to classify themes with similar scales. |
| For the desktop application, we used ArcExplorer as a starting model for the map viewer interface. Much of the interface is intuitive and helpful, but it did not contain everything needed. ArcExplorer still requires the user to know where data is, what the name is, the projection, etc. We will require the application to maintain that knowledge, and to contain rules to prevent the user from making mistakes out of ignorance. Another option considered was implementing an Internet map server, but it was rejected. Internet map servers are expensive and slow, and the technology for delivering GIS over the internet is immature. The application could be delivered as an Intranet data viewer using an ActiveX document, but the advantage of ActiveX documents is remote installation. Installing an application remotely to 20 users in a single office has little benefit. |
| The goals of the desktop application were defined, in order of priority:
|
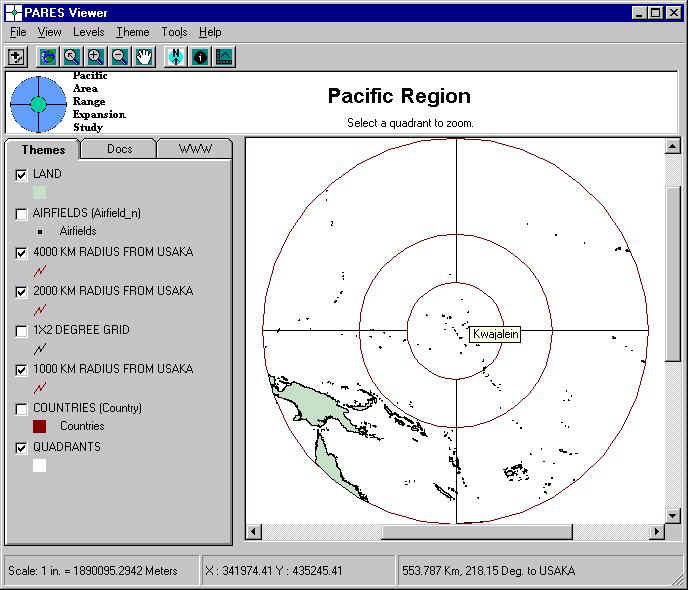
| These goals are interdependent. To provide access, we needed to organize the data. To increase awareness, we needed to provide access. The foundation is the Active Metadata database collected and managed by the GIS analysts. Because ArcInfo is not available to the viewer application, new objects were developed to model data and data management. Some objects are wrappers around MapObjects objects or adaptations of objects used in MapObjects demo applications. Most were developed from the PARES Viewer application. The PARES Viewer application was developed by EDAW under contract to the U.S. Army Space and Missile Defense Command (USASMDC) Installations, Logistics, and Environment Office. The viewer was developed as a part of the Pacific Area Range Expansion Study (PARES), a coarse site screening of islands in the Pacific Ocean. The coarse criteria resulted in over 7,000 candidate sites, but no further criteria were available. Rather than conduct a comprehensive survey of all sites, EDAW proposed building a CD-based data browser built on MapObjects and Visual Basic. GIS datasets, documents and web page links used during the initial screening were cataloged in a database. The study area was divided into scopes, or levels of detail, with the top level including the entire study area. Each quadrant of the study area was defined as a second-level scope, and each country in the area was defined as a third-level scope. Data, documents and links were categorized by subject and scope, so the application could present only that information which applied to the user's area of interest. |
Figure 4. PARES Viewer main window.
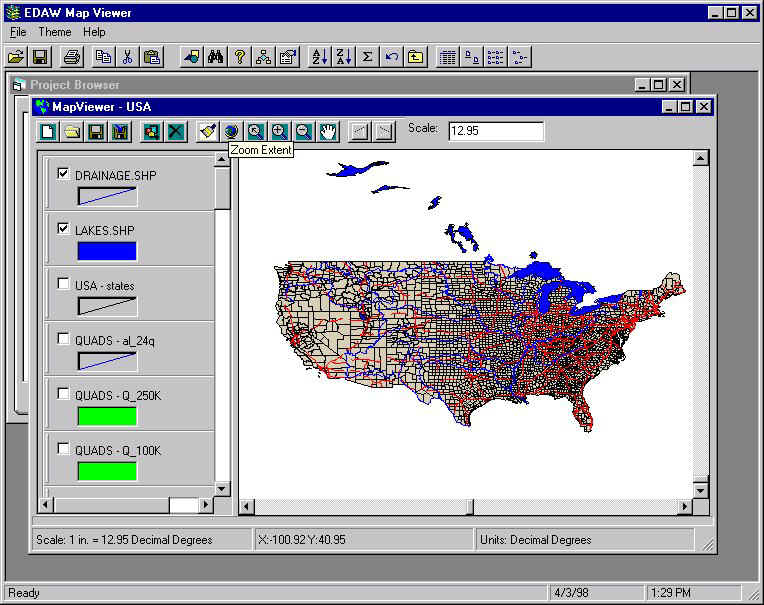
| The PARES Viewer was built without using objects. Adding objects to enhance the data management and interface, we built the ProjectSpace data browser. ProjectSpace uses an Access database file as a project database containing all metadata and data management objects for a single project. The metadata collected by GIS analysts is stored in the project database, and the desktop application accesses that metadata to deliver data and make use of the data. ProjectSpace does not require pre-defined views as the PARES Viewer did, but gives users the choice of default or custom views. Default views are created and maintained by the project manager and GIS team as the official views to be exported to documents. The user is able to create and customize as many views as desired. |
| The data objects on the ArcInfo side of the system have certain common interface elements, and are managed on the viewer side as a single class. MapObjects needs only slight variations between loading and using map layers, whether the layers are made from workstation coverages, PC ARC/INFO coverages, shape files, or images. This data flexibility makes it possible to hide the data formats behind a Theme object. Themes, along with other bits of information, make up the major data objects for the desktop:
|
Figure 5. Metadata objects for the desktop application.

| Using MapObjects, the desktop application gives access to datasets, but hides data formats and other GIS hurdles. Coverages and shape files simply appear as Themes. Images are Themes, or part of image catalogs. Pathnames are hidden. The data is referenced as elements in a single database, indexed by a number of descriptive attributes. The data is not only easier to find by query, but the desktop application narrows the search by removing data unsuitable to the user's current focus. Only data the user can actually use is made available. Each Theme has an Extent property. When a user clicks the button to add a Theme, the application searches the metadata and lists only those Theme objects whose extents intersect the extent of the View. There is no need to remember which workspace is in which area, or to use codes to reference data location. The user does not need to comb the server trying several files in search of data in the area of interest. The application will query the database and show the user what is available. The DataScale property classifies a Theme object for accuracy and suitability with other themes. Although 1:250,000-scale data should never be used with 1:24,000-scale data, no GIS application prevents the user from displaying them together on a map. When ProjectSpace queries the database for data themes within the area of interest, it also compares the DataScale to the MinimumScale and MaximumScale properties of the View and lists only those Themes within the range of acceptable scales. The application will also restrict the display of coordinates by scale. Views and Themes all have Projection properties. When querying the database for themes, ProjectSpace also searches for matching projections. There is no need to load a map layer only to discover that it is the wrong projection, hundreds of thousands of map units away. The user need not browse directories deciphering filenames for projections. The user has the option to load images into the map viewer as single Themes or as image catalogs. Using the Extent and properties of Image objects, the application can load and unload images, and turn them on and off as the user pans and zooms. Using the DataScale property, images may be added or removed as the View map scale changes.. |
Figure 6. The ProjectSpace application. ToolTips on controls and MapLayers identify features and prompt users.
| Developing metadata solves some problems with data knowledge. Storing
metadata in a database opens a world of possibilities. Driving applications with metadata
make it possible to deliver GIS data and functions while reducing effort and errors common
to GIS use. Some future enhancements, such as grid, TIN or CADD support, depend upon the
GIS component software vendors. There are, of course, bugs to be fixed in the development
environment, as in all programs. There are also objects and data models in certain tools
that seem designed to confuse developers. It is up to vendors to fix problems and move
ahead. It is up to developers to choose the technology that best meets their requirements. The GIS team application needs more access to ArcInfo processing functions. From the command syntax for ArcInfo, a dialog builder can be developed to get arguments for a specified operation. The GIS application may need a server module to allow desktop users to perform overlays and other processing from the desktop. Current plans include enhancing and incorporating CoolEdit from the ODE sample applications. The data management operations could also be improved, if backup and conversion modules were added. Planned enhancements to ProjectSpace include implementing map library and coordinate conversion objects. Using ProjectSpace as a client to server-based GIS programs will be evaluated. The desktop application may also be integrated with other document management and data development tools to make data access more seamless to the user. An Internet solution could also be implemented; it would need to deliver vector data at an acceptable speed, and a reasonable cost. Embedding data knowledge and good-practice rules in an application can make GIS more user-friendly and economical without putting GIS users out of work. Software and data designers could make our lives easier by agreeing on neutral data standards and including standard metadata elements in their data file definitions. However, software vendors design for a larger market, and after-market developers design more specific tools. It may be time to start designing applications for people who would not otherwise use GIS. |
Tim Rourke
GIS Analyst
EDAW
200 Sparkman Drive, Suite 1
Huntsville, AL 35805
Phone: (205) 430-5560
Fax: (205) 430-5561
rourket@edaw.com
http://www.edaw.com