Dr Mahmoud BOUZELBOUDJEN, Francesco KIMMEIER
The aquifers of the Rh�ne valley in Switzerland are of great economic importance. The groundwaters are exploitable at slight costs. However, their situation make them specially vulnerable. The aim of this paper is to give a brief outlook on the methodology to build a very powerful three dimensional hydrogeological model. This model will be used by the community of Valais as a tool for the management and protection of the groundwater. ArcInfo [9] and ArcView [10] are employed as geographic information system and Oracle [15] and Access [1] as database management system on workstation and personal computer. The advanced geostatistical treatment of spatial basic data is carried out through several techniques (Surfer [17], Isatis [11] and ArcInfo). The 3-D hydrogeological mathematical model are based on the finite element method (Feflow [7] and FEN derived from FEM 301 [14]).
Key-Words : Database, GIS, Geostatistics, Groundwater modelling.
1. GIS RASTER AND VECTOR DATABASE
This paper is determined centred on a visual approach than a verbose presentation. Technical aspects of numerical modelling are not developed in details in this paper, they can be consulted in Kir�ly (1985), Bouzelboudjen & al (1997) and Eisenlhor & al (1997).
The aquifers of the Rh�ne valley in Switzerland Figure 1 are of great economic importance. The groundwaters related to the Rh�ne can easily be reached and therefore are exploitable at slight costs. However, their situation in generally narrow valleys Figure 2 with high human activity (industries, agriculture, roads and highways) make them specially vulnerable, in regard to quality (industrial and/or agricultural pollution) as well as to quantity (local or regional disorders due to certain structures). Since 1995, the State of Valais has decided to integrate the data of numerous local studies (water supply, hydro-electric and geotechnical installations) into a more regional hydrogeological context.
The aim is to build a 3-D hydrogeological model in the area of Visp describing the geometry of aquifers and aquitards Figure 3, their lithologies, their hydrodynamical characteristics (permeability, porosity and storage coefficient) as well as the hydrochemical parameters in order to obtain a water supply management and forecasting tool. The data to carry out this project were provided by 139 boreholes and 382 piezometers, Figure 4.
The procedure from data acquisition to a useful 3-D hydraulic model is represented in the flow chart of the Figure 5. It shows that the 3 main steps are the realization of the GIS raster and vector database, the data treatment by Geostatistics procedure and the realization of the 2-D and 3-D hydraulic model.
We employed ArcInfo-ArcView as geographical information system and Oracle-Access database management system on workstation and personal computer. Presently, ArcInfo-ArcView and Oracle-Access database allow to preserve and to manage the differents information levels 2-D maps and profiles. The drawing-up of automatic sections for multilayers systems provides an easy checking of the 3-D geometry of the hydrogeological model (tin and grid modules of ArcInfo through AML scripts).
2. GEOSTATISTICS APPROACH
In order to build a coherent hydraulic model several variables (e.g lithology data and permeability) only locally known must be regionalized before to be injected in the model. This data treatment is carried out with several methods (Isatis and Surfer). Figure 6 shows the advanced geostatistical treatment of spatial basic data (stationary, non stationary and simulation methods) relative to the geometry and hydrodynamic characteristics of the aquifer system.
The first step (exploratory analysis) in performing the Geostatistics approach is to determine if the data set respect the stationarity hypothesis. A random function is stationary if:
Figure 7 shows the variogram of two different variables. Log T (transmissivities) respects the stationarity hypothesis when hydraulic potential doesn't. Therefore it is possible for the first one to fit a model of variance when for the second one we must replace this step by the generalized covariance. The last step give us a generalized variable that can be used for modelling purpose Figure 8 and Figure 9.
In order to have more accurate results a probabilistic approach has been performed that give us instead of a deterministic field of our variable a set of fields that can be then injected in the model. The results of the model can then be expressed by probabilities rather than by a deterministic solution. Figure 10.
New piezometers allowed in a certain way to control the reliability of the geostatistical analysis results and shows the importance of the interpolator in the rebuilding of the different structural layers. Once the geostatistical analysis has been carried out, the linking from a regular network to the irregular finite elements grid constituing the model network requires the implementation of specific interfaces [2].
3. THREE DIMENSIONAL GROUNDWATER MODELLING
The software Feflow used to generate and to run the calculations is a 3-D mathematical finite elements model developped by Wasy GmbH. In order to calibrate the model the output of the model (simulated potentials and fluxes) are compared to real data measured on the terrain. Figure 11 shows the location of the measurement points of these reference values ([16], WOLGA database - CREALP).
To generate the 2-D finite elements mesh the main river (Rh�ne) and the main canals (Brigerbaldkanal and Grossgrundkanal) are taken in account Figure 12. The potentials estimated by the Geostatistics approach are imposed as boundary conditions along the West and Est limits of the model and along the Rh�ne river and the 2 canals. The transmissivities also estimated by Geostatistics (5 simulations) were injected into the 2-D model. Figure 13 shows the simulated potentials of one run. It shows clearly the zones where the main river and canals have a drainage role as the zones where they rather have an injection role. Figure 14 also shows these zones by representing the simulated flux vectors and allow to estimate the relative quantity of water that is drained or injected [16].
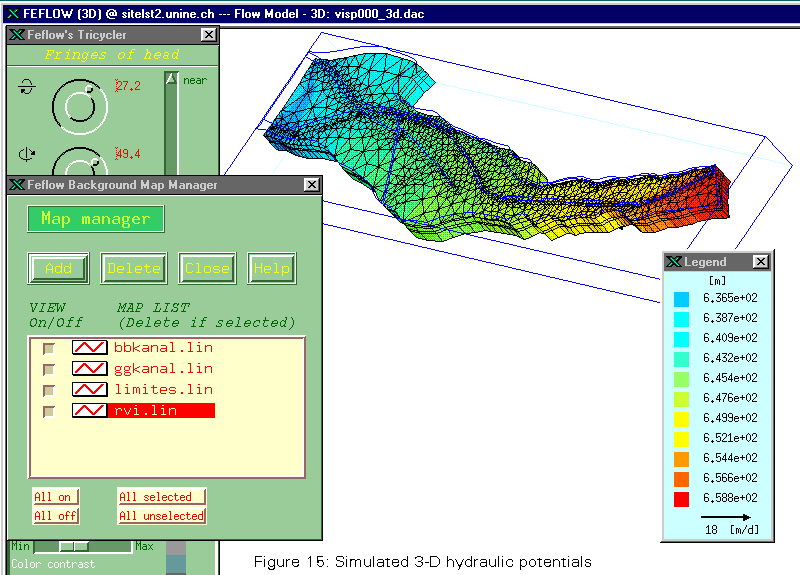
The 2-D model representing the upper gravel give us a first interpretation of the flow systems and fluxes. But it is illusory to calibrate this model without taking in account the role of the aquifer of the lower gravels. Therefore the complex aquifer was modelized in three dimensions. Figure 15 shows a result for one simulation obtained by Geostatistics. It can be noticed that Feflow is nearly connected to ArcInfo procedures, the Map manager allow to visualize points, lines or polygons shapefiles.
Figure 16 shows the complexity of the 3-D simulated pathlines. Watching this kind of picture it is clear that it is dangerous to handle in 2 dimensions phenomenon that occurs in 3 dimensions. A pathline can cross all layers towards the surface and then again cross these layers towards the bottom of the model. Figure 17 shows this kind of pathline and Figure 18 its projection on a vertical plan.
4. CONCLUSION
This project allowed to developp a rigorous methodology in elaborating powerful tools for the management and the protection of groundwater. These tools give the possibilities and limits in integrating and interfacing the hydrogeological models and the GIS. In this way, the integration of new data in the GIS will ensure a control of the coherence of the groundwater flow system representation. All these informations can help in studying the natural evolution of the water system and the impact of the human activities through a really integrated approach.
5. REFERENCES
[1] ACCESS, (1997). Microsoft Access for Windows 95. Microsoft Corporation. USA.
[2] Bouzelboudjen M., (1991). 3-D Modelling of the Rh�ne aquifer at Visp (Valais, Switzerland). In: Computer Methods and Water Resources CMWR91, 4th Volume, 2nd International Conference Rabat - Morocco, 7-11 October 1991 + In: Bulletin du Centre d'Hydrog�ologie de l'Universit� de Neuch�tel, Suisse, n�10 pp. 83-90.
[3] Bouzelboudjen M., Kir�ly L., Kimmeier F., Zwahlen F. (1997). Repr�sentation sch�matique des �coulements souterrains en Suisse. Profils hydrog�ologiques issus de mod�les math�matiques 3-D � �l�ments finis. Planche 8.3 de l'Atlas Hydrologique de la Suisse. Institut de G�ographie de l'Universit� de Berne, Office F�d�ral de la Topographie et service Hydrologique et G�ologique National, Berne, Suisse.
[4] Chauvet P. (1993). Processing Data with a Spatial Support : Geostatistics and its Methods. Cahiers de G�ostatistiques, Fascicule 4, Centre de G�ostatistique, Fontainebleau, France.
[5] Delhomme J.-P. (1978). Kriging in the hydrosciences. Advan. Water Resour., 1 (5), 251-266.
[6] Delhomme J.-P. (1979). Spatial Variability and Uncertainty in Groundwater Flow Parameters: A Geostatistical Approach. Water Resour. Research, Vol 15, 2 269-280.
[7] Diersch H.-J. G. & al. (1997). Interactive, Graphics-based Finite-Element Simulation System FEFLOW for Modelling Groundwater Flow. Contaminant Mass and Heat Transport Processes. User's Manual Version 4.6. WASY Institute for Water Resources Planning and System Research Ltd Berlin.
[8] Eisenlhor L., Bouzelboudjen M., Kir�ly L., Rossier Y., (1997). Numerical versus, statistical modelling of natural response of a karst hydrogeological system. Journal of Hydrology 202, 244-262.
[9] Esri (1995). Understanding GIS. The ArcInfo Method. Version 7 for Unix and Open VMS. Environmental Systems Research Institute, California, USA.
[10] Esri (1996). ArcView GIS, The Geographic Information System for Everyone. Environmental Systems Research Institute, California, USA.
[11] ISATIS (1997). Isatis - The Geostatistical Key, version 3.1. Geovariances, Paris.
[12] Meijerink Allard M.J. & al.(1994). Introduction to the use of geographic information systems for practical hydrology. UNESCO International Hydrological Programme, Publication Number 23.
[13] Kimmeier F. (1999). Geographical Information System, Geostatistics approach and three-dimensional simulation for groundwater management and protection in alluvial field: An integrated approach. PhD Thesis. University of Neuch�tel. Project FNRS, CREALP-CHYN.
[14] Kir�ly L. (1985). FEM 301 - A Three Dimensional Model for Groundwater Flow Simulation. Technical Report 84-49. NAGRA.
[15] ORACLE (1994). Oracle version 7. User's Guide and Reference. Oracle Corporation, ReWood City, CA, USA.
[16] Oukaci S. (1997). SIG, G�ostatistique et Simulation Num�rique des Ecoulements Souterrains. Application au Syst�me Aquif�re de la Plaine du Rh�ne (Valais, Suisse) (D�cembre 1997). Master Thesis, 25p. Universit� de Neuch�tel et Ecole Polytechnique F�d�rale de Lausanne. Projet FNRS CRSFA-CHYN.
[17] SURFER (1996). Surfer for Windows, User's guide, version 6.04, Golden Software, Inc.
6. LIST OF FIGURES
Figure 1 : Situation of the study area (Baltschieder - Gamsen, Valais, Switzerland).
Figure 2 : Digital Elevation Model (raster 25x25m) of the study area (Baltschieder - Gamsen, Valais, Switzerland).
Figure 3 : Lithology of the study area (Baltschieder - Gamsen, Valais, Switzerland.
Figure 4 : Location of the 139 boreholes and the 382 piezometers.
Figure 5 : Linkage between the GIS raster and vector database, the Geostatistics treatment and the 2-D and 3-D hydraulic models.
Figure 6 : Spatial procedure treatment of hydrogeological data with a Geostatistical approach.
Figure 7 : Experimental variogram and model of Log T and experimental variogram of hydraulic potential of upper gravels.
Figure 8 : Log T of upper gravels: Estimation and errors.
Figure 9 : Hydraulic potentials of upper gravels: Estimation and errors.
Figure 10 : Conditional simulations (Turning bands) of Transmissivity (x10E-4 m2/s) and probabilities of upper gravels (raster 25x25m).
Figure 11 : Boundary conditions for the 2-D hydraulic model.
Figure 12 : Hydraulic model 2-D mesh.
Figure 13 : Simulated 2-D hydraulic potentials.
Figure 14 : Simulated 2-D fluxes.
Figure 15 : Simulated 3-D hydraulic potentials.
Figure 16 : Simulated 3-D pathlines.
Figure 17 : Simulated 3-D pathline and isochrones.
Figure 18 : Pathline of the fig. 17 projected on a vertical plan.
7. ACKNOWLEDGMENTS
A thanks to FNRS that has financed this study (project n� 20-47064.96) and the team of CREALP (Director J.-D. Rouiller, Pascal Ornstein and J.-M. Rey) that has supported this project and provided the data used in this study.
A thanks to Office f�d�ral de la topographie that has provided the DME of the Visp region.
A thanks to central computing facilities team and specially to F. Burri and J.-P. Maradan for their advices provided during the realization of this work.
Authors Address