The Use of GIS and Digital Orthophotography for Management of Santa Ana Pueblo Tribal Lands
Presiliano Pino- Pueblo of Santa Ana
John Peterson-Earth Data International of New Mexico
The Pueblo of Santa Ana is located in north central New Mexico 20 miles north of Albuquerque. Santa Ana lies in close proximity to the cities of Albuquerque and Rio Rancho, two of the fastest growing cities in the state. As one of several Pueblos located in the Rio Grande Valley effected by regional growth, Santa Ana is facing many issues that require planning for future development and for the preservation of its natural resources. This paper addresses the use of Geographic Information System (GIS) technology and Digital Orthophotography for land management at Santa Ana Pueblo. For more information regarding Santa Ana Pueblo visit us at:
Introduction
The Pueblo of Santa Ana is located in North Central New Mexico 20 miles north of Albuquerque and borders Rio Rancho to the south (figure 1). Santa Ana is one of several pueblos situated in the middle Rio Grande Valley and lies near the confluence of the
Figure 1 - Location of the Pueblo of Santa Ana
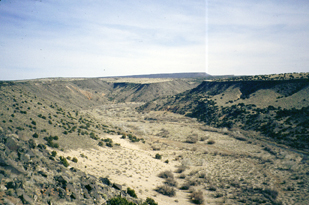
Figure 2 - View looking over the Jemez River
Rio Grande and Jemez Rivers. The Pueblo has existed at the present site since the mid 1500's. Santa Ana is one of five Keresan speaking pueblos in the area. The ecosystem is a semi-arid high desert environment with rangeland grasses and pinion/juniper on the basaltic mesas (figure 2). Along the Rio Grande, the cottonwood forest (bosque) is mixed with non-native invasive tamarisk and Russian olive. Like most communities in the desert southwest, water is the Pueblo's most precious resource. Santa Ana encompasses 77,000 acres within its boundaries with approximately 1050 acres of irrigable farmland on the east side of the Rio Grande and 1500 acres of commercial land on the west side zoned for development. The balance of Santa Ana's land holdings is rangeland used primarily for cattle grazing. The population is 685.
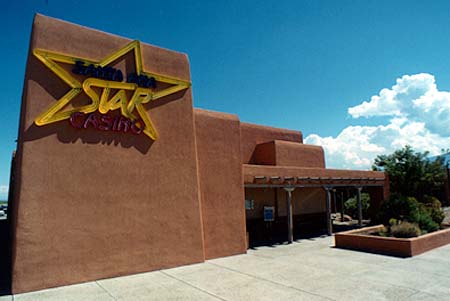
Figure 3 - Santa Ana Star Casino
Since the early 1980s the Pueblo has actively pursued a strategy of developing tribal enterprises, seeing economic independence as crucial to maintaining and safeguarding traditional concepts and values. The tribe now operates a gaming casino (figure 3), and a 27 hole golf course (figure 4). The protection of tribal natural resources and the ability to manage development are seen as keys to maintaining tribal culture and sovereignty. GIS has been used extensively since 1996 for natural resource inventories and boundary mapping. The role of GIS has continued to expand since initiated and is now being used for land-use planning and for spatial database management of municipal water, sewer and utilities information.
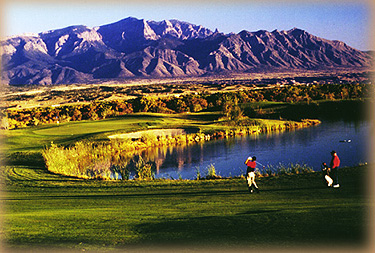
Figure 4 - Santa Ana Golf Course
By necessity the pueblo is making strides to bring their planning capacity up to speed with surrounding municipalities that have historically had a tax base for land-use planning and other services. With revenues from casino gaming now available, Santa Ana is building the capacity to better manage their land and resources. As a logical starting point for planning and baseline studies, natural color digital orthophotography was produced for approximately one third of the pueblo.
Previous Data Sources
Prior to the use of digital orthophotography, Santa Ana relied primarily on relatively small scale data sources (1:24,000) from federal and state agencies and GPS data collection; all vector based. Raster based data included a 1995 Landsat Thematic Mapper satellite scene used for a background base map for regional planning. With the completion of 1" = 200' orthophotography and contour mapping, data is now being used by the pueblo's Natural Resources Office and by architectural and engineering consultants involved in planning and new development projects.
Digital Orthophotgraphy Production
Recognizing the need for larger scale digital orthophotography, Santa Ana Pueblo GIS personnel turned to EarthData International of New Mexico, to produce both color digital orthophotography and topographic mapping for 39 square miles (approximately 25,000 acres) of Pueblo land. Because airborne GPS was used, only 6 points were required for ground control. The area captured included all farmland holdings, business enterprise areas, and some bordering rangeland. Natural color photography was collected from a flight height of 6,000 ft. above ground (1:12,000 scale). The area in question included 60 exposures (ten flight lines with six exposures each) and was processed by the method described below into 1"= 200', 1 ft. pixel resolution color digital orthophotography with 5 ft. contours for the development area and 10 ft. contours for the remainder of the area flown. All photogrammetry was produced by softcopy mapping processes.
Summary of Softcopy Mapping
Softcopy photogrammetry refers to the automated realm of processes previously performed via opto-mechanical devices such as stereo plotters, point marking tools, and photo labs with large format copy cameras. Due to research and development coming out of the defense community, and more recently, the motion picture industry, raster scanners, work stations, and powerful software have now redefined the science of photogrammetry. This marriage of technologies has brought the power of rapidly generated and highly accurate mapping, to the doorstep of end users. When softcopy techniques are integrated with technology such as Airborne Global Positioning Systems (ABGPS), which automate, and drastically reduce, the labor and time intensive tasks of surveying ground control panels, additional time and resource savings are also realized.
The Project and Processes
The specific processes required to accomplish this digital orthophoto project included, in sequential order: Airborne GPS/Photo acquisition, Photo scanning, Triangulation, Autocorrelation, Editing, Mosaicking, Vector extraction (point, line, and area features), Sheet formatting (Tiling), and CD production.
The Photo Mission and Airborne GPS
To initiate the project, a flight plan was prepared by digital means to conduct the aerial photo mission The mission was flown with an aerial camera calibrated by the USGS. Airborne GPS was used for this mapping project. Only 6 control points were required for flying the 39 square miles. Airborne GPS saves between 50-85% of the effort of traditional gound control practices while still meeting or exceeding, National Map Accuracy Standards. Upon completion of the mission, the GPS data is processed using precise differential software that combines the ground tracked and airborne phase measurements. This method provides horizontal and vertical control to between 5-10cm accuracy. EarthData has over 8 years of experience with this technology.
Film Scanning
After acquisition of the color aerial photography, diapositives (mylar contact prints) were generated and scanned by a calibrated photogrammetric scanner at resolutions of approximately 20 microns or 1270 pixels per inch. Digital data was then transferred to magnetic tape media for softcopy processing.
Aerial Triangulation (AT)
Once the diapositives were scanned aerial triangulation was initiated. Aerial triangulation is the process by which each stereo model’s orientation is derived. In the softcopy world, mensuration is computer aided by image matching techniques. The semi-automated AT process increases throughput while also increasing accuracy. Individual points are matched by an algorithm designed to look at digital patches of imagery, common to both diapositives, thereby eliminating errors caused by operator interpretation. It is our experience that this process is approximately 30% more accurate than its conventional counterpart.
AutoCorrelation (AC)
Following the aerial triangulation adjustment, digital stereo models are created. The objective of this process is to create a digital surface from the stereo models which represent the real world. The Softcopy method uses a batch program without operator intervention. AC is the process by which the computer matches patches of imagery on each side of the stereo pair and when it determines the imagery to be similar enough it calculates the positions of the patches and goes through the photogrammetric equations (collinearity) to calculate a 3 dimensional coordinate. This process is done 10’s of thousands of times for each stereo pair with the result being a grid of mass points throughout the model. Mass points are the calculated heights of the objects that the pixel patches represent; be they dirt, concrete, bush, tree or building. If the particular item is not on the ground (having all of your points on the ground is what you’re striving for to create a surface), i.e., a tree or building, that data point must be edited by a stereo capable operator to "push" the point down to the ground or delete it. Terrain break lines are also added in this stereo phase where required.
Digital Orthophotography and Mosaics
In softcopy, all setup issues have already been performed by the time the surfaces have been completed, hence, only the rectification process is needed to complete the orthophoto product. As a result, the additional cost to produce digital orthophotos, in a softcopy environment, is significantly less than adding them to a conventional photogrammetric workflow. After orthorectification has been completed, it is a necessary QC step to visually edge-match all adjacent orthophotos to each other. Using the hardware born out of Hollywood, we are able to digitally mosaic hundreds of digital orthophotos at a time. Radiometric (tone & color) corrections are performed by image histogram analysis and applied across the entire mosaic. Because the mosaic is digital, it is also possible to resample it to any pixel size for display at various scales and as a backdrop to any GIS data.
Vector capture
Most design databases include vector information such as road details, buildings, parcels and drainage features. The features are traced in the instrument by tracing each feature and then displayed on a graphics workstation in close proximity to the instrument itself. In softcopy, the vectors, including the contours are superimposed in color and in 3-D, on top of the stereo image, all on one workstation’s screen. Therefore, as soon as the operator digitizes a feature it immediately appears on the imagery displayed on the workstation. This workflow aids in the QC process because all vectors are dynamically updated when changes are made. Standard off-the-shelf CAD packages are used to collect and manipulate the vector information, as has been done traditionally.
Digital Output
Final products for Santa Ana were delivered on CDs. In this step, the mosaic is tiled into indexed files of managable size. Delivery format for the digital raster products was 5,000 x 5,000 pixels, per tile (75 megabyte files) and 8 tiles per CD. All vector data accompanies each respective raster file. We find that this is a manageable size and format for quick display when using desktop CAD or GIS systems.
Hardcopy Output
To provide a working set of 1"= 200' maps for the pueblo, EarthData International used ArcView and an HP 2500, 600 DPI plotter to produce 54 full color map sheets. We have found ArcView to be exceptional at handling the large sized raster files generated by digital orthophotography.
Santa Ana's Current GIS System
The pueblo GIS is presently run on a Sun Sparc 5 in a Sun Solaris environment. The GIS modules consist of ArcInfo, Grid, Tin, and ArcView. Spatial Analyst will soon be utilized for modeling of natural resource studies. Plans call for porting to Windows NT in the fall of 1998. ACCESS is being evaluated for database management linking to ArcView. Plots are generated on a HP Design Jet 755CM. The GIS group also maintains two Trimble Geoexplorer II Global Positioning System (GPS) units for field data collection.
GIS and Natural Resources
Water Rights and Agricultural Farmlands
The most important natural resource on pueblo land is water. The pueblo is now in the process of quantifying its water rights. In this arid land of New Mexico water is an extremely valuable natural resource. Santa Ana's GIS will be used to map irrigable land and other water usage on the pueblo. This mapping will involve heads-up digitizing of irrigated fields (farmland) from the Digital Orthophotography using ArcEdit, (figure 5). GPS will also be used for parts of this project.
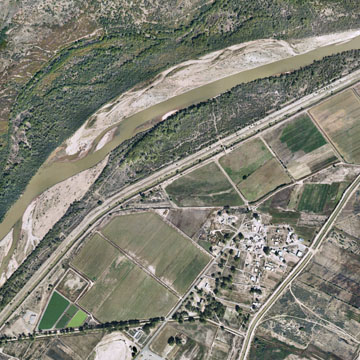
Figure 5 - Sample of 1ft. pixel digital orthophotography
The quantification effort is a very complex legal and technical process and the GIS will play an important role in this endeavor. The farmland coverage will also be used by tribal planners to locate suitable lands for placement of new pueblo housing. The goal is to build housing in areas outside of potentially productive farmlands.. Part of the process of mapping active farmlands will be to map the irrigation ditch infrastructure and turnouts which supply the various fields.
Water Quality
Stream water quality in the lower Jemez River is being studied by the Santa Ana Natural Resources Office staff (figure 6). Stream profiles are being set up along the river and
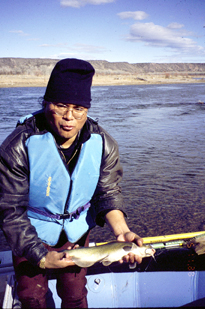
Figure 6 - Fish specimen collected as part of water quality study
GPS and GIS are being used to map location and attribute data in conjunction with the digital orthophotography base (figure 7).
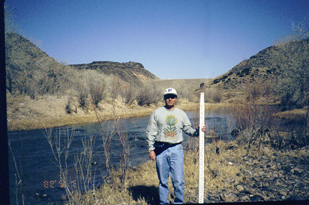
Figure 7 - Stream profile surveying
Bosque (Forest ) Improvement Project
Santa Ana Natural Resources Office personnel are conducting a bosque improvement
project along the Rio Grande. This process involves removal of non-native vegetation species such as the salt cedar (tamarisk) and Russian olive which have crowded out the more desirable cottonwood ( figure 8).
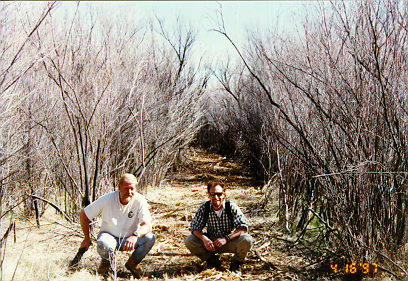
Figure 8 - Cleared swath of Salt Cedar in Santa Ana bosque
Replantings of cottonwood and other desirable species will lead to a healthier plant and wildlife habitat for this area. To determine areas suitable for re-vegetation, soil salinity samples are collected and analyzed. A vegetation potential map based on salinity contour values has been produced to assist in this analysis. Soil sample points were collected using GPS and processed using the various Esri modeling techniques to produce contour maps and 3-D visualization of the data Figure 9. Further activities will also be conducted on the lower Jemez River.
Rangeland/Watershed Management
The Santa Ana Natural Resources Office will be conducting rangeland studies that will be used to develop improved grazing and wildlife management practices. Improvements to rangelands will have many benefits and lead to a healthier watershed by reducing runoff and non point source pollution from sediments. GIS will be used to map range unit boundaries and physical features like water wells and stock tanks. Plans are to conduct further flights using multispectral sensors and natural color photography to produce digital data for all rangeland areas not previously captured in the first flight. Vegetation classification is planned for this area using a combination of field vegetation studies and ERDAS vegetation classification techniques. This data will be used to produce a vegetation coverage for the Pueblo's GIS. Soil maps from Natural Resource Conservation Service (NRCS) will be utilized when they become available in final ArcInfo format. Santa Ana is presently working with NRCS to acquire this valuable soils data.
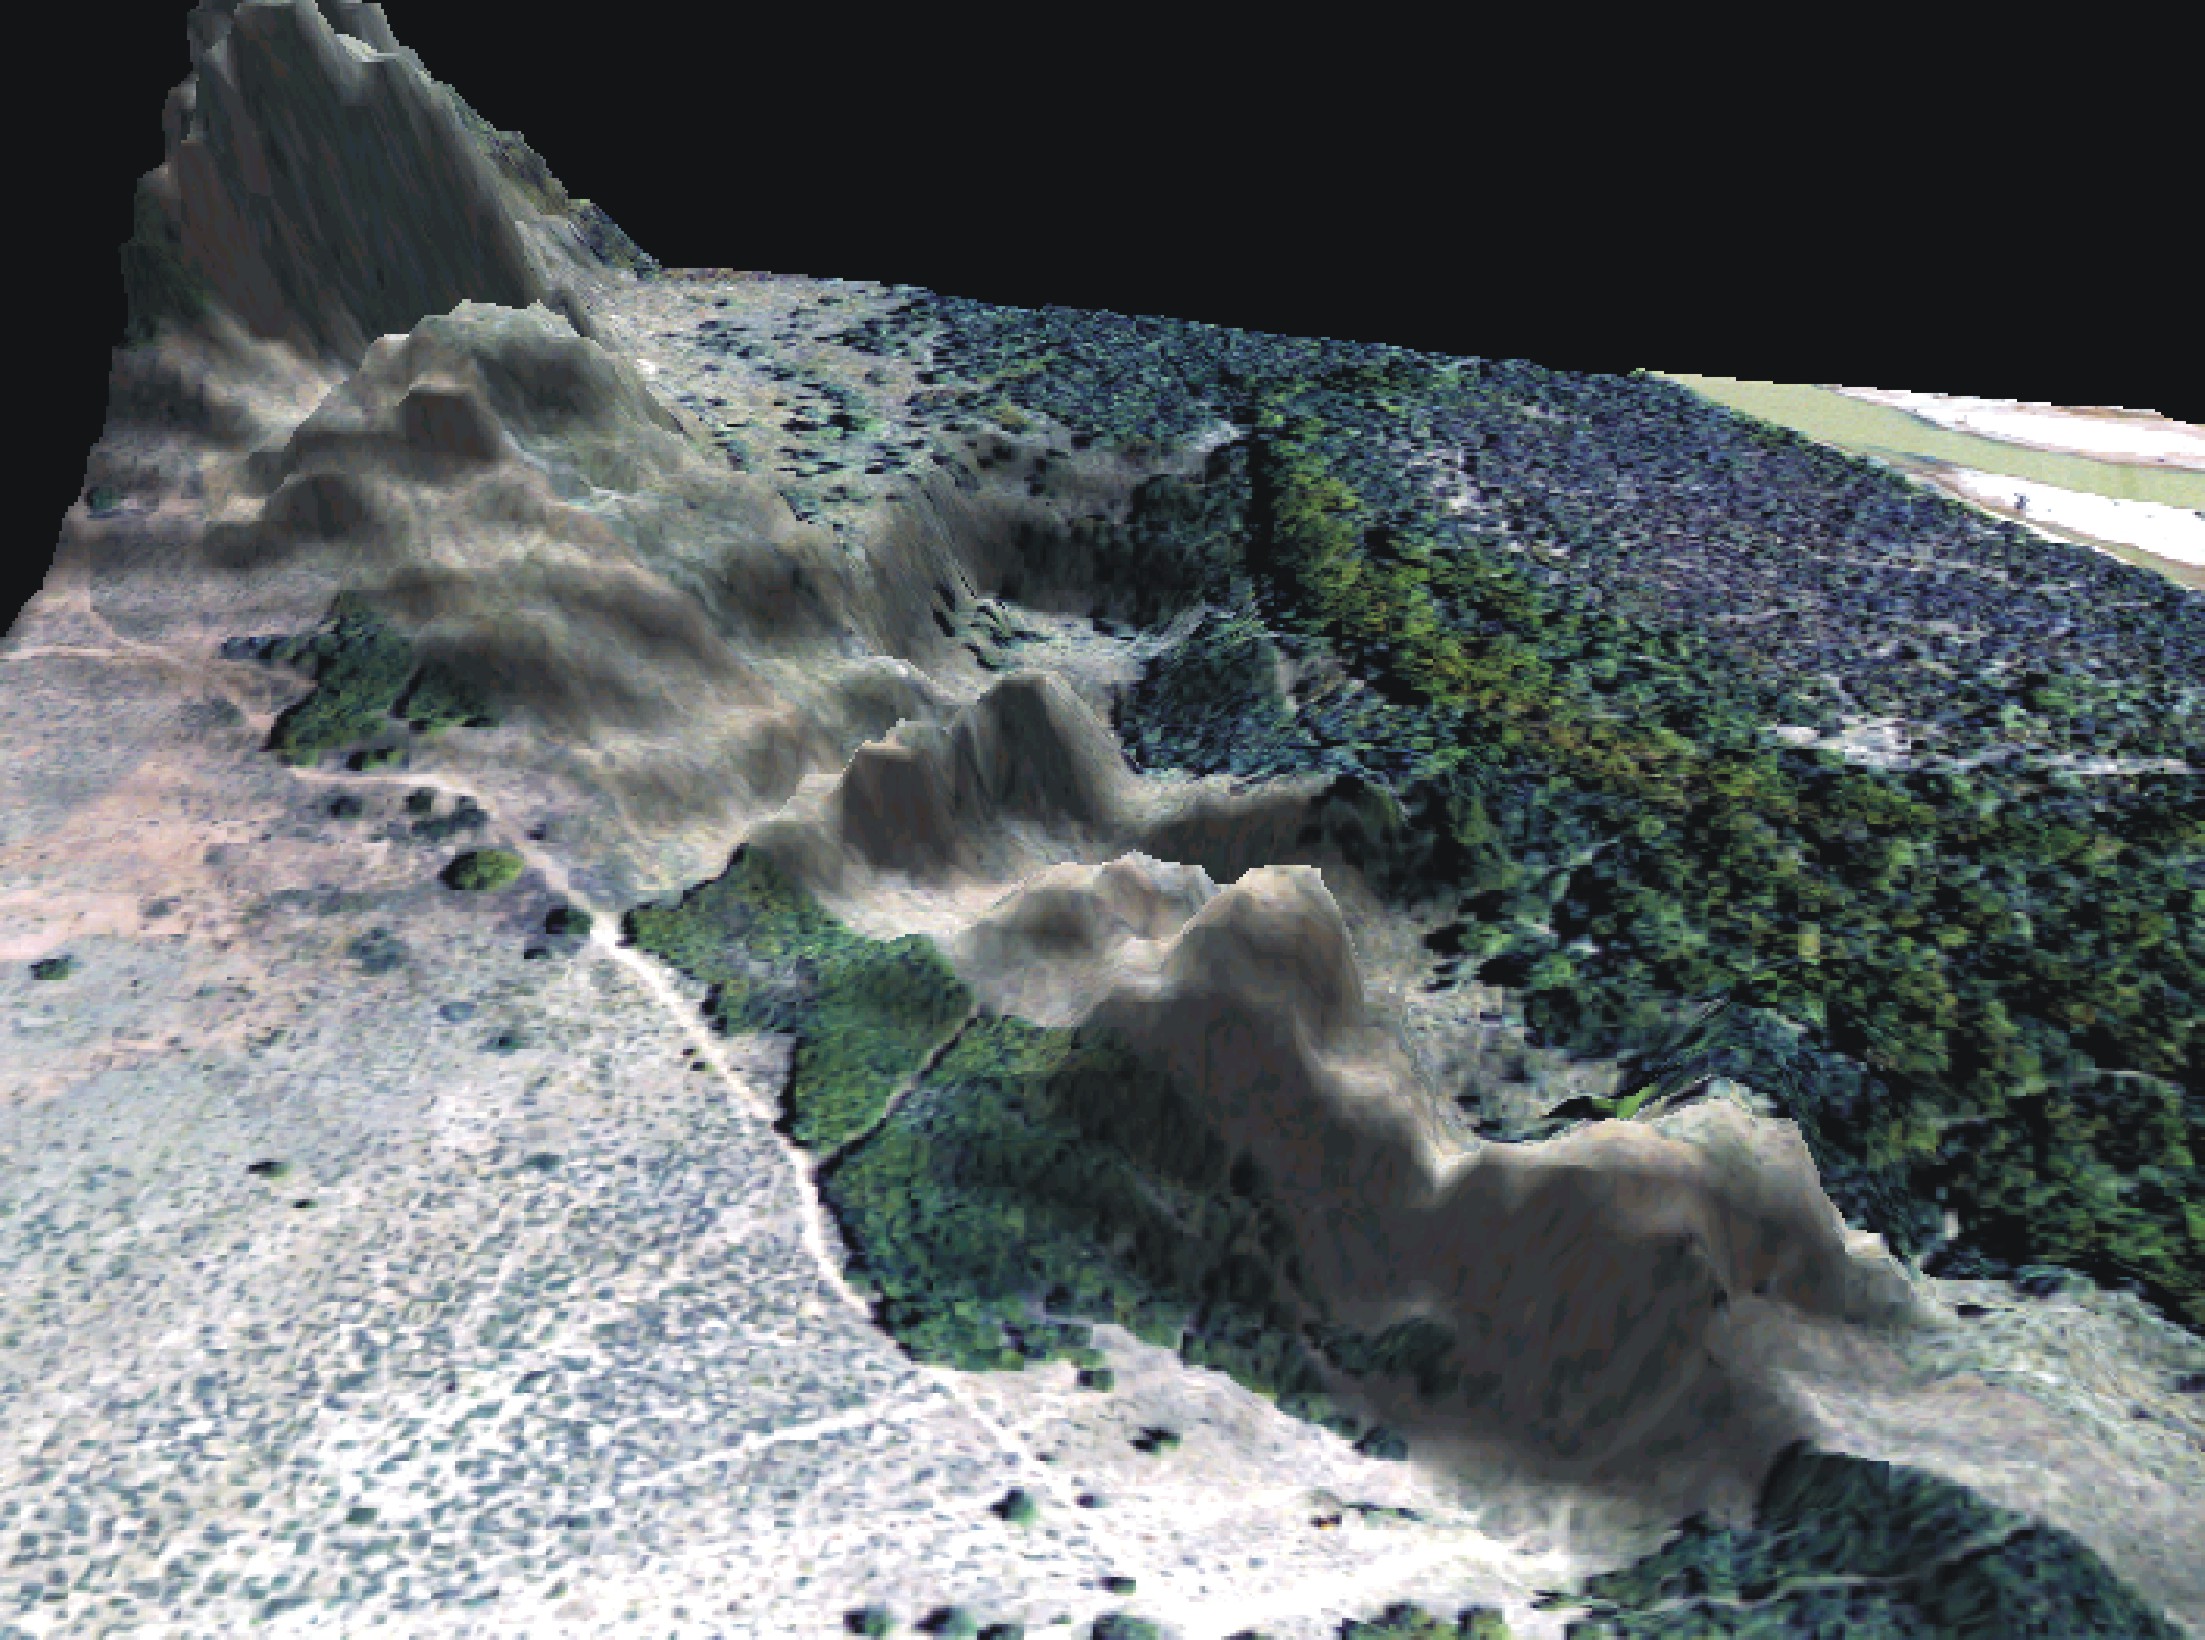
Figure 9 - 3-D model of salinity measurements in cleared salt cedar swath
Air Quality
Santa Ana is also developing an air quality program which will utilize GPS , digital orthophograhy and GIS for mapping pollution sources. All residences on the pueblo will be mapped for this project using a combination of heads up digitizing from natural color orthophotography and GPS. This air program will benefit all the residents of the pueblo by creating a healthier environment.
Infrastructure Management
Municipal Water, Sewer and Utilities
The GIS group has recently been assigned the task of mapping municipal water, sewer and utilities. To increase the efficiency of this exercise, plotted orthophotography will be used in the field as an orientation reference in conjunction with GPS data collection.
Transportation Planning
Road centerlines throughout the pueblo will be entered into the GIS using GPS and heads up digitizing from the orthophotography.
Development Planning
Southern Sandoval Investments, Ltd. (SSI Ltd.), is the Santa Ana Pueblo's development corporation. In 1982, the Tribal Council organized SSI, Ltd. to negotiate with individuals and organizations pursuing economic development opportunities at Santa Ana. Under a 99-year master business lease between the tribe and SSI, Ltd., four projects have been developed so far. The first project was the four-star Prairie Star Restaurant, (figure 10)
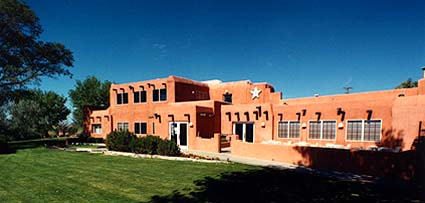
Figure 10 - Prairie Star Restaurant
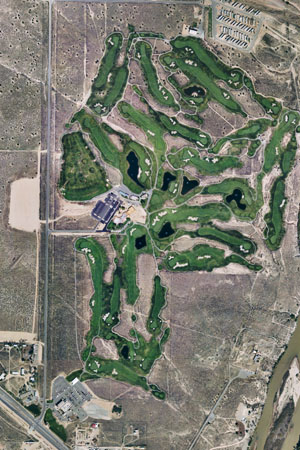
Figure 11 - Digital orthophotography of development in the area.
followed by a 60-unit mobile home village, a 27 hole championship golf course (figure 11). and most recently, the Santa Ana Star Class III Casino. The true color digital orthophotography and 5 ft. elevation contours have been crucial to this planning process. Golf course architects and design engineers have been supplied with AutoCad DWG and TIFF imagery for the project area. Utility infrastructure DXF files have been supplied to the Santa Ana GIS and are being used to produce various maps for the area.
Conclusion
Softcopy photogrammetric and the associated mapping technologies discussed here, are proven and repeatable techniques for GIS base mapping. As the demand for accurate GIS data continues to rise, digital orthophotography provides a cost-effective foundation to construct a GIS database with increased speed and efficiency. This approach gives users of softcopy derived data the ability to more rapidly launch into project solutions and spinoff applications; upping productivity.
At Santa Ana, GIS and digital orthophotography are being used for numerous Natural Resources and Development projects and are serving as valuable resources for planning. The high resolution imagery has enabled tribal leaders and planners to better visualize the physical characteristics of the land and is now assisting with critical land management decisions. The photography and contour data are also proving to be a valuable asset for consultants and engineers involved in planning new development and infrastructure at the Pueblo of Santa Ana.
Acknowledgements:
The authors would like to thank the following groups and individuals for support of the environmental conservation efforts at the Pueblo of Santa Ana.
Pueblo of Santa Ana Governor Ron Montoya
Pueblo of Santa Ana Tribal Administrator Roy Montoya
The Pueblo of Santa Ana Tribal Council
The U.S. Environmental Protection Agency, Region VI
The Bureau of Indian Affairs, Geographic Data Service Center in Denver
The Bureau of Indian Affairs, Albuquerque Area Office
The Bureau of Indian Affairs, Southern Pueblos Agency
The U.S. Fish and Wildlife Service, Albuquerque Office.
The Natural Resources Conservation Service, Albuquerque Office
The Esri Environmental Conservation Program, Charles Convis and Janet Seymour
And special thanks go to the Santa Ana Non Profit Enterprises Board for funding the Geographic Information System Digital Orthophoto Project
For more information on the Santa Ana Natural Resource Program contact:
Todd Caplan, Director
Pueblo of Santa Ana Natural Resources Office
51 Jemez Dam Road Suite 107
Bernalillo, NM 87004
(505) 891-3659
Author Information:
Presiliano Pino
GIS Manager
Pueblo of Santa Ana Natural Resources Office
51 Jemez Dam Road Suite 107
Bernalillo, NM 87004
(505) 867-0615
John L. Peterson
Business Development Manager
EarthData International of New Mexico
6100 Seagull Lane. NE Suite 105
Albuquerque, New Mexico 87109
505-872-0207