The 777-ha SRS, formerly known as the Savannah River Plant,
is located in south central South Carolina along the Savannah River on
the upper Atlantic Coastal Plain of the United States. The SRS was established
in the early 1950's for the production of special nuclear materials, primarily
to support the nuclear weapons program of the United States. SRS has a
rich history of remote sensing data and activities. From the initial phases
of SRS, vertical aerial photography was used by the US Forest Service to
manage timber resources on SRS. Therefore, photography is available every
few years from this program from the 1950's until 1996. Document of SRS
facilities and operations is included in this photography. Numerous other
flights were conducted, as with the National High Altitude Program or by
the Department of Energy (DOE) through the Remote Sensing Laboratory (RSL),
Las Vegas, Nevada. Other documentation of past operations are in the form
of low altitude, oblique photography and video acquisitions primarily by
RSL. Low altitude, aerial gamma over flights, repeated every 5 to 10 years
after 1974, provide valuable information on areas of low-level contamination
of man-made radioactive on SRS and represent a reasonable alternative for
surveying large areas effectively and efficiently. More recently, specialized
airborne remote sensing scanners (Multispectral Scanners (MSS)) provide
coverage of areas of interest, such as SRS wetlands. Satellite data (SPOT
and Thematic Mapper) provide synoptic views of SRS, for landuse/land cover
mapping, not easily obtained with ground based surveys. As data have accumulated
and technologies advanced, the remote sensing data are becoming available
in digital format in Geographic Information Systems (GIS), instead of hard
copy format. As SRS moves to remediation activities, these historical data
become a portion of the baseline for waste site characterization and evaluation
to permit faster and more efficient closure to occur in the future.
Oblique coverage of SRS was acquired during January, 1971; June, 1974; December 1975; June, 1979; March, September, and October, 1981; August and September, 1982; March and August, 1983; March, May, and November, 1984; February, June, and August, 1985; March, April, June, and August, 1986; February, March, and June, 1987; March, 1988; April, 1990; May and June 1991; and April, 1994. The 1982, 1983, and 1984 flights are summarized in Meibaum (1984a, 1985a). The oblique photography provide SRS with a catalogue of major operating areas and construction activities, as well as areas of interest such as waste sites, cooling lakes, and forestry test plots. In the 1980's and early 1990's, numerous waste sites were photographic several times from several angles. The original negatives are stored at RSL and can be retrieved by proof book and frame number.
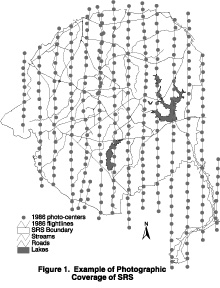
An expansive vertical aerial photographic collection
exists for SRS. For example, representative flight lines and
photographic frame centers for a 1986 US Forest Service site-wide over
flight of the SRS are shown in Figure
1 . Most of the photography prior to 1974
is black and white, while that after 1974 is color, either as normal color
(NC) or false color infrared (FCIR). The most common altitude is 10,000
feet above ground level (AGL) and the most common scale is 1:15840. SRS
was flown at 4 to 5-year intervals by the US Forest Service to assist with
timber management (1955, 1956, 1966, 1973, 1974, 1979, 1982, 1986, 1989,
1992, and 1996). SRS was flown three times under the National High Altitude
Photographic program (1981, 1989, and 1994). Since 1981, SRS has been flown,
either in part or with almost complete coverage at a variety of altitudes
and with differing film types by RSL (EG&G, 1981, 1983; Meibaum, 1984b,
1985b). Nearly site-wide coverage is available for almost every year since
1973; therefore, a photographic history of any location on SRS can be recreated.
Two sets of site-wide, vertical photography from 1938
and 1943 exist prior to establishment of SRS. These two sets provide a
record of landuse on SRS prior to construction of the site (Christel, 1994)
and both are available through the National Archives. Photography were
taken in 1951 at 2,000 and 10,000 foot altitude, during early construction
of SRS, thus details of the land cover were documented and the photography
is available as a digital file (Lloyd, et al., 1996). The
1955 and 1956, black and white photography is of fair quality and only
prints have been located. Much of the photography in the 1950's and 1960's
have portions of the frames near the operating areas of SRS removed from
the prints and/or negatives, as part of the security practices at that
time; thus, their utility for review of history of selected locations on
SRS has been reduced. The construction activities of Par Pond are covered
in a low and high altitude set of photography during 1958 and are especially
useful for that project. The 1961 black and white coverage was flown at
a higher altitude and has less utility. The 1973 and 1974, black and white
coverages are of good quality. In 1971 and 1977, high altitude black and
white coverage was flown by the US Airforce. Fall 1978, FCIR photography
flown by the Savannah River Ecology Laboratory (SREL), University of Georgia,
SRS, provides one of the best sets of early "color" photography. Another
set of site-wide black and white coverage was flow in 1981 for the
Soil Conservation Service for soil mapping of SRS. Photographic coverage
by the US Forest Service occurred in 1979 (NC), 1982 (NC and FCIR), 1986
(NC and FCIR), 1989 (NC and FCIR), 1992 (FCIR), 1996 (NC) are valuable
resources and are available from USDA-ASCS, Aerial Photography Field Office,
Salt Lake City, Utah.
The coverages flown by EG&G (currently Bechtel Nevada)
started in 1974 and are extensive, especially after 1981. These flights
supported a variety of projects, mostly related to reactor operations,
the National Environmental Policy Act (NEPA), and thermal and wetlands
evaluation. Frequently the photography was collected in support of airborne
MSS flights. For example, historical photography were used to evaluate
the condition of the streams and the SRS Savannah River swamp, which received
once-through, secondary cooling water from the reactors on SRS (
Sharitz, et al., 1974a; Tinney, et al., 1986; Jensen, et
al., 1993a,b). Likewise, the history of aquatic vegetation development
around the shoreline of the Par Pond was documented with aerial photography
(Ezra and Tinney, 1985b; Jensen and Mackey, 1991a,b; Jensen, et
al., 1991c; Rea, et al., 1996). Mackey (1993) outlined the
usefulness of aerial photography for the study of Carolina Bay wetlands
on SRS.
Aerial photography has been used to develop site-wide
GIS coverages for SRS. A historical wetlands map, based on pre-SRS (1943
and 1951) photography (Christel, 1994), a site-wide landuse/land cover
map (Ezra and Tinney, 1985a; Ezra, 1985; Ezra, et al. 1986; Christel
and Guber, 1994), and site-wide soils GIS coverage (Rogers, 1990) were
developed with the aid of site-wide aerial photography. In addition, representative
historical photography of SRS was incorporated into a series of image browse
files to allow for quick viewing of any location on SRS over time (Bresnahan,
et al., 1994; Cowen, et al., 1995; Jensen, et al.,
1995, 1996). These resources will prove to be valuable in development of
the history of waste sites at SRS for site characterization, evaluation,
risk assessment, closure plans, and future monitoring (Airola and Kosson,
1989; Christel, 1996; Mackey, 1994; Stohr, et al., 1987;
Stohr and Lunetta, 1994).
To demonstrate the utility of
historical photography of SRS in evaluation of waste sites, an evaluation
of the types and locations of potential waste sites within a former, cooling-water
lake (L Lake) is summarized below. In addition to the use to vertical
photography primarily from 1984-1985, low altitude oblique photography
and video was also available and was useful in verification of activities
or classification of the various types of waste sites in the lake bed of
L Lake, but these materials are not summarized here.
L Lake was developed as a cooling-water
reservoir for L Reactor on SRS. The construction of the lake along Steel
Creek began in the fall of 1984 and was completed one year later in September
1985. When completed, the lake had a capacity of 31 million cubic meters
and a normal pool elevation of 58 meters above mean sea level. L Reactor
operated from 1985 until 1988. However, in spite of L Reactor shutdown
in 1985, the lake level was maintained at normal pool level. In 1996-1997
evaluations, which could lead to the eventual draining of L
Lake, were initiated as part of potential cooling water system shutdown
at SRS. Since the Steel Creek flood plain was an area of low level gamma
contamination (Briese et al., 1975; Brisbin et al., 1974;
Gladden et al., 1985; Jobst, 1987, 1988; Sharitz et al.,
1974b) and contaminated soil and vegetation materials had been relocated
during the L Lake construction activities, historical photography from
1984 through 1985 until just prior to filling of the lake were evaluated.
Maps of disturbed areas such as borrow pits, upland vegetation ash pile
burial sites, flood plain contaminated vegetation sites, flood plain dam
soil removal and construction burial sites were produced for over 63 hectares
of disturbed areas within the 400 hectares of the lake bed. In addition,
a digital elevation model (DEM) was created using soft copy photogrammetry
techniques, so that various L Lake draw-down scenarios at different
lake levels could be evaluated with respect to waste site exposure and
remediation (Christel, 1996).
Steel Creek is one of five major streams on SRS. This stream rises on SRS and flows approximately 18 km south to the Savannah River flood plain and Savannah River on the southern portion of SRS. Operations of P and L Reactors began in 1954 and once-through cooling-water was discharged initially from these two reactors to Steel Creek. Stream flows in Steel Creek increased from its natural flow of about 1 cubic meter per second to a maximum of 24 cubic meters per second with the secondary cooling-water effluent pumped from the Savannah River. The secondary cooling-water was released at temperatures as high as 70 degrees centigrade; thus, theses two reactors greatly influenced the hydrologic and thermal regimes of Steel Creek. The results of the increased flow in Steel Creek included inundation of the creek flood plain, erosion, and loss of the original wetland plant communities. In addition, from 1955 to 1973, approximately 284 curies of cesium-137 were released into Steel Creek. Because of a strong affinity for sediments, a majority of the released material was absorbed and/or deposited in the sediments of Steel Creek and the adjacent SRS Savannah River flood plain (Briese, et al., 1975; Brisbin, et al. 1974; Feimster, 1992; Gladden, et al., 1985; Jobst, 1987, 1988; Shartiz, et al., 1974). Cooling-water effluent from P Reactor was diverted to Par Pond on SRS in 1963, and L Reactor was placed on standby in 1968; thus, returning Steel Creek to a more near normal flow regime. Refurbishment of L Reactor began in the early 1980's with plans to restart the reactor in 1985. To provide thermal mitigation of cooling-water from the restart of L Reactor, L Lake was constructed by damming the middle reach of Steel Creek. With the cessation of thermal releases to Steel Creek in 1968, scrub-shrub and persistent and non-persistent emergent plant communities had colonized the Steel Creek flood plain and were in place when L Lake construction began in 1984 (Tinney et al., 1986; Wein and McCort, 1988). The upland areas of L Lake had been managed primarily as pine stands. L Reactor was restarted in the late fall of 1985 and continued operating until it was again placed on standby in 1988.
Construction of L Lake began in
the fall of 1984. L Lake was formed by damming the middle reach of Steel
Creek between SRS Road B and Highway 125. The resulting 400-hectare, L
Lake has a capacity of 31 million cubic meters and is 7000 meters long
and 1200 meters wide at it widest point (average 600 meters). The
dam, located at the south end of the lake, is 1200 meters long. The normal
pool of the lake is 58 meters above mean sea level (MSL) and the top of
the main embankment of the L Lake dam is 61 meters above MSL. Clear
cuts made during construction of the lake totaled 418 hectares including
144 hectares of bottom land hardwood and shrub wetlands, 146 hectares of
upland hardwood and pine forest, and 50 hectares of other areas within
the lake basin (Ezra and Tinney, 1985; Tinney et al., 1986;
Wein and McCort, 1988; Wein and Pierce, 1995). Timber growing above the
Steel Creek flood plain was cut for commercial sale. Outside the lake basin
additional areas were clear-cut for power line right-of-ways and other
construction related activities (McCort et al., 1988).
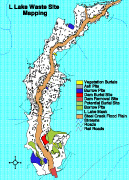
During the construction of L Lake
dam, dredged spoil from the flood plain of Steel Creek at the dam site
was placed in a special waste disposal area, allowed to dry, leveled, and
then covered with 1.5 meters of soil (Ziegler et al., 1985) (
Figure 2 ).
Although only the upper 1.2 meters of flood plain material was considered
to be radioactively contaminated, the stream bed was excavated to a depth
of about 3 meters (Gladden et al., 1989). This spoil
material was estimated to contain 0.2 curies of cesium-137 and 0.02 curies
of colbalt-60 (Zeigler et al., 1985). Approximately 46,400 cubic
meters of spoil material were removed from the dam site. The area of this
waste disposal site for the L Lake dam construction site was estimated
to be about 5 hectares based on interpretation of digitized aerial photography
from September 1985. This buried spoil site was flooded over when the lake
was filled.
Trees outside of the Steel Creek
flood plain were sold through commercial timber harvests. The remaining
debris from the upland tree harvest and sale was pushed into piles, burned,
and covered with local soil materials prior to filling of the lake. Five
hundred eighty-four (584) of these ash piles were identified and mapped
in aerial photography of L Lake during the construction activities (
Figure 2 ).
Trees and shrubs within the flood plain itself were potentially contaminated
from the radioisotopes in the flood plain soils. Vegetation growing
in the flood plain area of Steel Creek covered by the lake
was estimated to contain about 12 milli-curies of cesium -137 (Zeigler
et al., 1985). The woody vegetation in the Steel Creek flood plain
was removed from the upper two-thirds of L Lake, but was left standing
in the lower one-third of the flood plain immediately upstream of the coffer
dam used during the construction of the L Lake dam. The vegetation
removed from the flood plain was buried in an estimated one hundred fifty-four
(154) sites adjacent to the Steel Creek flood plain and covered with 1
to 2 meters of local soil material prior to the filling of the lake (
Figure 2 ).
Before L Lake was filled, 35 artificial
reefs including 3 log reefs, 7 brush reefs, 12 tire reefs, 12 concrete
block reefs, and 1 floating tire breakwater were constructed. The reefs
were constructed to provide habitat diversity and structure in the lake
before an aquatic plant community was established (Gladden et al.,
1989; Wein and Pierce, 1995). These artificial structures are evident in
the aerial photography used to map L Lake prior to filling.
The filling of L Lake began on September 15, 1985, and the lake reached
its normal operating level of 58 meters above MSL on November 4, 1985 (Gladden
et al., 1989). During the summer of 1986, a rip rap diversion
dike and canal were constructed in the northern end of L Lake just
south of SRS Road B to more effectively use the cooling capacity of the
lake. Changes in L Lake caused by the construction of this dike
and canal are not included here.
A review of historical photography
available from RSL indicated that several aerial acquisitions of Steel
Creek had occurred during 1984-1985. Pre-construction flights show the
presence of test drillings near the future L Lake dam site and an existing
borrow pit in the upper portion of the future (March 31, April 1, June
18, and September 19, 1984). Archeological survey pits are also visible
in this 1984 photography. Construction began in the fall of 1984. Aerial
photography of the L Lake construction activities was acquired on
the following dates: April 17, April 25, May 14, May 18-19, June 21, and
September 6, 1985 (Table1). Based on the information in the photography,
material appears to have been removed from within the Steel Creek flood
plain at the L Lake dam construction site and deposited in a large pit
north of the dam site and east of the Steel Creek flood plain (
Figure 2 ).
Aerial gamma surveys conducted in August 13-23, 1985, of the Steel Creek
flood plain show no cesium-137 activity in close proximity to the
dam construction site, nor in the area of the disposal site (Jobst, 1988).
Commercial timber harvesting was wide spread throughout the
upland areas (non-flood plain areas of the future lakebed). Following the
timber harvest, the remaining debris was placed in piles and burned. Debris
and ash piles are visible in the aerial photography. The ash piles, which
are characteristically oval-shaped, were covered with local soil materials
and numbered to several hundred (Table 3 and Figure
2 ).
The time sequence of photography
shows that after the upland areas were harvested, the flood plain was cleared
of timber and a series of disturbances or pits occurred lateral to or within
the flood plain. This activity began in the northern portion of the lakebed
and continued southward. These features or pits appear at irregular intervals
and are likely the locations of contaminated materials removed from the
flood plain. They are less well-defined in shape and appear to "cast a
shadow," which indicates that they are 'mound-like." It is estimated that
there are more than 150 of these "mounds" or pit burials. Some of these
pits may not have been used, especially in the lower one-third of the lake
where much of the flood plain vegetation was still standing as observed
in the last vertical aerial photography which was taken on September 6,
1985. The filling of L Lake began on September 15, 1985. Aerial photography
acquired after September 1985 shows the lake at full pool.
In addition to the vertical photography,
ground photography of the construction activities were reviewed from SRS
achieves and records taken primarily by the COE during the construction
of L Lake. Low altitude video tapes (March and October 1984) and oblique
photography (March and September, 1984, and March and August, 1985) taken
from helicopter over flights of the lake during the construction activities
was also reviewed. These additional sources of information were especially
valuable in determining the sequence of changes associated with the
construction of L Lake and in interpretation of the changes which occurred
in the lakebed.
To map the L Lake basin, vertical
aerial photography acquired on September 9, 1985, nine days before filling
of the lake began, was selected as the base imagery (Christel, 1996). Most
of the construction and clearing activities were either completed or nearly
complete at this time, except for the final construction of the L Lake
dam itself. The timeliness and scale (1:13900) (Table 1) provided the most
comprehensive visual record available for the lake and; therefore, was
used for the digital mapping effort described below.
The series of photographs used
to support the digital ortho-photographic mapping of L Lake waste sites
included frames 92 through 99 of EG&G file or proof book roll number
5108. The photography was acquired between 9:45 and 9:49 am on September
9, 1985, with a north heading and an altitude above ground level of 7,000
feet. The photographic system was a Wild Heerburg RC-10, large format,
aerial camera equipped with a 153-millimeter lens and Aerocolor 2445 film.
The imagery was cloud free, and contains well-defined shadows due to the
low sun angle from the early morning flight. The original spool film
was scanned at 50 microns on a Howtek flatbed scanner to yield a resolution
of one-meter for the mapping. The binary digital photographs were
converted to .img files, rotated, and reviewed using ERDAS Imagine, Version
8.2, image processing software (ERDAS, 1995). The images were rotated so
that north (the direction of the flight line) was to the right. This rotation
gave the best parallax for the correction function employed during
the ortho-rectification process. Based predominantly on overlap and scan
quality, frames 92, 94, 96, 97, 98, and 99 were selected and imported into
SoftPlotter ™ Version 1.6, Vision International's soft copy ortho-photogrammetric
package (Vision International, Inc., 1996). For best results from SoftPlotter,
camera calibration information is required. This information was obtained
from Leica NA, Inc. The camera calibration certificate lists import
lens information including the calibration focal length, the principal
point of symmetry, and the radial distortion away from the principal point
of symmetry. The manufacturer's fiducial mark locations with respect to
the focal center of the camera frame are also given. All of these values
are used by the SoftPlotter Interior Orientation routine to calculate
the mathematical relationships between the camera lens and the lens
and the ground.
| Proof | Frame | Date | Altitude as | Scale | Film |
| Book | Number | (M/D/Year) | Feet Above | Type | |
| Number* | Ground Level | ||||
| 4644 | 006 | 03/31/84 | 17000 | 1:34000 | Color Infrared |
| 4655 | 006 | 03/31/84 | 17000 | 1:34000 | Color |
| 4655 | 161-164 | 04/01/84 | 8000 | 1:15700 | Color |
| 4755 | 174,194 | 06/18/84 | 10000 | 1:19900 | Color |
| 4840 | 16-22 | 09/19/84 | 20000 | 1:39200 | Color |
| 4840 | 63-86 | 09/19/84 | 8000 | 1:7960 | Color |
| 4966 | 62-63 | 04/17/85 | 20000 | 1:41400 | Color |
| 4966 | 73 | 04/17/85 | 6000 | 1:11900 | Color |
| 4973 | 105-112 | 04/25/85 | 4000 | 1:7960 | Color |
| 4991 | 10-19 | 05/14/85 | 6000 | 1:11900 | Color |
| 4992 | 10-19 | 05/14/85 | 6000 | 1:11900 | Color Infrared |
| 4933 | 83-104 | 05/18/85 | 10000 | 1:19900 | Color |
| 4994 | 84-104 | 05/18/85 | 10000 | 1:19900 | Color Infrared |
| 4997 | 66-73 | 05/19/85 | 7000 | 1:13900 | Color |
| 4998 | 66-73 | 05/19/85 | 7000 | 1:13900 | Color Infrared |
| 5033 | 75-81 | 06/21/85 | 6000 | 1:11900 | Color |
| 5033 | 82 | 06/21/85 | 17000 | 1:33800 | Color |
| 5108 | 88 | 09/06/85 | 20000 | 1:39200 | Color |
| 5108 | 92-100 | 09/06/85 | 7000 | 1:13900 | Color |
Epipolar re-sampling of the triangulated
overlapping imagery was performed using the proprietary algorithms provided
in the Stereo Tool module in SoftPlotter. This process resulted in five
stereo-pairs of images that were oriented such that y-parallax was
removed and x-parallax was interpreted as differences in elevation.
The stereo-pairs were displayed to quality check the apparent success of
the re-sampling before the digital elevation model (DEM) was generated.
Table 2. Control Point Information
| Type | Number | Source |
| Horizontal | 13 | Differential GPS* |
| Vertical | 7 | USGS Quadrangles** |
| Tie Points | 6 | Frame Feature |
*Global Position System provided
by Westinghouse Savannah
River Company Personnel, R. S.
Riley
**Girard NW and Girard NE 7.5minute
series (USGS,1964)
The five stereo-pairs were used as the sources for the DEM. Collection parameters were defined with a ground spacing of one meter, and a DEM was produced for each stereo-pair. This was an iterative process and the most time intensive, because the software provides ample methods for improving posting results through the use of break-lines and other site-specific point and surface adjustments. For L Lake, the forest edge was the biggest consideration during the editing process. Special attention was given to those areas directly affecting the shoreline elevations. When the DEMs for each stereo-pair were completed, a mosaic image was produced (ERDAS, 1995). Based on known and map-measured check points, elevation errors of the DEM ranged from 0.037 to 1.70 meters. Horizontal accuracy was less than 10 meters.
Ortho-photographs were derived
from the five images and the DEM using a defined ground spacing of one
meter in the Ortho Tool module in SoftPlotter (Vision International, Inc.,
1996). As with the DEMs, the ortho-photography were merged using the mosaic
routine in Imagine 8.2 (ERDAS, 1995). This image and the DEM were subsequently
used to generate raster products and ArcInfo coverages (Esri, 1996) to
determine the location, extent, and type of disturbances that were visible
in the lakebed on September 6, 1985, just prior to the initial fill date
of the lake nine days later.
The features (feature cover types)
within the lakebed were grouped into seven categories based on the preliminary
review of the source photography (Table 3). The temporal sequence of the
aerial (Table 1) and ground photography indicate that these feature types
were the primary areas used for the removal, transport, dumping, disposal,
covering, and subsequent containment of the majority of material relocated
during the construction of L Lake. Thus, two areas, totaling 5.87 hectares,
were identified as potentially receiving contaminated soil materials
removed from the flood plain of Steel Creek during the construction of
the L Lake dam ( Figure 2 ).
Borrow pits and similar areas of disturbance consisted of fifteen
areas totaling 29.04 hectares. One hundred fifty-four areas, totaling
6.42 hectares, were identified as potential vegetation waste piles were
materials were removed from the contaminated Steel Creek flood plain. These
vegetation waste piles are typically adjacent to the flood plain or are
within the Steel Creek flood plain. Five hundred eighty-four ash piles
account for 21.41 hectares in the lakebed. As stated earlier, these ash
piles resulted from burning of piles of debris remaining from
the commercial sales of upland vegetation and the subsequent covering
of the ash piles with local materials using bulldozers. Table 3 also lists
other types of features and structures constructed in L Lake, i.e., fish
habitat structures.
| Disturbance Type | Number of Occurrences | Mean Size (hectares) | Total Area (hectares) |
| Dam Soil Burial Sites | 2 | 2.94 | 5.87 |
| Vegetation Burial Sites | 154 | 0.04 | 6.42 |
| Upland Ash Piles | 584 | 0.04 | 21.41 |
| Borrow Pits and Similar Areas | 15 | 1.94 | 29.04 |
| Debris Piles | 13 | 0.04 | 0.46 |
| Fish or habitat Structures | 27 | 0.01 | 0.21 |
| Total Area | 63.41 |
Historical aerial photography
provided a powerful resource to assist in the reconstruction of the location
of disturbances within a former cooling-water lake on a DOE site. The types,
numbers, size, and locations, both as to coordinates and elevations could
be reconstructed using ortho-photogrammertic and other digital imagery
and Geographic Information System (GIS) technologies. By using the digital
maps in conjunction with the DEM for L Lake, information can
be provided to support future sampling and characterization
evaluations that may be required, if the lake were to be drained and remediation
and/or landscape restoration were required. Without the reconstruction
of the lakebed configuration as it existed just prior to filling
in September, 1985, characterization and remediation evaluations
would be more difficult.
In a manner similar to that used
with historical photography of L Lake, the history of many of the waste
sites on SRS can be reconstructed. This reconstruction would yield information
on the location, time period of use, and environmental conditions at or
near the waste site; therefore, improving future closure activities
associated with these waste sites.
The author is most appreciative of the efforts provided
by R. S. Riley in collection of field GPS data to support georegistration
of the L Lake photography. Much of the case history data for L Lake
was developed by Lynne Christel of Bechtel Nevada, Las Vegas, Nevada.
Cheryl Hardy of WSRC was instrumental in assisting with manuscript preparation.
Airola, T. M. and D. S. Kosson.
1989. Digital Analysis of Hazardous Waste Site Aerial Photographs. Journal
Water Pollution Control Federation. 61(2):180-183.
Bresnahan, P. J., D. J. Cowen,
J. R. Jensen, and H. E. Mackey, Jr. 1994. "Integrating Heterogeneous Data
to Develop a Large-Scale Environmental Data Atlas for Multi-Platform Users."
Proceedings GIS/LIS '94 Annual Conference and Exposition, October 25-27,
1994. Phoenix, Arizona. pp. 96-104.
Briese, L. A., C. T. Garten, Jr.,
and R.R. Sharitz. 1975. "Distribution of Radiocesium in Vegetation Along
a Contaminated Stream." Mineral Cycling in Southeastern Ecosystems. USAEC
Symposium Series, CONF-740513. pp. 509-517.
Brisbin, I. L., Jr., R. J. Beyers, R. W. Dapson, R. A. Geiger, J. B. Gentry, J. W. Gibbons, M. H. Smith, and S. K. Woods. 1974. "Patterns of Radiocesium in the Sediments of a Stream Channel Contaminated by Production Reactor Effluents." Health Physics. 27:19-27.
Christel, L. M. 1994. Historical Wetlands Mapping and GIS Processing for the Savannah River Site Database. EGG 11265-1018. EG&G Energy Measurements, Inc., Las Vegas, NV
Christel, L. M. and A. L. Guber. 1994. Land Cover Mapping and GIS Processing for the Savannah River Site Database. EGG 11265-1016. EG&G Energy Measurements, Inc., Las Vegas, NV
Christel, L.M. 1996. Historical Aerial Photographic for Waste Unit Mapping in an Existing Lake through Digital Bathymetric Modeling. Bechtel Nevada, P.O. Box 98521, Las Vegas, NV 89193-8521
Cowen, D. J., J. R. Jensen, P. J. Bresnahan, G. Ehler, D. Graves, X. Huang, C. Wiesner, and H. E. Mackey, Jr. 1995. "The Design and Implementation of an Integrated Geographic Information System for Environmental Applications." Photogrammetric Engineering & Remote Sensing. 61(11):1393-1404.
EG&G. 1981. A Catalogue of Vertical Aerial Imagery of the United States Department of Energy's Savannah River Plant and Surrounding Area, Aiken, South Carolina. EG&G Energy Measurements, Inc., Las Vegas, NV
EG&G. 1983. A Catalogue of Vertical Aerial Imagery of the United States Department of Energy's Savannah River Plant and Surrounding Area, Aiken, South Carolina, Volume II. EG&G Energy Measurements, Inc., Las Vegas, NV
ERDAS, Inc. 1995. ERDAS Imagine, Version 8.2. Atlanta, Georgia.
Esri, Inc. 1996. ArcInfo Version 7.0.4. Esri, Inc., Redlands, California.
Ezra, C. E. 1985. Steel Creek Land Cover Data Base Update, Savannah River Plant, Aiken, South Carolina Survey Dates: September 19, 1984 and April 25, 1985. EG&G/EM Letter Report DOE/ONS-8512, EG&G Energy Measurements, Inc., Las Vegas, NV
Ezra, C. E. and L. R. Tinney, 1985a. Steel Creek Land Cover Data Base , Savannah River Plant, Aiken, South Carolina. EG&G/EM Letter Report DOE/ONS-8510, EG&G Energy Measurements, Inc., Las Vegas, NV
Ezra, C. E. and L. R. Tinney. 1985b. Par Pond Macrophyte Study Savannah River Plant, Aiken, South Carolina. EG&G/EM Letter Report DOE (ONS-SRL)8513. EG&G Energy Measurements, Inc., Las Vegas, NV
Ezra, C. E., L. R. Tinney, and H. E. Mackey, Jr. 1986. Pen Branch and Four Mile Creek Land Cover Data Base, Savannah River Plant, Aiken, South Carolina. EG&G/EM, DOE (ONS-SRL)-8605. 54 pp.
Gladden, J. B., K. L. Brown, M. H. Smith, and A. Towns. 1985. "Distribution of Gamma Exposure Rates in a Reactor Effluent Stream Flood Plain System." Health Physics. 48:49-59.
Gladden, J. B., W. L. Specht, J. A. Bowers, N. V. Halverson, H. E. Mackey, Jr., and E. W. Wilde. 1989. Compliance of the Savannah River Plant L-Reactor Cooling System with Environmental Regulations-Demonstration in Accordance with Section 316(a) of the Clean Water Act, November 1985-December, 1987. DP-1766, Rev. 1. E. I. duPont de Nemours & Co., Inc. Savannah River laboratory, Aiken, South Carolina.
Jensen, J. R. and H. E. Mackey, Jr. 1991a. "Remote Sensing of Freshwater Aquatic Macrophytes in Southeastern Lake: Part 1-Analysis of 30 Years of Vertical Aerial Photography." Proceedings 1991 ACSM-ASPRS Annual Convention, Volume 3, Remote Sensing, Baltimore, MD. pp.224-231.
Jensen, J. R., and H. E. Mackey, Jr. 1991b. "Remote Sensing of Aquatic Macrophytes in a Southeastern Lake Using Aerial Photography, High Resolution Multispectral Scanner, and SPOT Data to Assess Seasonal Changes." Technical Papers, Amer. Soc. Photogrammetry, Baltimore. pp. 224-231.
Jensen, J. R., S. Narumalani, O.
Weatherbee, and H. E. Mackey, Jr. 1991c. "Remote Sensing Offers an Alternative
for Mapping Wetlands." Geo Info Systems. October, 1991. pp. 48-53.
Jensen, J. R., S. Narumalani,
J. D. Althausan, J. W. Powell, and H. E. Mackey, Jr. 1993a. "Analysis of
Stereoscopic Aerial Photography and High Resolution Multispectral Scanner
Data to Document Historical Logging and Recent Management Practices on
a Cypress-Tupelo Forest in South Carolina." Proceedings of Annual Meeting
of American Society of Photogrammetry and Remote Sensing, New Orleans,
LA. February 14-19, 1993. p.143.
Jensen, J. R., S. G. Burkhalter, J. D. Althausan, S. Narumalani, and H. E. Mackey, Jr. 1993b. "Integration of Historical Aerial Photography and a Geographic Information System to Evaluate the Impact of Human Activities in a Cypress-Tupelo Swamp." 14th Biennial Workshop on Color Photography and Videography in Resource Monitoring, Utah State University, May 25-28, 1993. pp. 125-134.
Jensen, J. R., D. J. Cowen, D. Graves, K. He, X. Huang, and H. E. Mackey, Jr. 1995. "An Image and Retrieval System Using Hypermedia Resources." Proceedings GIS/LIS '95 Annual Conference & Exposition, November 14-16, 1995, Nashville, TN Volume 1: 515-521 and page 512.
Jensen, J. R., D. Cowen, X. Huang, D. Graves, K. He, and H. E. Mackey, Jr. 1996. "Remote Sensing Image Browse and Archival Systems." Geocarto International, A Multidisciplinary Journal of Remote Sensing & GIS. 11(2):33-42.
Jobst, J. E. 1987. An Aerial Radiological Survey of the Savannah River Plant Drainage Basins, Date of Survey: August 1982. DOE/ONS-8312, Rev. 1. EG&G/EM, Las Vegas, Nevada.
Jobst, J. E. 1988. An Aerial Radiological Survey of the L Lake and Steel Creek, Savannah River Plant, Survey Date: August 1985. DOE(ONS-SRL)-8611. EG&G/EM, Las Vegas, Nevada.
Lloyd, F. T, R. M Fletcher, and N. J. Thompson. 1996. "Forestry Applications Put Historical Digital Orthoimagery to Use." Earth Observation Magazine, 5(1):33-35.
Mackey, H. E., Jr. 1993. "Application of Low Altitude Normal Color and False Color Infrared Photography for Delineation and Monitoring Wetland Restoration of a Large Carolina Bay." 14th Biennial Workshop on Color Photography and Videography in Resource Monitoring, Utah State University, May 25-28, 1993. p. 201.
Mackey, H. E. , Jr. 1994. "Roles of Historical Photography in Waste Site Characterization, Closure, and Remediation." Spectrum '94, August 14-18, 1994. Proceedings, Atlanta, GA. p. 1118.
McCort, W. D., L. C. Lee, and G. R. Wein. 1988. "Mitigating for Large-Scale Wetland Loss: A Realistic Endeavor?" In: J. A. Kusler, M. L. Quammen, and G. Brooks (eds.). Proceedings of the National Wetland Symposium: Mitigation of Impacts and Losses. Association of State Wetland Managers, Inc. pp. 359-367.
Meibaum, R. A. 1984a. Oblique Aerial Photographic Documentation of the Savannah River Plant, Aiken, South Carolina, Dates of Photographic Coverage: September 1982 Through April 1983. EG&G/EM Letter Report, DOE/ONS-8401, EG&G Energy Measurements, Inc., Las Vegas, NV
Meibaum, R. A. 1984b. Vertical Aerial Photographic Documentation of the Savannah River Plant, Aiken, South Carolina, Dates of Photographic Surveys: August 1982 Through December 1983. EG&G/EM Letter Report, DOE/ONS-8405, EG&G Energy Measurements, Inc., Las Vegas, NV
Meibaum, R. A. 1985a. Oblique Aerial
Photographic Documentation of the Savannah River Plant, Aiken, South Carolina,
Photographic Coverage for Calendar Year 1984. EG&G/EM Letter Report,
DOE/ONS-8501, EG&G Energy Measurements, Inc., Las Vegas, NV
Meibaum, R. A. 1985b. Vertical
Aerial Photographic Documentation of the Savannah River Plant, Aiken, South
Carolina, Photographic Coverage for Calendar Year 1984. EG&G/EM Letter
Report, DOE/ONS-8502, EG&G Energy Measurements, Inc., Las Vegas, NV
Sharitz, R. R., J. W. Gibbons, and S. C. Gause. 1974a. "Impact of Production-Reactor Effluents on Vegetation in a Southeastern Swamp Forest." IN: J. W. Gibbons and R. R. Sharitz (eds.), Thermal Ecology, US Atomic Energy Commission, Symposium Series CONF-730505. pp. 356-362.
Sharitz, R. R., S. L. Scott, J. E. Pinder, III, and S. K. Woods. 1974b. "Uptake of Radiocesium from Contaminated Floodplain Sediment by Herbaceous Plants." Health Physics. 28:23-28.
Rea, T. E., D. J. Karapatakis, K. K. Guy, J. E. Pinder, III, and H. E. Mackey, Jr. 1996. "Bathometry as a Controlling Factor in Macrophyte Development: Thirty Years of Change Detection in a Former Reactor Cooling Pond." Proceedings of the American Society of Photogrammetry and Remote Sensing, 1996 ASPRS/ACSM, Annual Convention & Exposition, Technical Papers, Volume 2, GIS & GPS, page 45, April 22-25, 1996, Baltimore, Maryland.
Rogers, V. A. 1990. Soil Survey of Savannah River Plant Area, Parts of Aiken, Barnwell, and Allendale Counties South Carolina. U.S. Department of Agriculture, Soil Conservation Service, 127 pp., 46 maps.
Stohr, C., W. J. Su, P. B. DuMontelle, and R. A. Griffin. 1987. Remote Sensing Investigations at a Hazardous-Waste Landfill. Photogrammetric Engineering & Remote Sensing. 53(11):1555-1563.
Stohr, C. and R. S. Lunetta. 1994. Special Issue on Remote Sensing in Solid and Hazardous Waste Management. Photogrammetric Engineering & Remote Sensing. 60(8):997.
Tinney, L. R., E. E. Ezra, and H. E. Mackey, Jr. 1986. Stream Corridor and Delta Wetlands Change Assessment, Savannah River Plant, Aiken, SC EG&G Letter Report, DOE (ONS-SRL) -8604. 55pp.
U.S. Geological Survey. 1964. 7.5 Minute Series (Topographic). Reston, VA.
Vision International, Inc. 1996. SoftPlotter User's Manual, Version 1.6. Earth city, Mo.
Wein, G. R. and W. D. McCort. 1988. "Sources of Complexity in Wetland Mitigation." In: J. Zelazny and J. S. Feierbend (eds.). Proceedings of Wetlands: Increasing Our Wetland Resources. Federation-Corporate Conservation Council. October 4-7, 1987. Washington, D. C. pp. 41-50.
Wein, G. R. and G. Pierce. 1995. "Case Study #1: L-Lake, Savannah River Plant, South Carolina." In: Native Plant Material Sources for Wetland Establishment: Freshwater Case Studies. Technical Report WRP-RE-5, U. S. Army Corps of Engineers, Waterways Experiment Station, Vicksburg, MS pp. 13-35.
Zeigler, C. C., I. B. Lawrimore, and W. E. O'Rear. 1985. Environmental Monitoring at the Savannah River Plant, Annual Report-1984. DPSPU 85-302. Health Protection Department, Savannah River Plant, E. I. duPont de Nemours and Company, Inc., Aiken, South Carolina.