| geometric modeling; | |
| video imaging; | |
| geometric video imaging; and | |
| image draping. |
The Virtual Forest:
Advanced 3-D Visualization Techniques for Forest Management and Research
David J. Buckley, Craig Ulbricht and Dr. Joseph Berry
The use of 3-D based visualization techniques with GIS historically has been applied for visual impact assessment in natural resource management. In particular, the aesthetics of forest harvest cutblock shape, size and location are of primary importance. However, current GIS technology has not provided visualization functionality affording realistic presentations of the 3-D landscape. GIS based visualization operations are restrictive in their graphic visualization capabilities. Considering the visualization software tools available in the scientific community there has been very little integration of these techniques with commercial GIS software.
This paper reviews the issues involved, and capabilities achieved, by integrating readily available scientific visualization techniques with commercial GIS software, such as ArcInfo. The paper focuses on the integration of surface rendering functions and map animation tools within ArcInfo. These techniques are of interest to foresters in evaluating aesthetic issues related to harvest cutblock design and operating plan approval. Conventional visual exposure analysis, 3-D surface fly-bys, and advanced tree object rendering, are the primary capabilities utilized. The striking realism of the visualizations generated in this project have enhanced foresters ability to communicate their planned management activities.
Introduction
The use of 3-D visualization techniques with GIS historically has been applied for visual impact assessment in natural resource management. In particular, the aesthetics of forest harvest cutblock shape, size and location are of primary importance. However, current GIS technology has not provided visualization functionality affording realistic presentations of the 3-D landscape. GIS based visualization operations are restrictive in their graphic visualization capabilities. Considering the visualization software tools available in the scientific community there has been very little integration of these techniques with commercial GIS software.
In most areas, the requirement to consider visual aesthetics of proposed resource development has been mandatory. To date, most forestry companies satisfied this requirement by presenting relatively simple 3-D perspectives showing harvest block layout from key viewpoints. Often, these representations are submitted as part of a harvest plan or public review presentation supplemented by photographs manually altered to provide a best-guess representation of the development. However, rarely have capabilities been available for governing agencies to quality assure, or contest these representations. At best, the representations have been pseudo realistic, and most typically, abstract.
With the development of more stringent practices codes and environmentally based guidelines, such as the B.C. Forest Practices Code, forest companies must provide more detailed and comprehensive visual impact assessments with development plans. These assessments require consideration of visual quality during the harvest block layout design phase and must include pseudo-realistic representations of before and after harvesting. In some cases multiple harvesting plan scenarios are required. Historically, these visualizations not only represent the subjective expertise of forest planners and engineers, but also require a significant investment in data and effort to generate each landscape simulation. Often this is achieved through consultants since many forestry agencies do not have the technical capabilities or expertise to produce appropriate products. With increased public scrutiny and demand for more realistic representations, the use of conventional GIS 3-D capabilities have become limiting, and typically fails to satisfy submission requirement. "The appearance of landscapes and individual stands after harvest operations is critical to public acceptance of timber harvest practices" (McGaughey 1997).
Forestry professionals and researchers have been investigating visualization techniques for many years addressing a variety of forest management problems. Historically, "artist renderings" were used to communicate the effect of land management activities. Recently, there has been considerable research into applying computer visualization techniques, however very little of this research has found its way into production forestry operations, or integrated with the use of GIS technology for forest planning.
Two primary factors have altered the requirement for more realistic visualization tools. First, there has been a general trend in forest management towards more detailed designs utilizing small treatment areas scattered over a large landscape. This reflects the demands of working in more contentious forested areas and the public's concern about environmental impacts. Secondly, public scrutiny and tighter practices codes and guidelines are dictating better and more accurate planning. In particular, there is a push for consideration of environmental impacts at the watershed scale, not just operational harvest areas. These factors have fueled a demand for visualization capabilities. Visual impact assessments, and their before and after simulations, have become essential components of the submission and harvest approval process.
Several examples exist of data conversion between GIS and external visualization programs, yet there is no concrete example of a forest visualization toolkit being tightly integrated with production GIS work. GIS professionals have remained generally unaware of the advances in visualization tools with forestry and landscape research. Likewise, researchers are not well versed in the capabilities or functionality readily available with today's robust and comprehensive GIS platforms.
The term "visualization" has become a hot topic in the GIS industry over the past several years. With increasing functionality and hardware developments capabilities to represent and animate 3-D images of the landscape in real time are coming on-line within commercial GIS platforms. The recent release of Esri's ArcView 3-D Analyst (Esri 1997) provides 3-D visualization capabilities in a PC environment that are rarely found in full featured GIS platforms. However, while these developments in the GIS area are impressive, they do not satisfy the explicit requirements of operational forestry for realistic representation of the landscape.
Review of Existing Technologies
Computer visualization methods range from simple 3-D perspective diagrams to complete virtual realities. McGaughey (1997) identifies four distinct categories of visualization techniques found in visualization software programs:
| geometric modeling; | |
| video imaging; | |
| geometric video imaging; and | |
| image draping. |
Geometric modeling techniques build 3-D geometric models of individual features (or components) such as trees, ground surface, plants, roads, etc. The individual 3-D objects are assembled to create a forest stand or landscape view. Scenes depicting the assembled model are then rendered given perspective from a viewpoint. The most common use of this approach utilizes simple 3-D cones for tree symbols. This was illustrated effectively by Smart et al (1990), Orland (1997), and Genasys (1995). Figure 1 presents a sample image created using geometric modeling techniques.
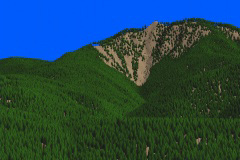 |
Figure 1. This sample 3-D visualization utilizes geometric modeling techniques to render trees on the surface. Trees have been rendered using a standard cone symbol for coniferous trees, but placement and sizing of the objects respects polygon source inventory characteristics. Shadowing is included for each tree object providing a more realistic look. Image courtesy of Robert J. McGaughey, USFS, Pacific Northwest Research Station. |
Video imaging is a computer technique using programs to "cut-and-paste" or "paint" digital photographic images in representing changes on the landscape. This approach produces high quality visualization output, but it is very manually intensive and often suffers from the artistic/subjective nature of the creation process. In many cases PC software like Adobe Photoshop is used to manipulate these images.
Geometric video imaging is a hybrid approach combining with video imaging techniques with geometric modeling, typically undertaken within GIS,. Berris (1992) illustrated the possibilities for utilizing such an approach in forestry, yet on a production basis it's rarely used. The primary difficulty arises in accurately geo-referencing the photographic video images with the 3-D perspective framework (wireframes) generated by the GIS system.
Image draping is a well established technique in GIS. It involves draping an image, such as a digital orthophoto or classified satellite imagery, onto a 3-D perspective view. Image draping results in good texture and can produce visualizations suitable for depicting landscape-scale vegetation patterns. However, image draping is not effective for representing key viewpoint visualizations, typically required for evaluating harvest block layout. In most cases the forefront of the image suffers from course pixelization resulting in an abstract impression.
Determining the appropriate method for generating visualizations is dependent on several factors:
1) the scale of representation required, 2) the level of detail needed, and 3) the availability of source data. McGaughey (1997) provides a comparison of the four visualization techniques that includes general strategies for employing visualization in forestry related projects. The lack of realistic screening is a major problem with all of the methods except geometric modeling where solid geometric shapes provide view screening, much like real trees. The other methods do not accommodate for tree height. Screening is especially critical for upslope views where trees tends to be a critical component of the view.
Two different, and to date unconnected, sources of software are available for forest visualizations:
| commercial GIS and CAD software marketplace; and | |
| scientific and research community. |
GIS and CAD Capabilities
GIS and CAD software is characterized by traditional 3-D mapping techniques, such as wireframe and light source shaded perspectives and vector and image draping. These 3-D views can be generated from specific X,Y viewpoints supporting a wide range of surface definition parameters. Full featured GIS software, like ArcInfo, also supports capabilities to enhance image rendering, such as atmospheric effects including sky, fog and haze. Recent additions also support the generation of map animations using standard MPEG encoding formats. However, GIS and CAD software typically does not have 3-D object rendering capabilities. There have been some attempts at integrating GIS capabilities with photo-imaging, but these are usually project-based and typically do not reflect a readily available functionality. Figures 2 and 3 present examples of visualizations generated using image draping techniques with ArcInfo.
 |
| Figure 2. A typical GIS based image draped visualization using classified satellite imagery. Note the harvest blocks in the forefront on the left and right of the image. Image draping techniques can be effective for helicopter viewpoints like this example. |
 |
| Figure 3. A typical GIS based image draped visualization using classified satellite imagery for a key viewpoint. Note the harvest blocks in the forefront on the left of the image. Image draping techniques typically suffer from a coarse pixelization in the forefront of the image for key viewpoint visualizations. This restricts their effectiveness. |
Scientific and Research Software Capabilities
A host of different visualization tools have been developed within the scientific and research community. Most of these reside in the public domain, and are readily available through the Internet. These software developments tend to be project-based and include more specific capabilities required for forestry. Typical characteristics of scientific visualization software include:
| focus on 3-D object rendering (geometric modeling); | |
| support for 3-D fly-bys (map animation) using public domain technology such as MPEG; | |
| some support for image morphing capabilities; | |
| some support for Virtual Reality Modeling Language (VRML), yet data sizes tend to be small; and | |
| primary distinction between stand versus landscape level project scales. |
Commercial scientific visualization software, such as AVS and IBM - Data Explorer (DX), can produce very realistic scenes. However, their high cost and complex data requirements usually limit their usefulness in forestry applications. Public domain visualization software applicable for forestry is summarized in Table 1.
Table 1. Software packages for forestry visualization (from McGaughey 1997)
| Software package | Visualization technique | Scale | HW - OS | Cost | Additional information reference |
| Stand visualization system (SVS) | Geometric modeling | Plot | PC-DOS | Free | http://forsys.cfr.washington.edu/svs.html |
| UTOOLS and UVIEW | Geometric modeling | Stand or landscape | PC-DOS | Free | http://forsys.cfr.washington.edu/utools.html |
| SmartForest | Geometric modeling | Stand or landscape | UNIX (SGI or IBM-RS6000 with OpenGL) | Free | http://www.imlab.uiuc.edu/SF/SF_II.html |
| Landscape management system (LMS)2 | Geometric modeling | All scales | PC-Windows | Free | http://silvae.cfr.washington.edu/lms/lms.html |
| Gnu Image Manipulation Program (GIMP) | Video imaging | All scales | UNIX | Free | http://www.xcf.berkeley.edu/~gimp |
| USFS, Southern Research Station visualization system | Geometric modeling | Stand or landscape | UNIX | Free | http://so4702.usfs.auburn.edu/research/prob4/standviews.html |
| VistaPro3 | Geometric modeling and image draping | Landscape | PC-DOS, PC-Windows, macintosh | $$ | http://www.romt.com/Products/VISTA/index.html |
| Persistence of vision raytracer (POV-Ray) | Geometric modeling | All scales | Many platforms | Free | http://www.povray.org POV-Ray is a general purpose ray-tracing system capable of producing detailed, realistic images of geometric models. |
| VisualFX | Geometric modeling | Stand or landscape | PC-DOS | $$ | Available from author: John
Heasley (303) 223-3149 |
| CLRview | Geometric modeling | Stand or landscape | Silicon Graphics IRIX | Free | http://www.clr.utoronto.ca/CLRVIEW/cvmain.html |
| Visual Explorer | Image draping and geometric modeling | Landscape | PC-Windows | Free, $$ | http://www.woolleysoft.co.uk/ |
| TruFlite | Image draping | Landscape | PC-Windows | Free, $$ | http://www.truflite.com/ |
Different Project Scales for Visualization
Visualizations can be characterized at three different project scales:
| plot; | |
| stand based; and | |
| landscape level. |
Each project scale represents a specific level of detail and unique requirements for generating realistic visualizations. Generally, the land area covered by these scales is loosely defined. In many cases, projects require visualization at different scales. Landscape level visualizations often are used to show altered vegetation patterns, and visual quality impacts within a valley or watershed. Stand or plot scale visualizations are typically used to show harvest unit layouts or specific stand treatments. Stand and plot scales tend to be used more for engineering purposes, while landscape level is used for planning. McGaughey (1997) provides a summary of characteristics common to visualization projects at the different scales as show in Table 2.
Table 2. Characteristics of visualization for different project scales (from McGaughey 1997)
| Project scale | Land area | Overall goal | Tree/plant detail | Typical data requirements |
| Landscape | > 200 ha > 494 acres |
Vegetation texture, spatial arrangement of stand types, location of specific treatment areas, visual quality, insect or other stand damage effect | Species, height, color, density | Topography; ground surface characteristics; stand polygons; average tree size, predominant species, and stem density for each stand |
| Stand | 2-200 ha 5-494 acres |
Harvest area layout, patch clearcut or group selection treatments | Species, height, color, density, crown characteristics | Topography; ground surface characteristics; stand polygons; tree size and species distributions for each stand, general understory conditions |
| Plot | < 2 ha < 5 acres |
Stand structure, habitat quality, silvicultural prescriptions | Species, dbh, height, crown characteristics, foliage characteristics | Individual tree characteristics, individual or aggregated understory characteristics, spatial arrangement of understory and overstory plants |
"As a general rule, the larger the project area, the less detail required in the input data and final visualizations" (McGaughey 1997). Yet often greater data volumes are needed to generate landscape level visualizations due to significantly larger areas of interest. In most cases, landscape level representations can be generated by sampling polygon-based vegetation inventories for tree characteristics. At the stand and plot scales more detailed individual tree characteristics are required.
 |
| Figure 4. A typical Stand Visualization System visualization using stand level input. |
Numerous visualization software tools are available for generating visualizations at the plot or stand level. In particular, the Stand Visualization System (McGaughey 1995) is used within the USFS and other government agencies and has successfully been linked with the USFS Forest Vegetation Simulator (FVS) program that simulates birth, growth and mortality levels of trees at the stand level. SVS is ideal as an aid in visualizing and interpreting FVS output.
SVS generates 3-D graphic images depicting stand conditions represented by a list of individual stand components, e.g., trees, shrubs, and down material. The images produced by SVS, while abstract, provide a readily understood representation of stand conditions. Images produced using SVS help communicate silvicultural treatments and forest management alternatives to a variety of audiences.
SmartForest (Orland 1997) is one of a few visualization programs focusing on the landscape level. It has capabilities to incorporate large forest databases and represent them at the landscape level. It was developed at the University of Illinois Spatial Imaging Laboratory under funding from the USDA Forest Service. Figure 5 and 6 illustrate SmartForest visualizations using output from a growth simulation model. Note the geometric modeling approach used to represent individual trees.
 |
 |
|
| Figure 5. SmartForest visualization representing forest growth model output for 1994. | Figure 6. SmartForest visualization representing forest growth model output for 1999. |
Functional Requirements for 3-D Visualization
Effective forestry visualizations require several different functional capabilities depending on the intended purpose. The primary requirement of forestry applications is the need for realistic 3-D object rendering of trees. This is particularly true for key viewpoint visualizations where tree screening is essential. As noted earlier, the geometric modeling technique is the only method that satisfies this requirement. However, several issues restrict most visualization software in rendering treed surfaces effectively:
| limited ability to create realistic 3-D tree objects resulting in stylized 3-D cones represent trees. This can be effective for coniferous landscapes, but does not accommodate mixedwood or deciduous forest landscapes.; | |
| performance times for rendering geometric modeled surfaces can be prohibitive (non-interactive); | |
| the selection of objects for rendering often is not tied to the GIS based vegetation/timber inventories resulting in unrealistic representation tree density, height, and species composition. Tree object placement is frequently randomized; and | |
| detailed data is required to support realistic tree rendering in cases where functionality exists to take advantage of such data. |
Forestry visualization software should contain the following key functional capabilities in order to support realistic rendering capabilities:
GIS based polygon sampling to generate explicit tree lists (X,Y tree locations) based on common vegetation inventory attributes (e.g. species, average tree height, basal area, horizontal density, etc.);
To date, very few visualization programs incorporate these fundamental capabilities. While several of the programs provide the basic 3-D rendering capabilities most are not tightly integrated with commercial GIS software, such as ArcInfo, in production or operational forestry settings. This level of integration should be considered a priority for visualization software developers.
The Virtual Forest
In response to the on-going demand for realistic visualization tools to support the operational and production based forestry industry, Innovative GIS Solutions, Inc. has been actively working on the development of a visualization toolkit. This development focuses on tightly integrating the advanced capabilities of scientific visualization software with production forestry GIS database inventories based on the ArcInfo GIS platform. The development project is referred to as Virtual Forest.
Virtual Forest (VF) integrates sophisticated 3-D visualization programs with ArcInfo spatial data management tools. The coupling provides an interactive platform for generating real-time images of the forested landscape with striking realism. Data is seamlessly transferred from ArcInfo GRID and vector coverages to the rendering software. Through a separate interface VF provides capabilities for the user to define Landscape Views with separate themes defining the specific visualization events. The software has been designed with a View-Theme organization similar to Esri’s ArcView. Theme types include 3-D DTM surface representation, sun illumination, visual exposure, atmospheric effects, polygon rendering and texture mapping, tree plantings (or renderings), and tree removals (or harvests). The ability to define different themes allows the user to represent multiple landscape visualizations such as different harvest cutblock design alternatives in forestry. As well, this methodology will also support temporal events that can reflect silvicultural treatment and green-up issues.
Virtual Forest is structured as two independent interfaces; the Tree Designer and the Landscape Viewer. The Tree Designer interface supports the creation and editing of 3-D tree objects. The Landscape Viewer is the primary interface for rendering 3-D visualizations utilizing the 3-D objects designed with the Tree Designer.
Tree Designer
This interface allows the user to interactively design 3-D trees. As design parameters are modified trees are previewed immediately in an adjoining window and completed designs are saved as a specific tree codes for later use. An unlimited number of tree codes (tree objects) can be saved. Through the Landscape Viewer interface tree codes can be assigned to specific attribute combinations found in the vegetation inventory data for rendering. Variation in tree object parameters affords the definition of seasonal trees, as well as trees at different stages of maturity, (e.g. no leaves, stumps, snags, etc.). Custom functions in the Landscape Viewer allow users to grow trees if appropriate age maturity classes have been defined for specific tree codes.
The Tree Designer (TD) is a key component to the 3-D visualization toolkit. To enhance the renderings undertaken in the Landscape Viewer, tree objects can be saved as rendered bitmaps with different light source shadings. The bitmaps are then utilized for subsequent 3-D rendering using texture mapping techniques. With this design, surfaces can be rendered very quickly because 3-D object shading is undertaken at the tree design stage, not at rendering time. This approach provides significant performances improvements over traditional methods of rendering treed surfaces, and results in truly interactive visualization. The Landscape Viewer also supports faster marker rendering and full 3-D object shading.
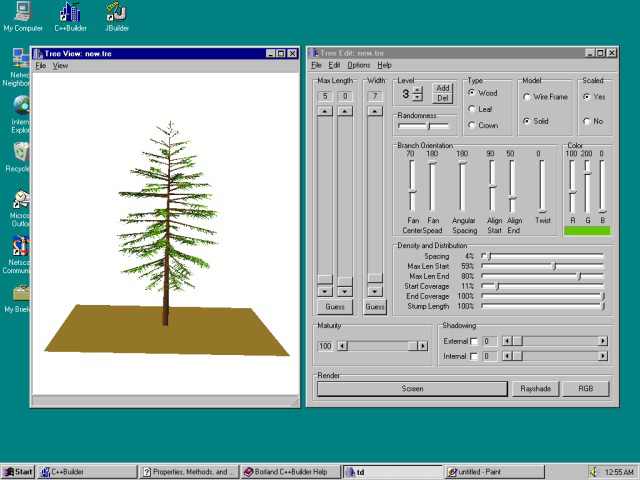 |
| Figure 7. The Tree Designer interface supports the definition of individual 3-D tree symbols to be used at rendering time by the Landscape Viewer component of Virtual Forest. |
Landscape Viewer
The Landscape Viewer (LV) is the interface for interactively creating visualizations. The current design of the interface defines temporal themes in a chronological timeline. Events represent explicit visualization actions including definition of a DTM view, sun and light source conditions, atmospheric conditions, sky conditions, vector polygon boundaries, DTM surface texturing, tree stand boundaries, planting (tree rendering), and harvesting (tree removal). Themes are dragged into the timeline area to represent a series of chronological actions taking place on the landscape. Specific events are viewed by simply dragging the date action line past the event of interest. Specific parameters are defined for each theme using standard properties menus based on the event type.
Themes (events) are viewed in an adjoining graphics display window. The orientation of the visualization view in the graphics window is controlled by a separate menu that allows users to dynamically rotate and zoom ("fly") the DTM surface interactively. Viewing parameters can also be set to defined viewpoint parameters.
Click on the image to view in full detail |
 |
| Figure 8: The current Landscape Viewer interface is comprised of the Event Definition menu (bottom left), the graphics display window (top), and view orientation menu (bottom right). |
The current LV interface utilizes a free form process for defining landscape visualizations, freeing the user from specific rules defining the order of themes. Simple or complex series of actions on the landscape can be modeled.
Development is currently underway to simplify the interface with a less complex work flow based interface. This is in response to specific operating needs of several forestry clients. Views are bundled into individual Projects analogous to Esri ArcView concepts. This approach has the advantage of being familiar to existing users of Esri products while supporting a temporal definition of complex management actions on the landscape typical to operational forestry.
Overview of Capabilities
The capabilities of Virtual Forest satisfy the mandatory list of functional capabilities identified earlier in this paper. These focus on providing a full range of 3-D tree rendering functions that are tightly integrated with ArcInfo data structures.
Data Specifications
The data logic of the software distinguishes between fundamental data components including:
| DEM surface (multi-dimensional array grid surface referred to as a DTM); | |
| Polygon geometrics (typically converted from GIS polygon coverage of forest stands); | |
| Forest areas (polygon containers for the rendered trees); and | |
| Plantings (rendering or placement of trees). |
Data is stored in formats optimized for retrieval, but a suite of data conversion tools are available to convert ArcInfo data (and other standard data formats) into the required formats. Data conversion is seamless and in real time.
The DEM data structure is stored as a multi-dimensional array. This approach is designed so that key DEM components, such as light source, visibility matrix, and elevation are easily retrievable from the surface and do not need to be calculated during the rendering process. The multi-dimension array is generated at the time of conversion from standard DEM formats.
Explicit tree lists are generated at the time of polygon data conversion from GIS coverages. Explicit X,Y tree locations are not required as specific input by the user. A tree list is generated during the conversion of the polygon inventory data. The explicit sampling of tree locations created in the tree list file is derived from an algorithm based on a unique combination of stand attributes. In addition to the generic sampling converter, there is a custom converter for the USFS Stand Code methodology.
Rendering Specifications
Three different techniques are supported for tree rendering:
| linear markers or sticks - (typically used for very quick displays during design activities) ; | |
| texture mapping (light source shaded bitmaps) ; and | |
| full 3-D shaded geometric objects. |
Because tree lists utilize tree code lookups, the surface can be rendered with an unlimited number of different tree types. Mixed wood landscapes, over-mature, snags, and other conditions are easily depicted, as well as seasonal representations. Since texture mapping is used for rendering the trees on the surface there is no difference in performance for seasonal or mixed tree renderings. Figure 9 presents a detailed view of tree objects in a typical rendering.
Virtual Forest also supports simple growth modeling based on percent maturity definitions of tree codes. This provides an ideal framework for illustrating greenup issues. The approach has potential for customization based on user defined growth-yield curves to support growth modeling based on such factors as species type. This could also be used to address temporal issues such as mortality rates, pest/insects infestation, and over mature snags.
 |
| Figure 9: This figure illustrates the level of detail of the rendered trees on a typical image generated by Virtual Forest. |
The following statements summarize the primary rendering capabilities supported in the initial development of Virtual Forest.
Atmospheric effects can be added as events using several different techniques. The primary techniques include sky, haze and fog representation.
Polygons can be rendered using bitmap based texture mapping. This technique allows the pseudo realistic rendering of roads (harvest roads), cutblocks (scarified, early treatment, etc), water, and other landscape features. Figure 10 illustrates simple polygon texture mapping applied for a typical rendering.
 |
| Figure 10: This figure illustrates simple polygon texture mapping techniques applied to a harvest block and logging roads. |
Using 2-D boundary geometry features can be extruded onto the surface as 3-D containers (walls). Parameters for the polygon representation such as height of walls, symbology for display of nodes, arcs, and vertices, are user definable.
Full 3-D model capability for on-screen digitizing polygons on the surface and render or remove trees. Object (tree) removal can utilize either a "percent removal" (complete removal of objects) or "harvest" approach (partial removal leaves stumps). This is ideal for representing selective harvesting on blocks instead of a clear cut approach.
Visualization Example
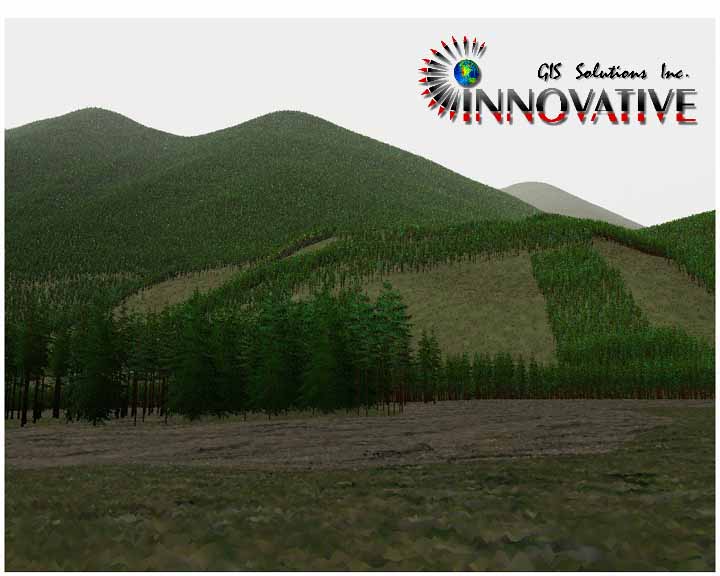
The following examples presented in Figures 11 - 13 represent typical images generated by planting and harvesting trees on a landscape viewed from a key viewpoint. The trees are placed using Tree Designer symbol lookups to a sampled ArcInfo forest inventory. Individual tree symbols are derived using a combination of typical forest stand attributes. In the example, trees were planted and then harvested using specific cutblock polygons. Texture mapping techniques are used to provide additional realism to foreground, harvest areas, and roads. Atmospheric effects, in particular fog and haze, have also been added.
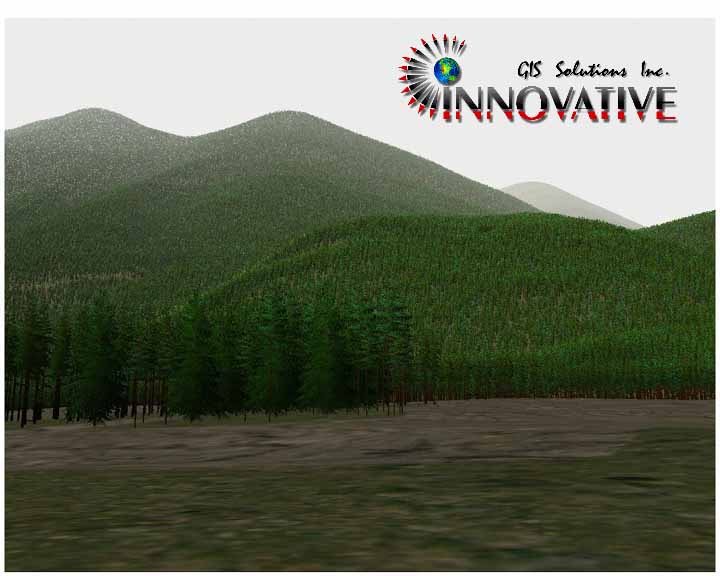 |
| Figure 11. 3-D viewpoint visualization of a fully treed landscape. Note the visual screening effect of the stand in the foreground. Texture mapping techniques have been used to provide a more realistic effect to the ground/soil. Fog and haze has also been added in the background. |
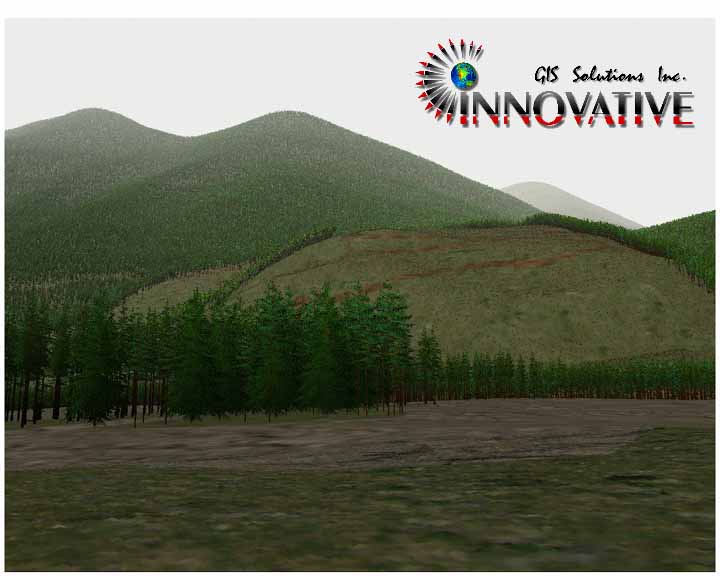 |
| Figure 12. 3-D viewpoint visualization of an initial clear cut harvest block. Trees have been removed from the landscape based on harvest cutblock polygon definitions. |
 |
| Figure 13. 3-D viewpoint visualization of a modified harvest block. Trees have been removed from the landscape based on revised harvest cutblock polygon definitions. |
Summary
This paper provides an overview of the issues and considerations required for effective 3-D visualization of forested landscapes. Examples have been provided that illustrate the primary visualization techniques from the GIS and scientific software community. Overall, opportunities exist to integrate scientific visualization techniques with commercial GIS. In particular, the proliferation of the Internet and WWW has provided a suite of new software tools to the GIS developer.
Specifically, this paper illustrates the opportunities available to extend landscape analysis by integrating scientific visualization techniques with ArcInfo. The complementary nature of the two technologies results in an operational platform for foresters and natural resource specialists to consider engineering and harvesting design alternatives. The striking realism of the visualizations generated by Virtual Forest will enhance foresters ability to communicate planned management activities on a landscape. Future development is planned to extend these capabilities to specific geographic and agency requirements.
Acknowledgments
Much of the introduction and summary information provided in this paper was compiled by Robert J. McGaughey of the USDA Forest Service, Pacific Northwest Research Station. Mr. McGaughey is the author of the Stand Visualization System (SVS), and a leading researcher in the field of landscape visualization. He can be reached via e-mail at : mcgoy@u.washington.edu.
References
Bergen, S. D., C. A. Ulbricht, J. L. Fridley and M. A. Ganter. 1995. The Validity of Computer Generated Graphic Images of Forest Landscapes. Journal of Environmental Psychology 15:135-146.
Bergen, S. D., J. L. Fridley, M. A. Ganter and P. Schiess. 1995. Predicting the Visual Effect of Forest Operations. Journal of Forestry 93(2):33-37.
Berris, C., GIS and computer Video-Imaging in Forest Landscape Management, 1990. GIS'90 Symposium Proceedings, Vancouver, B.C.. p47-53.
Bishop, I. D. and P. N. A. Leahy. 1989. Assessing the Visual Impact of Development Proposals: The Validity of Computer Simulations, Landscape Journal, 8, 92-100.
Esri. Information on ArcView 3-D Analyst is available from the Esri Web Site at http://www.Esri.com/base/products/arcview/extensions/3dext.html.
GenaTIN Promotional Material and demonstration prototype undertaken for MacMillan Bloedel Ltd. (Nanaimo, B.C.). Genasys Party II Ltd. Fort Collins, Colorado. 1995. GenaTIN product information can be found at the Genasys Web Site : http://www.genasys.com/homepage/products/brochures/GenaTIN.html.
McGaughey, Robert J. 1997. Visualizing forest stand dynamics using the stand visualization system. In: Proceedings of the 1997 ACSM/ASPRS Annual Convention and Exposition; April 7-10, 1997. Seattle, WA. Bethesda, MD: American Society for Photogrammetry and Remote Sensing. Vol. 4:248-257.
McGaughey, Robert J.; Ager, Alan A. 1996. UTOOLS and UVIEW: analysis and visualization software. In: Proceedings of the sixth biennial USDA Forest Service remote sensing application conference; April 29-May 3, 1996; Denver, CO. Bethesda, MD: American Society of Photogrammetry and Remote Sensing. 319-329.
McGaughey, R. J. 1997. Techniques for visualizing the appearance of timber harvest operations. In: Forest operation for sustainable forests and health economies. 20th annual meeting of the Council On Forest Engineering, 1997 July 28-31, Rapid City, SD 10 p.
Nickerson, D. B. 1979. SIGHTLINE, PERSPECTIVE PLOT, SLOPE--three desktop computer programs for forest landscape design. Journal of Forestry 77(1): 14-17.
Orland, Brian. 1997. Forest visual modeling for planners and managers. In: Proceedings of the 1997 ACSM/ASPRS Annual Convention and Exposition; April 7-10, 1997. Seattle, WA. Bethesda, MD: American Society for Photogrammetry and Remote Sensing. Vol. 4:193-203.
Smart, J., Mason, M., and Corrie, G., Assessing the Visual Impact of Developing Plans, 1990. GIS'90 Symposium Proceedings, Vancouver, B.C., pp19-27
Ulbricht, C.A., 1994. Vantage Point: An Interactive Landscape Simulation Tool for Engineering Design. M.S. Thesis, College of Engineering, University of Washington, Seattle.
Visual Impact Assessment Guidebook, 1995. Forest Practices Code of British Columbia. B.C. Environment.
About the Authors
David J. Buckley is a Principal Consultant with Innovative GIS Solutions, Inc., custom application developers for integrated natural resource management GIS solutions.
Innovative GIS Solutions, Inc. (IGIS)
2000 S. College Avenue, Suite 300, Fort Collins, Colorado, USA 80525-1484
Phone (970) 490-5900 Fax (970) 490-2300
Joseph K. Berry is President of Berry and Associates, consultants and software developers in GIS technology and a Special Faculty member at Colorado State University.
Berry and Associates // Spatial Information Systems, Inc.
(BA_SIS)
2000 S. College Avenue, Suite 300, Fort Collins, Colorado, USA 80525-1484
Phone (970) 490-2155 Fax (970) 490-2300
Craig Ulbricht is the primary developer of Virtual Forest software with Innovative GIS Solutions, Inc.
David J. Buckley, Principal Consultant, Innovative GIS
Solutions, Inc. ( buck@innovativegis.com )
Craig Ulbricht, Software Developer, Innovative GIS Solutions, Inc.
Joseph K. Berry, President, Berry & Associates, Inc. ( jberry@innovativegis.com )
 |
 |
| Suite
300, 2000 South College Ave. Fort Collins, CO 80525 E-mail: jberry@innovativegis.com WWW: http://www.innovativegis.com/basis |
Telephone:
(970) 490 - 5900 |