JOHN ROSS
THE DATA ACCEPTANCE
PROCESS: TOO OFTEN OVERLOOKED
Abstract
Utilities often spend millions of dollars to construct very large AM/FM/GIS databases which serve as the cornerstone for important future applications. All too often the process of Data Acceptance is given very little thought or left out of project plans completely. PP&L has established a process which includes running QCView Data Acceptance software, reviewing QC reports, inspecting data using an ARC/INFO viewing application, preparing documentation, correcting selected errors, officially accepting data and loading data. This paper will review the Data Acceptance process and many of the ARC/INFO tools developed to check for problems such as edge-matching, arc connectivity, and annotation justification.
GIS Project
PP&L began the GIS data conversion project in May of 1996 and completed it in May of 1999. The GIS supports approximately 100 concurrent ARC/INFO users editing the Electric Facilities Database (EFD) through Miner & Miner’s PowerTools applications. The applications include MMEdit for database maintenance and JPDE for engineering design. Attribute data is stored in Oracle. All of the data is housed on an HP v-class server.
Conversion Issues
The high cost of data conversion is often considered in the amount of money that is paid to a conversion vendor. However, not enough attention is given to the internal resources that are needed for conversion, in particular resources needed for the data acceptance process.
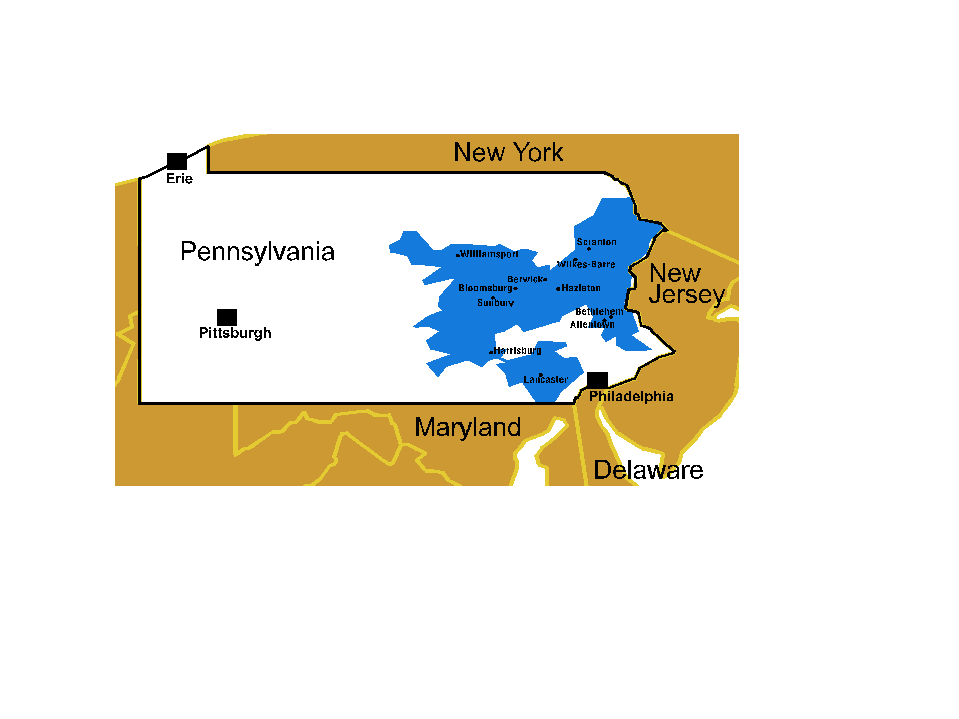
The PP&L service area covers 10,000 square miles in central eastern Pennsylvania. It is divided into 5 regions and 16 operating areas. There was a sizeable amount of data to be converted off of paper maps and out of the legacy systems:
PP&L Service Area
Data returned from the vendor was greater in size. Handling, reviewing and loading of this data required significant effort and resources by the data acceptance team. The data received from the vendor included:
In addition to size, there were issues around the complexity of data delivered by the conversion vendors. The conversion specification called for two annotations for each feature (100 and 400/800 foot scales), feature-inked annotation, UG configurations from multiple sources, bus work in cabinets, and four paper map products. There were requirements to populate 40 tables and 12 GIS layers.
Two conversion vendors were hired to accommodate the very aggressive schedule PP&L wanted to implement. Using more than one vendor created data quality concerns: 1) explanations of the specification were sometimes not communicated to both parties, resulting in different interpretations which caused inconsistent data to be delivered; 2) it was sometimes difficult for the vendors to share data for edge-matching purposes.
The specification called for data to be converted based on explicit criteria. Data was checked in 25 different categories. These categories were contracted to achieve an accuracy rate of either 98% or 100%. The 100% rate was for more important categories or the categories that were easiest to achieve.
What is Data Acceptance?
Data acceptance is the formal acceptance of data deliveries from the conversion vendor based on contractual criteria. It includes:
Visual Acceptance is the process of reviewing paper plots delivered by the conversion vendor. Data Acceptance involved downloading data from the conversion vendor, running software checks, reviewing errors, documenting problems, and developing statistics.
QCView software was used to run 1,200 checks on each of the 171 deliveries. Types of checks included coverage level checks that evaluated for problems with coordinate systems, topology, and double precision. Attribute data was checked in the categories of Consistency, Valid Values, Relates, and many more. Other checks were customized for PP&L including Phase checks, Connect checks, and an annotation check that compared the pseudo item $text against the data stored in the Oracle database.
During the course of the conversion project a number of new checks were developed as persistent errors were detected in data returned by the vendors. These included trace checks, annotation checks and edge match checking. The AMLs were shared with the vendors to assist them in delivering high quality data.
Once a data review was complete, error statistics were compiled. If the scores were acceptable, data was loaded into the Production ArcStorm/Oracle database.
Hardware/Software Environment
To run QCView it was necessary to set-up a network to support all of the QC needs. Four HP UNIX workstations and a HP server were used. Twelve ARC/INFO licenses and twelve Oracle copies were necessary to enable 12 data deliveries to be stored simultaneously. The data reviewers could be working on up to 3 deliveries at one time in different stages of the data acceptance process.
Staffing
An important objective of PP&L during the conversion project was to finish as soon as possible. One concern expressed by the conversion vendor was that PP&L would not have enough people involved in QC to formally accept data. Contractually, PP&L was obliged to review and accept/reject a data delivery within 30 calendar days. The number of people involved in data acceptance was determined by the requirement of keeping up with the production of the conversion vendors. A process goal was developed for a data reviewer to complete the acceptance process on a delivery in five days.
The QC process was split into two tracks, one to review data delivered in ARC/INFO coverage format and Oracle dmp files, the other to review paper plots delivered by the vendor. The visual acceptance team was made up of 7 people. For each new region being converted there was an effort to repopulate the team with people from that region because of their familiarity with the sources.
The first two regions reviewed 100% of the plots delivered by the vendor. The remaining regions reviewed only 10% of the plots due to increased accuracy achieved by the vendors and the lack of available resources to review plots.
The challenges were different for the group reviewing data. A person involved in data review was required to be knowledgeable in the database design, conversion specification, ARC/INFO, Oracle and UNIX. PP&L did not have a single person who had all of those skills. A team of four was assembled. Each member had skills in one or two of these required specializations. A working environment was established to foster cross training and knowledge sharing.
In order to accomplish the performance goal of one delivery reviewed by one person in five days a "production" work environment had to be employed. The repetitive nature of this type of work was something to which PP&L employees were not accustomed. A lot of attention was given to making sure that these employees would not burn out.
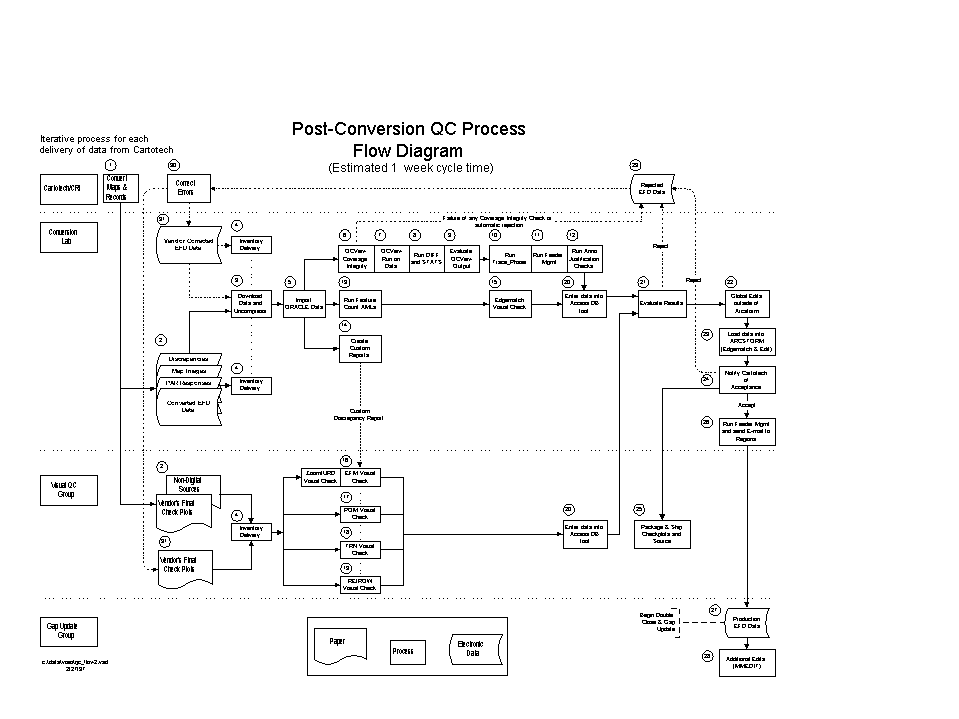
Development of the Process Flow Diagram below helped in identifying performance measures, the resource needs and staffing levels.
Partnership with Vendors
To finalize the development of the QCView software, several people worked with the vendors at their locations for several months. It was important that the conversion vendors conform to the notion of using the QCView software at their site. Working closely with the vendors allowed them to make important contributions to the development of the software. Spending time with them on-site helped to form a better relationship, finalize the software, improve data quality and keep on schedule.
Conclusion
The data acceptance process is a critical component in the development of GIS at large utilities. Utilities invest large amounts of money and resources in the development of GIS databases with the intent to develop many important applications. An effective data acceptance process can save considerable amounts of money and insure that data quality meets required levels of accuracy.
For those beginning a new GIS project:
Author Information
John Ross
GIS Team Lead-Technology Support
PP&L
2 North 9th Street
Allentown, PA 18101
610.774.7155 wk
610.774.6450 fax
jross@papl.com