GIS FISCAL IMPACT ANALYSIS MODEL
Prepared by: Jeff Bronow, Tischler & Associates, Inc.
Abstract: Fiscal impact studies evaluate the impact new growth has on local budgets. The question "Does growth pay for itself?" is of increasing concern in many communities across the country. A GIS tool has been developed and linked to a customized fiscal impact model utilizing the case study marginal cost approach. "What-if" scenarios can be "drawn" on a map and instantly analyzed. Tischler & Associates, Inc. (TA) has conducted over 300 fiscal analyses with their proprietary software systems. The following focuses on TA's new FISCALS GIS system.
BACKGROUND ON TISCHLER & ASSOCIATES, INC.
Tischler & Associates, Inc. (TA) is a fiscal, economic and planning consulting firm offering professional services to public and private sector clients. TA conducts comprehensive studies supported by accurately derived data and detailed analysis. The professional services offered by the firm include:
TA has worked throughout the country conducting the types of analyses and performing the various services listed above. It has performed more fiscal impact evaluations and impact fees than any other firm in the country.
WHAT IS FISCAL ANALYSIS?
A fiscal impact analysis projects the net cash flow to the public sector resulting from new residential and nonresidential development. It does this by identifying and calculating the increases in operating and capital costs and revenues associated with new development. A fiscal analysis will indicate whether, when, and to what extent a jurisdiction could face deficit or surplus budgets. Based on the fiscal impact information, the local government is able to weigh land use policy decisions, acceptable levels of service, plans for capital investments, and long term borrowing needs.
Fiscal analysis is a useful tool for evaluating the impacts of land use policies, demographic and economic changes, rezonings, annexations, level of service changes, and development density alternatives, among other issues.
TA's FISCALS MODEL
The FISCALS Model is a comprehensive system developed in Microsoft Excel that is custom-tailored for each community. Once designed, the system can be modified and updated to test various "What if?" scenarios. Evaluations include, but are not limited to, changes to the type, extent, location, and timing of land use development, the local budget, real estate market, and the level of government services. The system can analyze an entire jurisdiction or a particular geographic area or development project. It can project fiscal impacts 20 or more years into the future or calculate short term impacts. FISCALS can also be used to forecast capital improvement needs and capacities in relation to geographic location, determine capital financing alternatives, and forecast departmental staffing needs.
WHY FISCALS GIS?
Many jurisdictions have invested a lot of time and money in developing Geographic Information Systems. The majority of the time and expenditures have been used to create large land use databases and GIS layers that contain information about the jurisdiction's current and planned land uses, infrastructure, and socioeconomic and demographic characteristics. The next step is to use this valuable information and structured analytical environment to develop an understanding of the issues facing the jurisdiction, answer key questions, and plan for the future in a knowledgeable way. How is this done? By using tools specifically designed to take advantage of and tap into the GIS in an intelligent and focused manner.
FISCALS GIS is one of these tools. By being able to "draw" future land uses on a map, FISCALS GIS provides an easy interface to evaluate the fiscal impacts of future land use alternatives. It can be used by local planners, finance and economic development professionals familiar with GIS. For example, the Planning Department can analyze the fiscal impacts of zoning or re-zoning decisions, potential annexation, and development plans. The Finance Department can use FISCALS GIS to determine the future operating and capital facility needs and costs from new development. The system can be used as a visual tool during public hearings and presentations, clearly communicating the fiscal impacts of land use decisions. The system can also be used as a database to keep track of development and the associated fiscal impacts over time. The results can even be put on the internet in the form of charts, graphs, maps, and text describing land use development issues and enabling easy access by local residents.
TA's NEW FISCALS GIS MODEL
FISCALS GIS is a new extension to the basic FISCALS spreadsheet model. It provides a new way for users to represent development proposals. Instead of typing data describing these development proposals into the spreadsheet, users "draw" development proposals on a base map of the County. Each development proposal is represented as a polygon, and each of these polygons contains population, employment, and other attributes which describe the extent of the proposal. FISCALS GIS provides an automated mechanism to summarize all of these development proposals, by year, and will place them into the FISCALS System where their fiscal impacts can be estimated. FISCALS GIS is customized for each local jurisdiction, conforming to the jurisdiction's particular budget, tax base, land uses, service provisions, infrastructure, and geographic characteristics.
A planner has used FISCALS GIS to draw four new developments in this year 2000 scenario - a commercial project, two medium density residential projects, and a high density residential project. Population, employment, and other data associated with these developments will automatically be summarized. The FISCALS model can then evaluate the fiscal impacts associated with them.
Users who create new land use layers showing development proposals and future land uses can print these maps. Each map presents specific visual information about the locations and types of growth anticipated in the future, along with the fiscal impacts associated with it.
FISCALS GIS uses the desktop geographic information system ArcView, developed and distributed by the Environmental Systems Research Institute of Redlands, California. Esri is the worldwide leader in geographic information systems. FISCALS GIS requires users to have already installed ArcView GIS on their desktop computers (Version 3.1). ArcView will run on all Windows-95/98/NT machines. No special requirements are needed, although a relatively newer computer having over 32mb of RAM and running over 150mhz is highly preferred.
Using FISCALS GIS, users can create a new scenario for analysis purposes. A scenario might represent a certain study or a certain project that has arisen in the community. For example, FISCALS GIS might be used to analyze the fiscal impacts associated with a new proposed Wal-Mart. Or, FISCALS GIS might be used to analyze the fiscal impacts associated with a new proposed industrial park. Or, FISCALS GIS might be used to look at forecast growth for the jurisdiction over the next twenty years. In each of these cases, the planner can create a new project scenario. The planner might call the three scenarios offered as examples above, "Walmart", "IndustrialPark", and "GrowthForecast". In fact, the planner can name these scenarios anything - the point is that the planner can create new scenarios and can visit them again in the future. The results can be easily communicated to departmental staff, elected official, and the local residents. The can even be posted on the internet in easy to read charts, graphs, maps, and pictures.
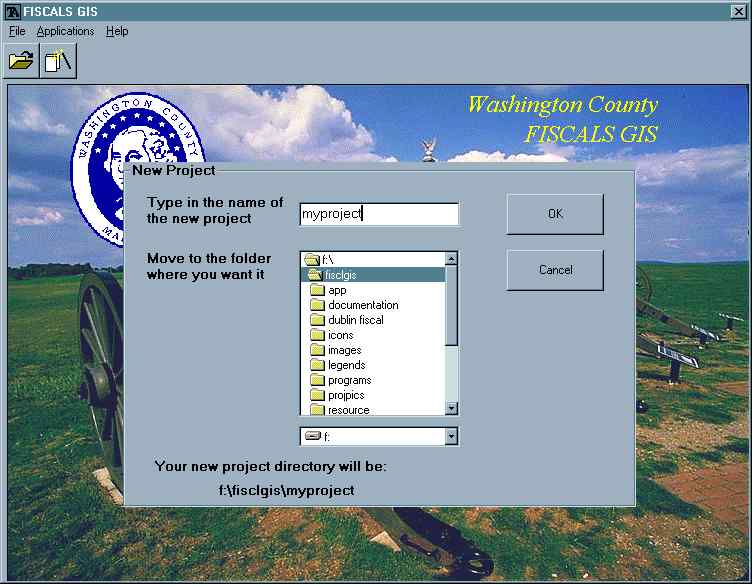
In this example, the planner wants to create a new project scenario called "myproject" on the F: drive under the \fisclgis folder.
Every scenario consists of a number of yearly views. These yearly views represent future development proposals (or future land use) associated with the future. For example, you might create yearly views for the years 1999 (a base year), 2000, 2005, 2010, 2015, and 2020 - that is, five year intervals through the year 2020. Each yearly view represents development projects built during the prior five year interval. You are not constrained to five year intervals, of course. You can create any yearly view that you want. FISCALS GIS gives you the ability to create and delete yearly views that together represent a forecast series of development by year.
Associated with each yearly view is a geographic data layer for that year. This geographic layer consists of land uses proposed to be built during that year (or proposed to be built over the previous period). The geographic data layer would consist of polygons (i.e., parcels) representing residential subdivisions, shopping centers, office complexes, industrial parks, and/or any other types of development proposed to be built during that year. In addition to the polygons themselves and the land use code associated with them, each polygon has attribute data which describes the quantity of development associated with the development project.
You use this form to identify what kinds of features you want to appear in the new yearly view window. Land use features are shown on the left side of the form. Various background features appear in the center of the form.
In each case, land use layers can be drawn in "muted" colors if desired. These are regular colors associated with the various land uses, but "muted" so when you look at the resulting map you can easily tell the difference between projects that you are drawing for the current view window and those that you have already drawn for previous development years.
In addition, there are different background feature maps that can also be shown in the new yearly view window depending on the land use coverages the local GIS has. These may include Fiscal Impact Zones, City boundaries, Town boundaries, Interstate Highways, Major State Highways, Minor County Roads, Railroads, Rivers and Watercourses, and LANDSAT an SPOT images.
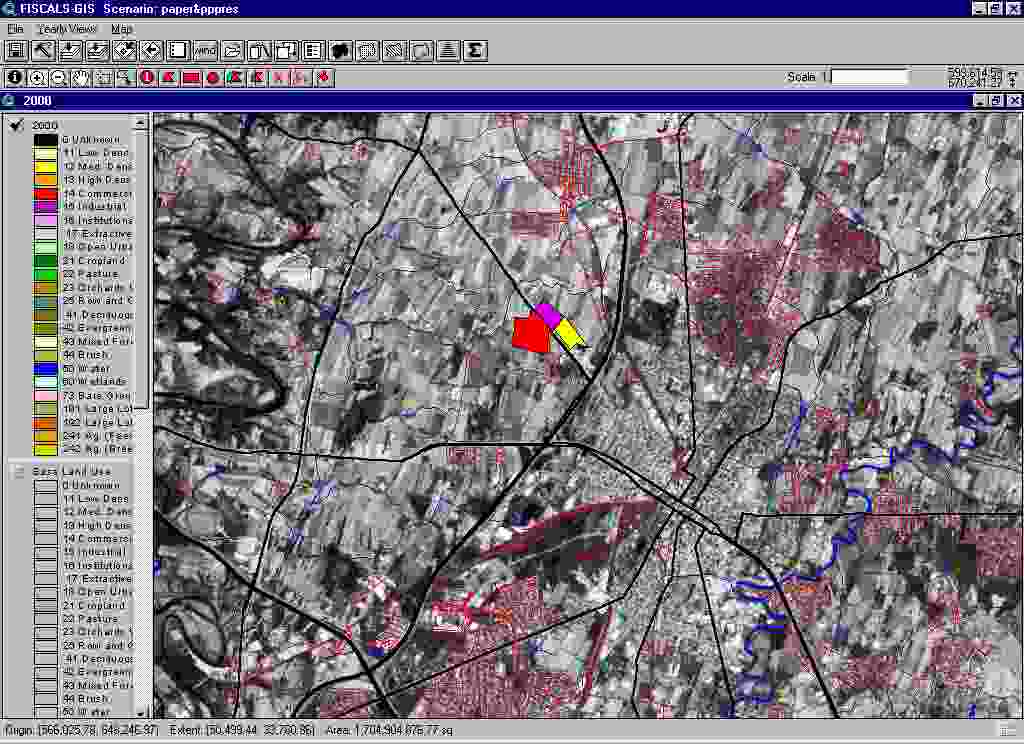
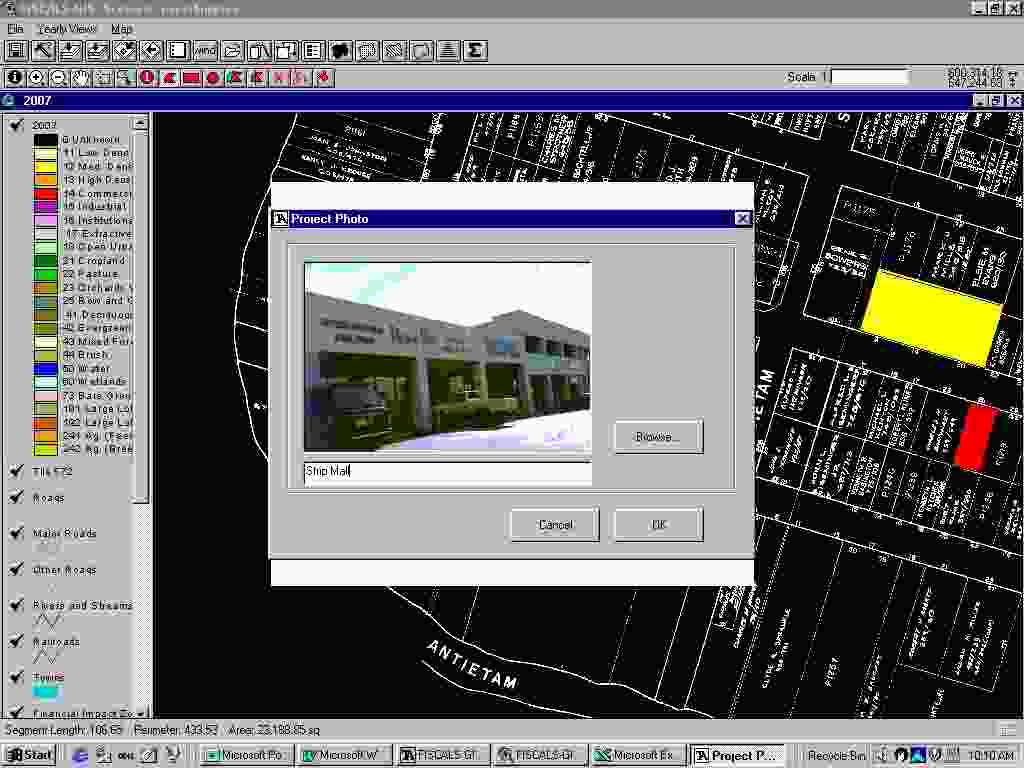
This above is an example of future land uses drawn on a SPOT map with overlays of major and minor roads, rivers, and rail lines. Below a parcel map is used to analyze a re-development project. Pictures can also be used in FISCALS GIS to identify projects.
Once a project is "drawn," the user can then defines the detailed characteristics of the project. The following form appears when coding new attributes for a project:
You use this form to code the attributes for a new development project polygon. Establish the land use code for the project with the drop-down choice box - click on the appropriate land use code in this box. Then, type in the values for the project that you want.
There are default density values established for land uses, so when a land use is established, the text boxes for the attributes in the "Fill in the Attributes" frame will be automatically coded based on the size of the polygon (its acreage). To see, or to modify those default density values, click on the "Defaults" button. The following will appear (for residential land uses):
This form reports default densities, vacancy rates, and average household sizes for the residential land use that has been established for the polygon. You can change these values by merely typing new ones in the text boxes. Population and Dwelling Unit attributes for the polygon will automatically change with the "OK" button.
This is the default density coding form associated with employment-oriented or commercial land uses. Note that total employment for the land use is estimated based on the FAR, the average square footage per employee, and the vacancy rate associated with the polygon (and the size of the polygon, in acreage).
Once the project development proposals for each year have been defined, the next step is to use FISCALS to analyze their fiscal impacts. Follow these steps to do this:
1. ![]() First, execute a land use summary with the summarization button. This assures that the land use summary available for the scenario is the latest available.
First, execute a land use summary with the summarization button. This assures that the land use summary available for the scenario is the latest available.
2. ![]() Next, activate the Excel application using the "Fiscals" button in the FISCALS GIS application.
Next, activate the Excel application using the "Fiscals" button in the FISCALS GIS application.
3. Click on the Read Sum File button on the Excel worksheet. Land use summaries associated with the project scenario that you have created in ArcView are now known by the fiscal model. Note that, like the GIS component of FISCALS GIS, the fiscal model component can also be customized. Budgetary and tax structures, departmental staffing, levels of service, capital facility capacities, useful life, and associated costs, and other variables can all be changed to test any number of "what-if" scenarios.
This is the first page of the FISCALS model. By Pressing "Read in Sum File," the fiscal model analyzes the fiscal impacts of the development scenario that you "drew" on the map.
The fiscal results are then instantly known. The tables below provide a sample of some of the outputs provided by FISCALS GIS. They include annual and average annual net revenues by geographic area, as well cost and revenue details.
Overall, FISCALS GIS is a customizable and comprehensive fiscal analysis system that can take advantage of a jurisdictions existing GIS. By using FISCALS GIS, the impacts of future land use development scenarios and policies can be determined and the results and can be communicated in an efficient and effective manner.
FURTHER INFORMATION
For further information, please contact:
Tischler & Associates, Inc.
4701 Sangamore Road, Suite N210
Bethesda, MD 20816
Phone: (800) 424-4318, (301) 320-6900
Fax: (301) 320-4860
Web Address: www.tischlerassociates.com
Email: tafiscal@tischlerassociates.com