Citizen-initiated Conservation
Planning and GIS
Abstract
Local governments and citizen groups
are becoming increasingly concerned with the effects of urbanization, especially
as it relates to loss of wildlife habitat. The Sonoran Desert Protection
Plan (SDPP) is a citizen-initiated planning effort to develop a regional
reserve system that protects biotic communities unique to the Sonoran Desert.
SDPP objectives include using GIS to identify and map areas of high biological
resource value in a cost-surface modeling environment. I will describe
an intuitive, transportable methodology developed to form the foundation
of a community-based conservation plan. The results reflect both community
and biologic values in identifying areas important for conservation.
Introduction
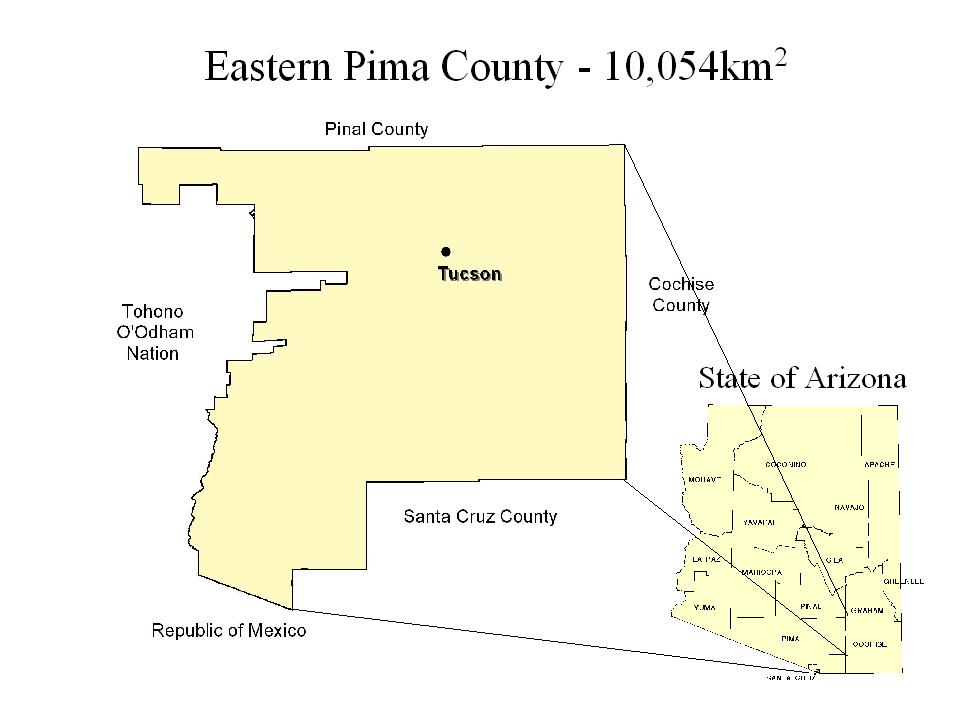
Pima County, Arizona officials expect the Tucson urban area to grow by 160 square miles in the next 20 years. Increased urbanization will result in loss of native vegetation, destruction of wildlife habitat, and fragmentation of the landscape. As an alternative to growth insensitive to environmental constraints and conservation values, the Coalition for the Sonoran Desert Protection Plan formed to provide a proactive vision and methodology for conservation planning in eastern Pima County. The objectives of the Sonoran Desert Protection Plan (SDPP) include 1) mapping, for a list of focal species, the areas of eastern Pima County of high biological resource value, and 2) identifying linkages among areas of high biological resource values. The SDPP is based on an intuitive, transportable 5-step methodology:
The study area consists of Pima County,
Arizona east of the Tohono O'Odham Reservation. It is bounded on the north
by Pinal County, the east by Cochise County, and the south by Santa Cruz
County and the Republic of Mexico.
Focal species
The focal species in this analysis is the Mountain Lion (Felis concolor).
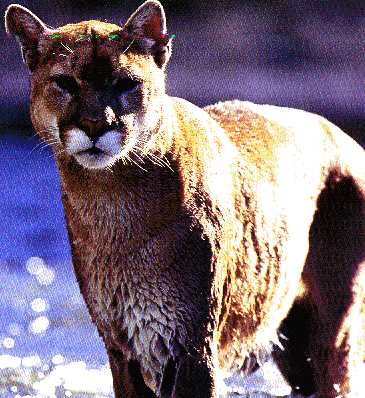
I chose the Mountain Lion because individuals require a large home range and habitat is patchily distributed in the sky island ranges. Therefore, a reserve system for Mountain Lions would necessarily consist of large units distributed across much of the study area. Additionally, I could assess the potential for connectivity between units of a reserve system.
I rely on the work of Logan et al. (1996)
and Beier (1993, 1995) for natural history information.
Methods
I collected numerous maps of natural and anthropogenic landscape characteristics including vegetation, roads, topography, human population density, zoning designations, subdivisions, parks, land ownership, open space, and distribution of Mountain Lion habitat.
The Arizona Gap Analysis Project provided the vegetation and Mountain Lion distribution themes. The Arizona Lands Resources Information System provided the topography theme (90-m Digital Elevation Model). The Pima County Department of Transportation provided all remaining data. I clipped all statewide themes to the extent of eastern Pima County, and projected all coverages and grids into UTM, zone 12, meters, NAD 27. I added a density attribute to the Pima County and Marana zoning themes. To conduct the connectivity analysis, I converted vector information to a raster format with a cell size of 100m. This resolution is based on the area within which Mountain Lions interact with their landscape (personal communication, Beier 1998)
I derived a road density theme using the rasterized road map by cumulatively summing the number of linear km of road per km2 of area. I then sliced the density values into 5 parts.
I assigned weights to each landscape characteristic based on the potential impact of that characteristic on managing the landscape for conservation purposes. Characteristics with the lowest potential to adversely affect management for conservation purposes (e.g., parks, open space, natural vegetation, topography, and Mountain Lion habitat) achieved a weight of zero (0). Characteristics with the highest potential to adversely affect management for conservation purposes achieved weights >= 1 (Table 1). I performed an intuitive sensitivity analysis, based on a synthesis of information found in the literature, to assign these weights.
I derived the penultimate map by using map algebra to "add" the cell values associated with each landscape characteristic in each weighted attribute map. The result is a friction map or cost surface. I then created the final map by overlaying the cost surface with the Mountain Lion habitat theme.
I used ArcInfo to ascertain the frequency with which many landscape characteristics coincided with Mountain Lion habitat. For example, I computed the area of each type of landcover within primary and secondary Mountain Lion habitat (Table 2).
Additionally, I used FRAGSTATS (McGarigal
and Marks 1995) to calculate the landscape statistics on patch, class,
and landscape level information. I used ArcInfo and ArcGrid to conduct
all other analyses.
Results/Discussion
Landscape characteristics
I analyzed many natural and anthropogenic landscape characteristics, for example:
Partially developed - 15.42
Undeveloped - 4.73
Existing - 112.76
Proposed - 175.38
Not classified - 0.73
Catalina State Park - 22.29
Coronado National Forest - 1372.01
Saguaro National Park (East) - 272.42
Saguaro National Park (West) - 85.26
Santa Rita Experimental Range - 213-18
Bureau of Reclamation - 12.12
Indian lands - 292.01
Military reservations - 43.65
National forest lands - 1367.39
National parks and monuments - 315.85
National wildlife refuge - 454.58
Non-federal parks - 45.32
Other - 3.52
Private lands - 3196.93
State lands - 3536.07
Habitat statistics
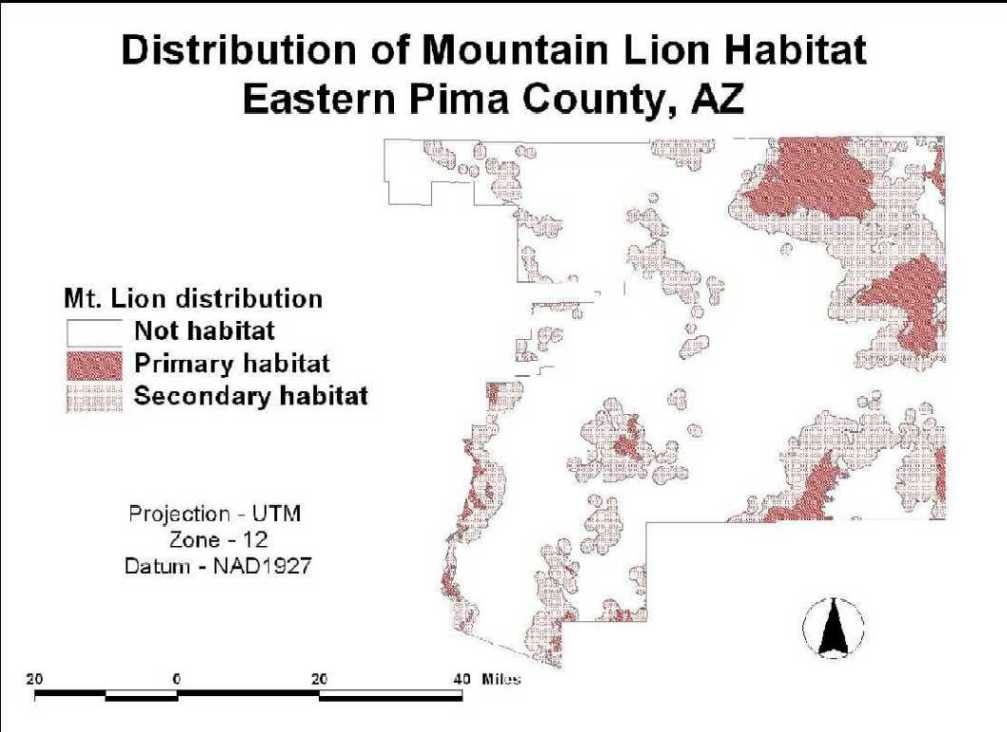
Mountain Lion distribution is divided into 3 types of habitat. Non-habitat covers approximately 66% of the landscape (6,622 km2), primary habitat covers approximately 8% of the landscape (837 km2), and secondary habitat covers approximately 26% of the landscape (2,595 km2) (Halvorson et al. 1998). Primary Mountain Lion habitat is distributed in 39 patches within the study area. The average patch size is 21.47 km2. Secondary habitat is distributed in 84 patches. The average patch size is 30.89 km2.
Home range size
According to Logan et al. (1996), the average home range is approximately 192 km2 for adult male Mountain Lions, and approximately 72 km2 for adult females. Using these figures, primary habitat could potentially support 66 adult home ranges. However, the Mountain Lion population in eastern Pima County is likely > 66. This estimated population does not account for home ranges established in secondary habitat or portions of primary and secondary habitat, overlapping home ranges, transient adults and juveniles, immigrants, emigrants, or cubs-of-the-year. Arizona Game and Fish estimates 100 Mountain Lions inhabit the study area.
Emigration statistics
Cubs leave their natal area at an average age of 13.4 months (Logan et al. 1996). In the San Andres Mountains of southcentral New Mexico, Logan et al. (1996) observed 83% of the surviving male cubs and 59% of the surviving female cubs emigrated from their natal areas. Dispersal distances averaged 101 km for male Mountain Lions, and 28 km for females. Dispersal duration (i.e., time until a home range was established) ranged from 0.2 to 1.7 months for females and 1.5 to 7.8 months for males (Logan et al. 1996).
Dispersal
Dispersing juvenile Mountain Lions can travel long distances, potentially spending over 6 months wandering the landscape. The sky island region of the Southwest is unique in that islands of Mountain Lion habitat are surrounded a sea of non-habitat (often called the landscape matrix). For this reason, dispersal is an important adaptation that contributes to the flow of genetic material. Without genetic exchange, isolated populations are at risk of inbreeding depression, and extinction due to random changes in demographic structure or environmental conditions (Simberloff et al. 1992). For genetic exchange to take place, Mountain Lions must periodically emigrate from one population and mate with an individual from another population. Landscape connectivity is therefore important in maintaining biodiversity and ecosystem function (Beier 1993 and 1995, Farhig 1985, Green 1994, Hudson 1991, MacClintock 1997, Noss 1987 and 1994, Noss et al. 1998, Rosenberg 1997, Shafer 1997, and Simberloff et al. 1992).
Many ecologists have proposed the idea of biological corridors (Noss 1987 and 1994, Simberloff 1992, Beier 1995, and Rosenberg 1997). However rather than limiting connectivity to a specific corridor, a better approach is to treat the entire landscape matrix as the region potentially capable of supporting the community (Simberloff et al. 1992). In unaltered landscapes, only natural barriers (e.g., rivers, mountain ranges, and lack of resources) limit animal movements. These landscapes represent conditions of maximum permeability. Landscapes altered by anthropogenic changes diminish landscape permeability (Godron and Forman 1983 in Noss 1987).
Beier (1995) investigated juvenile dispersal in the Santa Ana Mountains of southern California. He observed that most movement took place at night, and that dispersers avoided artificial light, open terrain (especially areas that were lit), and areas of > 8 residences per acre. Additionally, he observed Mountain Lions crossed under highway bridges, and followed stream channels, ridgeline routes, and dirt roads and trials.
Human land uses (e.g., agricultural, residential, and commercial) often dominate the landscape matrix. When Mountain Lions encounter unfamiliar environments, they may use areas that resemble the characteristics of residential habitat (i.e., areas of similar vegetation density, structure, or canopy cover, or areas with a similar composition of prey species). Due to the stresses of dispersal, potential lack of resources, and other agents of mortality (e.g., automobiles, hunting, depredation, and disease), many dispersing Mountain Lions die before they establish a home range.
Automobile induced mortality is of particular concern. The Southeastern Region of Arizona Game & Fish (Region 5) reports 13 Mountain Lions killed by motorists since 1993; 7 of these deaths were within the study area. Beier (1995) observed 7 of 9 dispersing Mountain Lions died before establishing a home range. Three deaths were due to collisions with automobiles, while 2 other dispersers survived automobile collisions.
Cost surface
My goal was to identify lands of high biological value for Mountain Lions within eastern Pima County. Additionally, I wanted to identify where the character of the landscape matrix could support connectivity among patches of Mountain Lion habitat. To do this I created a cost surface that describes the potential for connectivity.
Areas of least cost correspond to areas of least human impacts. These areas represent lands of the highest biological resource value. Additionally, these areas represent lands with high potential as biological linkages. Areas of greatest cost correspond to areas of greatest human impacts. These areas represent lands of the lowest biological resource value.
The final map in the analysis displays
primary (dark yellow) and secondary (light yellow) Mountain Lion habitat
and the cost surface. Areas of dark blue correspond to areas of greatest
human impacts, and areas of light blue to areas of least human impacts. 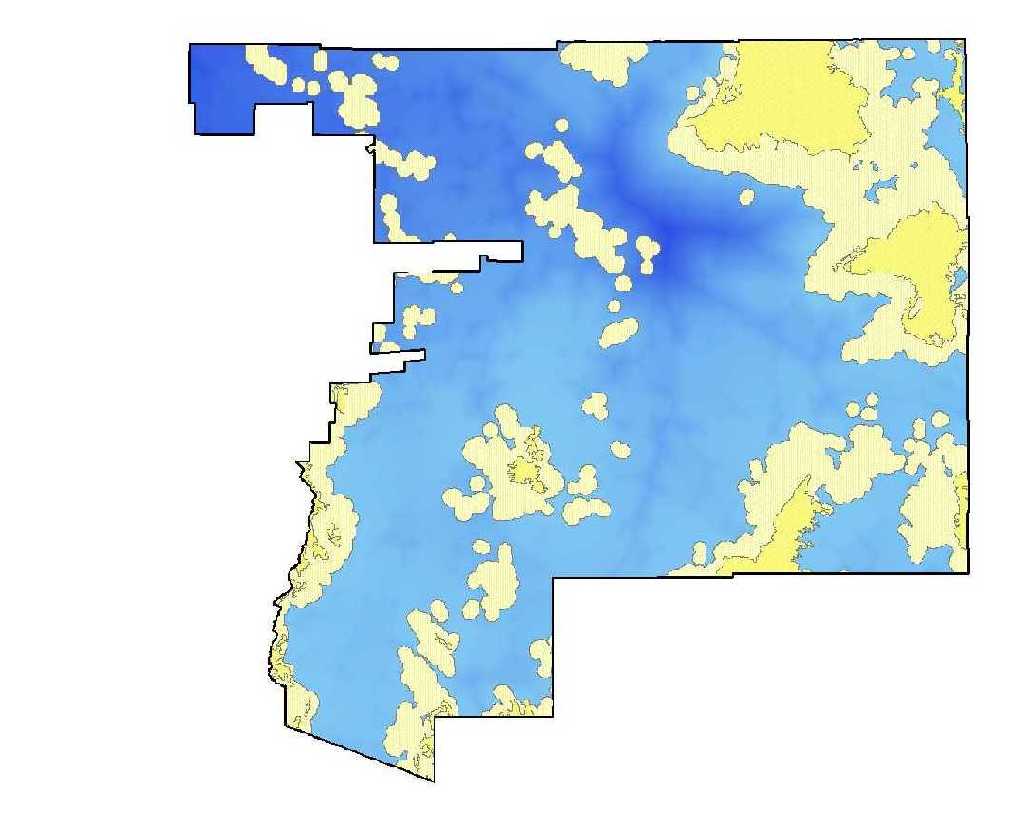
Mountain Lions generally reside in areas least dominated by anthropogenic change. Eighty-six percent of primary Mountain Lion habitat lies on Coronado National Forest lands (71%), and national park and monument lands (15%). National forest lands are managed under a multiple use mandate. This means Forest lands support a variety of uses including, recreation, logging, and mining. On a site-specific level, these land uses are not always compatible with protecting wildlife habitat. However, the US Forest Service is under a legal mandate to manage the forest so that wildlife resources persist. National parks and monuments also suffer from incompatible management objectives. However, maintenance of natural process is a management priority of the National Park Service.
Areas of secondary habitat provide a different ownership mix. Eighty-four percent of secondary habitat lies on state (34%), Coronado National Forest (27%), and private lands (23%). Only Forest Service lands are specifically under a legal mandate to consider wildlife resources as a management objective. The remaining 50% of secondary habitat lies on lands where owners are under no legal mandate to consider wildlife resources as they make land use decisions.
Observationally, Mountain Lion habitat
is highly correlated with mountainous topography. Areas with slopes >25%
should be considered for inclusion in a reserve system. Additionally, a
more in-depth look reveals other important habitat cues. Oak woodland (Encinal)
comprises the majority (67%) of primary habitat. While grasslands (Boutelua
spp.) interspersed with Yucca elata and mesquite (Prosopis
spp.) comprise the majority (73%) of secondary habitat. Landcover types
clue us into elevation and aspect, in addition to slope, as important characteristics.
Additionally, 19% of secondary habitat occupies areas of Sonoran desertscrub.
Paloverde (Parkinsonia spp.) and mixed cacti are the dominant vegetation
in this vegetation series.
Conclusion
Most, if not all, Mountain Lion habitat in a substantially natural state should factor prominently in a reserve system. These lands provide the best opportunity for continued persistence of Mountain Lions within the study area. Owners of approximately 70% of the land in eastern Pima County (i.e., state, private, and Native American landowners) are under no legal obligation to manage their land for conservation purposes. Therefore, a concerted effort must take place to ensure a reserve system that provides the resources for each focal species over a range of spatial and temporal scales.
Furthermore, connectivity among components
of a reserve system is crucial. Major roads systems and interstate highways
currently isolate components of a would-be reserve system. Future development,
especially at the urban fringe, will further erode any potential for biological
connectivity. Managers and planners will need to actively pursue measures
that enhance and maintain connectivity in perpetuity.
Acknowledgements
I want to thank The University of Arizona,
specifically the Department of Ecology and Evolutionary Biology and the
School of Renewable Natural Resources, and Tucson Audubon Society for the
opportunity to participate in the Conservation Intern program. I also want
to thank A. Holdsworth, K. Dahl, and the Coalition for the Sonoran Desert
Protection Plan for their guidance. Thanks also to C. Wissler for his technical
advice. I obtained the Mountain Lion image from the following URL: http://www.mcn.net/~monfont/mountainlions.html.
|
|
|
|
|
|
|
|
|
|
|
|
|
|
|
|
|
|
|
|
|
|
|
|
|
|
|
|
|
|
|
|
|
|
|
|
|
|
|
|
|
|
|
|
|
(persons/mi2) |
|
|
|
|
|
|
|
|
|
|
|
|
|
|
|
|
|
|
|
|
|
|
|
(Marana and Pima County) |
|
|
|
|
|
|
|
|
|
|
|
|
|
|
|
|
|
|
|
(km/km2) |
|
|
|
|
|
|
|
|
|
|
|
|
|
|
|
|
|
|
Biome(series) |
|
|
| Madrean evergreen forest (encinal) |
|
|
| Madrean evergreen
forest
(oak-pine) |
|
|
| Madrean evergreen forest (manzanita) |
|
|
| Mogollon Chaparral Scrubland (mixed evergreen sclerophyll) |
|
|
| Scrub grassland
(mixed grass - scrub) |
|
|
| Chihuahuan desertscrub (creosotebush - tarbush) |
|
|
| Chihuahuan desertscrub (mixed scrub) |
|
|
| Sonoran desertscrub (creosotebush - bursage) |
|
|
| Sonoran desertscrub
(paloverde - mixed cacti) |
|
|
| Agriculture |
|
|
| Urban |
|
|
| Water |
|
|
| Mogollon deciduous
swampforest
(mixed broadleaf) |
|
|
| Mogollon deciduous
swampforest
(cottonwood - willow) |
|
|
| Sonoran riparian
and oasis forest
(cottonwood - willow) |
|
|
| Sonoran desertscrub (creosotebush - bursage) |
|
|
| Sonoran deciduous
swamp and riparian scrub
(mixed scrub) |
|
|
| Unclassified |
|
|
| Madrean montane conifer forest (douglas-fir - mixed conifer) |
|
|
| Madrean montane
conifer forest
(pine) |
|
|
|
|
|
|
| BLM |
|
|
| Indian lands |
|
|
| Military reservation |
|
|
| National forest lands |
|
|
| National parks and monuments |
|
|
| National wildlife refuge |
|
|
| Non-federal parks |
|
|
| Other |
|
|
| Private lands |
|
|
| State lands |
|
|
Literature Cited
Beier, P. 1995. Dispersal of juvenile cougars in fragmented habitat. Journal of Wildlife Management, 59(2): 228-237.
Beier, P. 1998. Personal communication. January 20, 1998.
Fahrig, L. and G. Merriam. 1985. Habitat patch connectivity and population survival. Ecology, 66(6): 1762-1768.
Green, D. G. 1994. Connectivity and complexity in landscapes and ecosystems. Pacific Conservation Biology, In press.
Halvorson, W. L., M. R. Kunzmann, and P. S. Bennett. 1998. Arizona GAP Assessment. USGS, National Biological Service. Final Report. In press.
Hudson, W. E. 1991. Landscape Linkages and Biodiversity. Island Press. Washington D. C.
Logan, K. A., L. L. Sweanor, T. K. Ruth, and M. G. Hornocker. 1996. Cougars of the San Andres Mountains, New Mexico. New Mexico Department of Game & Fish. Final Report. W-128-R.
MacClintock, L., R. F. Whitcomb, and B. L. Whitcomb. 1977. Evidence for the value of corridors and minimization of isolation in preservation of biotic diversity. American Birds, 31(1): 6-12.
McGarigal, K. and B. J. Marks. 1995. FRAGSTATS: Spatial pattern analysis program for quantifying landscape structure. USDA Forest Service. General Technical Report. PNW-GTR-351.
Noss, R., P. Beier, and W. Shaw. 1998. Evaluation of the Coal Canyon biological corridor. Oregon State University.
Noss, R. F. 1987. Corridors in real landscapes: a reply to Simberloff and Cox. Conservation Biology, 1(2): 159-164.
Noss, R. F. and A. Y. Cooperrider. 1994. Saving Nature's Legacy. Island Press. Washington, DC.
Rosenberg, D. K., B. R. Noon, and E. C. Meslow. 1997. Ecological role of linear conservation areas for maintaining biological diversity. In press.
Shafer, C. L. Terrestrial nature reserve design at the urban/rural interface. Schwartz, M. W. 1997. Conservation in Highly Fragmented Landscapes. Chapman & Hall. New York.
Simberloff, D., J. A. Farr, J. Cox, and
D. W. Mehlman. 1992. Movement corridors: conservation bargains or poor
investments? Conservation Biology, 6(4): 493-504.
John Mangiameli
USGS/CPSU
Biological Sciences East, Rm. 125
The University of Arizona
Tucson, AZ 85721
Phone: (520) 621-1174
Fax: (520) 670-5001
Email: jmangi@ag.arizona.edu
For direct correspondence:
John Mangiameli
PO Box 103403
Anchorage, AK 99510
Phone: (907) 248-0050
Email: jmangi@ag.arizona.edu