Network Analysis for variable traffic speed
Authors
Soottipong Winyoopradist
Songkorn Siangsuebchart
Abstract
The network analysis module analyses network of roads which store information of traveling speed in different hours. The travelling speed pattern for many roads in each direction are varied such as slow in morning, average in noon and so on. Also, speed pattern of some roads is varied on weekdays and weekend. Mostly network analysis software uses only static travelling speed.
This software calculates shortest traveling time between 2 locations by specifying starting time. It demonstrates the ability of network analysis for variable traffic speed only since in general, it is difficult to collect variable traffic speed for each road.
---------------------------------------------------------------------------------------------------------------------------------------------------------------------------------------
Traffic pattern are changing according
Network Analysis Software normally address only one traffic pattern or static. For the analysis of shortest traveling time between two locations which are not far apart, it is possible to use the static traffic pattern. If two locations are far, the traffic pattern can be changed since it is taking sometime before the traveler arrives to that location. Therefore, the analysis will not reflect the true condition.
The variable traffic speed network analysis will find the routes which provide the shortest traveling time between two locations.
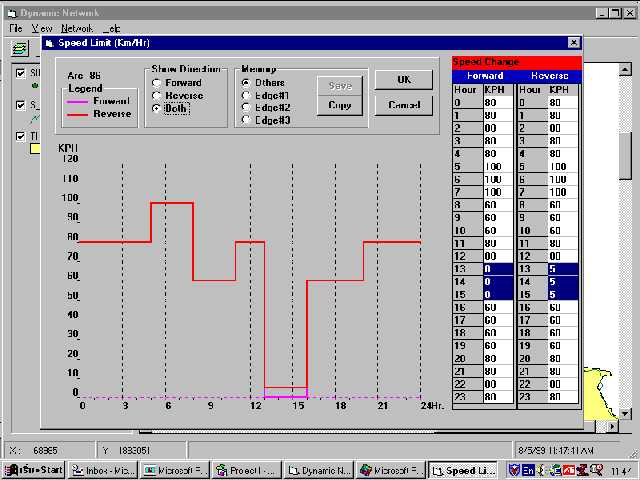
Data of each route sections will be :-

Figure 1. Traffic speed in each hours and direction.
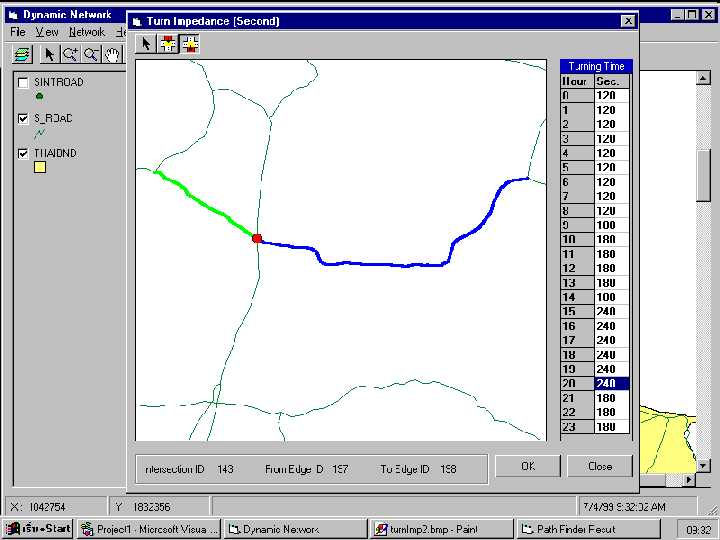
Figure 2. Turntables waiting times.
Only few intersections in major road will have the significant waiting time. In general, longest waiting time is always occur at peak traffic hour, the afternoon of Sunday for inbound traffic, and the morning of Saturday for outbound traffic.
Calculating the shortest path is by using the Dijkstra’s Algorithm .
Weight of each line is shown in every hour for each direction.
The program will calculate the travelling time in each section by
Output is shown in the MapObjects.
The examples are illustrated below.
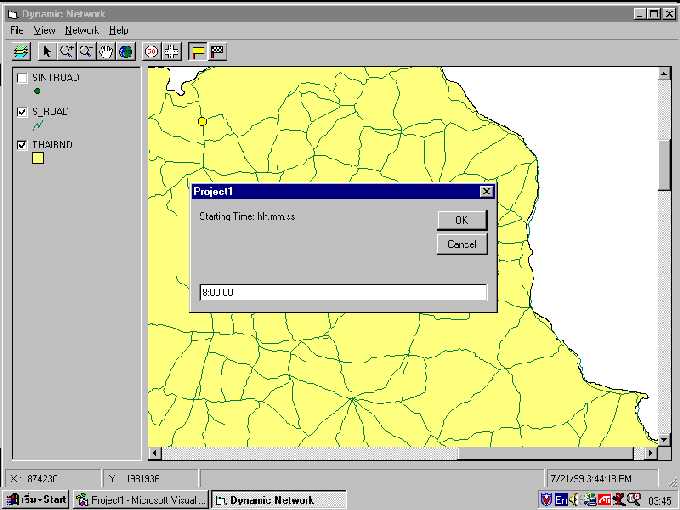
Figure 3. Select origin node and analyze network with starting time of 8.00
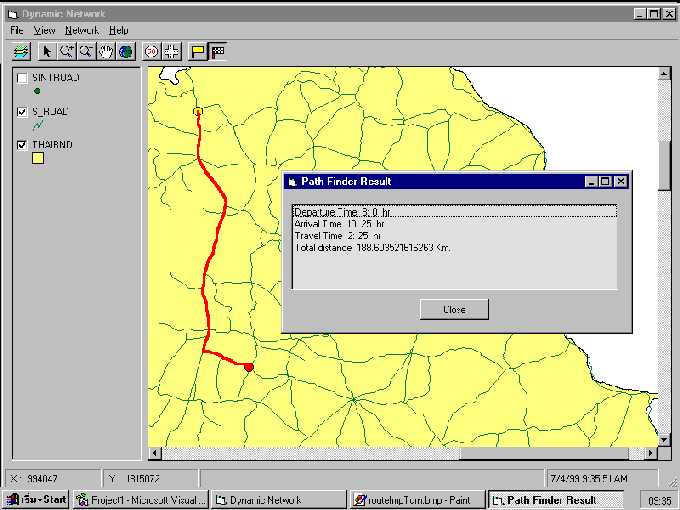
Figure 4. Select destination node and analyze the shortest traveling time path
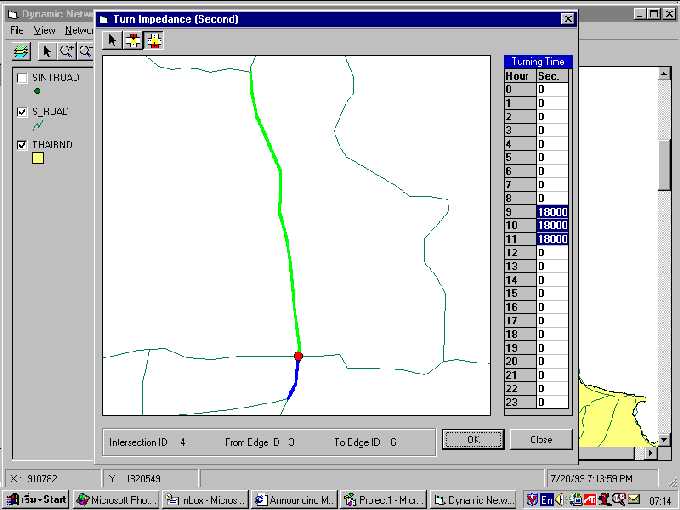
Figure 5. Change Turn Impedance of one intersection in the route
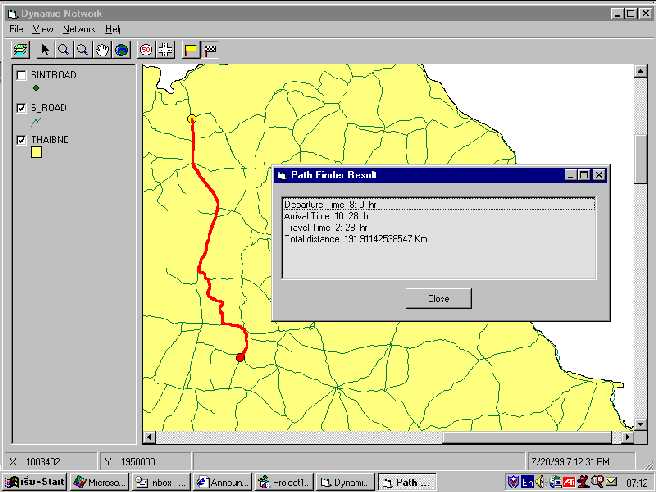
Figure 6. Route result of changed turn impedance
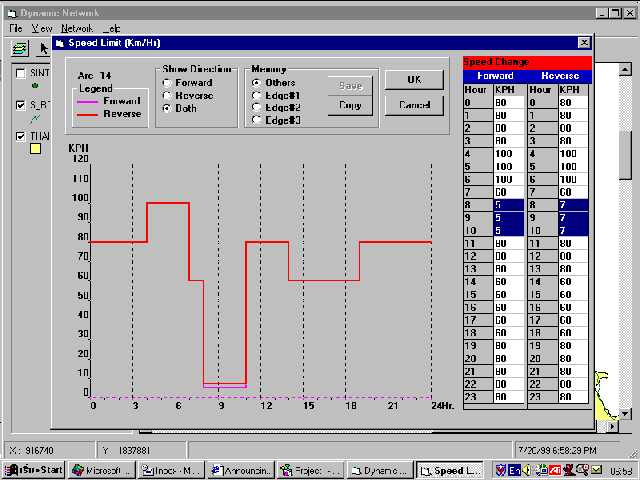
Figure 7. Change traffic speed of one link in the route
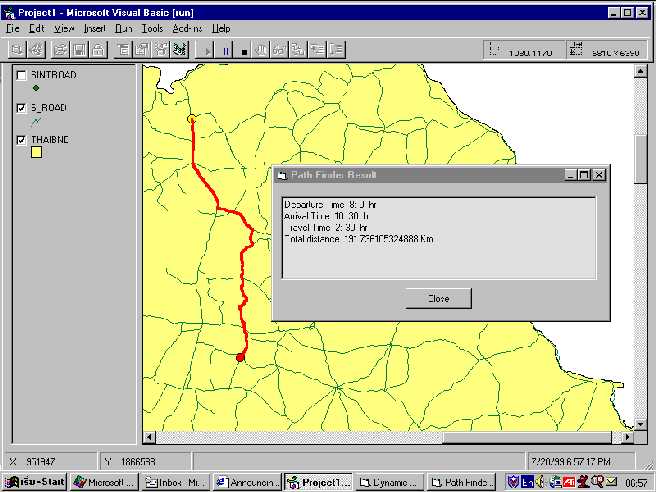
Figure 8. Route result of changed traffic speed
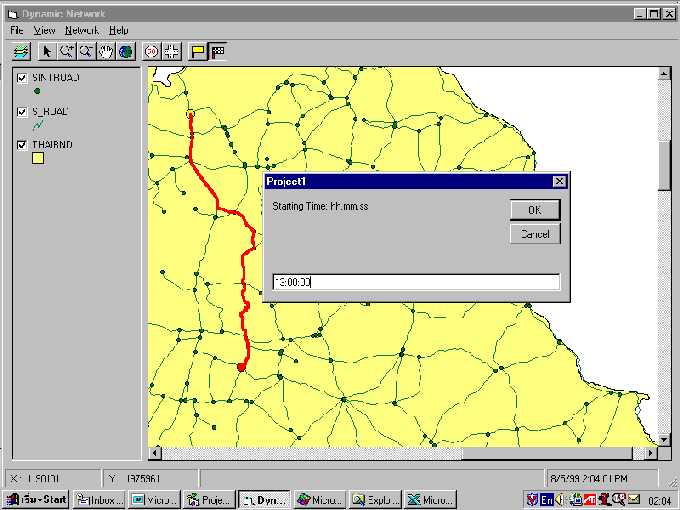
Figure 9. Analyze new start time (13:00 ) from the same origin
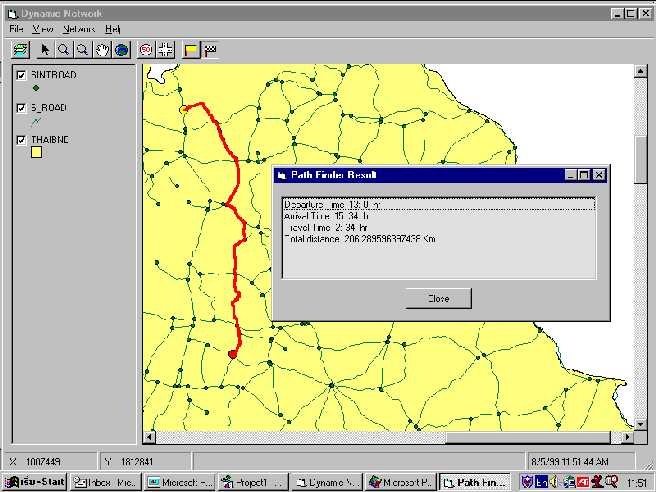
Figure 10. Route result of changed start time
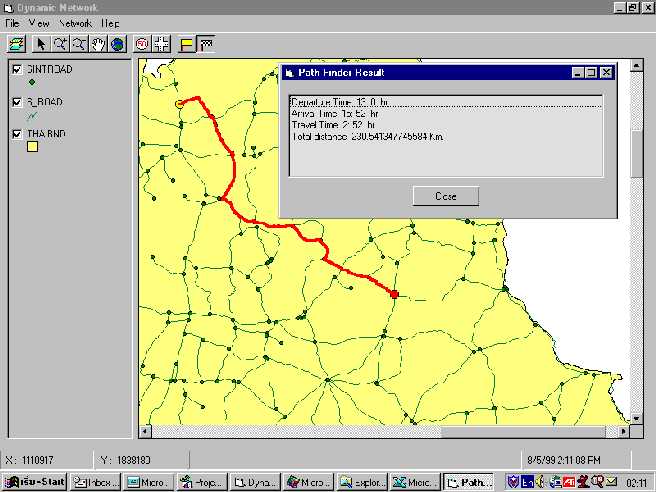
Figure 11. Another destination and route result from the origin at 13:00
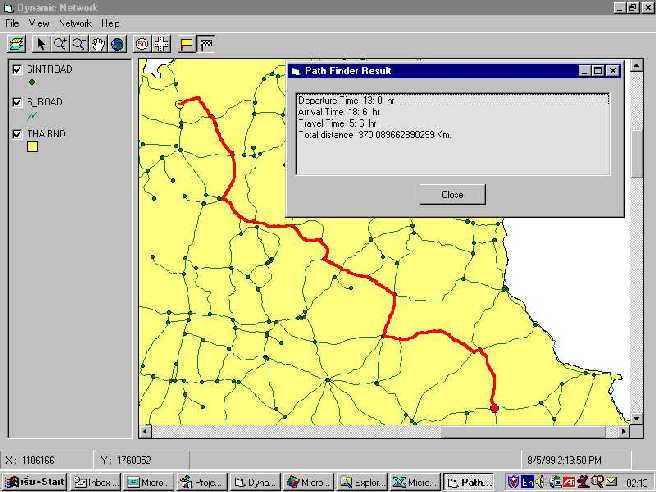
Figure 12. Another destination and route result from the same origin at 13:00
Conclusion & Recommendation
Reference
Author Information
Soottipong Winyoopradist
Assistant Professor
Department of Survey Engineering
Chulalongkorn University , Bangkok, Thailand
Email:
soottipong@homemail.comSongkorn Siangsuebchart
Application Section Manager
Esri (Thailand) CO.,LTD. , Bangkok, Thailand
Email: songkorn.s@cdg.co.th