
Figure 1. Basic GPS Equipment Example
(Source: Trimble's home page at http://www.trimble.com/gis/index.htm
GPS Applications in Wastewater Management
This paper presents applications of Global Positioning System (GPS) in wastewater management. It is demonstrated that a Geographic Information System (GIS) and GPS based infrastructure management approach is needed to make informed wastewater system improvement decisions. Use of GPS in collecting attributes data is discussed and methods of data attribution are described. The paper presents methods on integrating GIS and GPS data, review of GPS equipment and software, and GPS accuracy issues. The paper also shows how a GIS software can be customized using scripts to enter attributes data.
TABLE OF CONTENTS
Infrastructure is a Latin word meaning "the structure underneath." The water, stormwater, and wastewater infrastructure is aging fast throughout the world. American Society of Civil Engineers (ASCE) projects $1.3 trillion in infrastructure needs in USA over the next five years alone, of which approximately one third is needed for water and wastewater improvements. Unfortunately, adequate federal funds are not available for the massive fix. This problem can be partially blamed on the "out of sight - out of mind" mentality of the some decision makers. The lack of funding for the badly needed infrastructure improvements is making the people worried. This is being reflected in the recently conducted public opinion polls. According to a recent survey, 31% of Americans would rather swim in their toilet bowls than the nearest river. A 1998 ASCE poll showed that more than 75% of the United States voters were concerned about the quality of roads, drinking water and school buildings. In Boston, more voters were concerned about roads, bridges and drinking water than Social Security and taxes. In New York City, school buildings and drinking water concerns out scored drug abuse worries (ASCE, 1998). Many indicated that they will vote for a candidate whose election campaign addresses waste disposal (78%), drinking water (73%), and roads and bridges (62%). These surveys indicate that water-related infrastructure is particularly important because it is so closely related to public health and safety.
Municipal wastewater collection systems comprise of separate storm sewers, separate sanitary sewers, and combined sewers that carry both the stormwater and the sanitary sewage. Wastewater systems are an important part of the water related infrastructure. Over the past two decades, local, regional, and national-scale research programs have shown that pollutants discharged from municipal separate storm systems are among the principal causes of water quality problems in most urban areas (Murillo, et. al, 1996). Improper stormwater systems can impact the operation of both the drinking water and wastewater systems. Drinking water can be impaired due to pollution of surface water supply sources from polluted stormwater outfall discharges. Wastewater collection and treatment can be impacted by unwanted inflow of stormwater into the sanitary sewer systems.
One of the biggest challenge of the rapid urban growth is managing information about maintenance of existing infrastructure and construction of new infrastructure. Many utilities tackle the infrastructure problems on a react-to-crisis basis which may not be the best strategy despite its conventional wisdom. Making informed infrastructure improvement decisions requires a large amount of diverse information on a continuing basis. If information is the key to solve the infrastructure problems, the first step of any infrastructure improvement project should be development of an information system. An information system is a framework by which to ask questions and obtain answers from a data resource. More than 80 percent of all the information used by utilities is geographically referenced, that is, a key element of the information is its location relative to geographic features, other objects, established boundaries, etc. A Geographic Information System (GIS) is a special type of information system in which the database consists of observations on spatially distributed features and procedures to collect, store, retrieve, analyze, and display such geographic data. GIS links map features with database attributes. The integration of digital mapping and database capabilities is what sets GIS apart from other information systems. In the past decade, powerful personal computers and sophisticated software have combined to bring the GIS capability to any desktop.
The Global Positioning System (GPS) technology offers a promising solution to placing current data on maps. A GPS represents a space-age revolution in GIS data collection. GPS systems utilize a constellation of satellites orbiting the earth twice daily transmitting precise time and position signals. GPS receivers read signals from orbiting satellites to calculate the exact spot of the receiver on earth. The new line of GPS receivers brings technology to wastewater system operators and managers who can populate maps with precise location of features such as manhole covers, catch basins, overflow points, valves, pumps, flowmeters, and rain gages.
The GPS/GIS applications that are of particular importance to wastewater system managers are: Mapping, Monitoring, Modeling, and Maintenance. These four Ms define the four most important activities which can be conducted efficiently using GIS/GPS systems. GPS provides the following applications for wastewater management:
GPS can collect both the location (coordinates) and the attributes data.
A sewer system GIS database consists of graphic features and labels, with
links or pointers (usually facility identification numbers (IDs)) to related
attribute or tabular data. The features are usually organized into a series
of vector layers consisting of points, lines, or polygons that are registered
to geographic control framework and a set of base information called a
base map. Table 1 shows typical wastewater system features and how they
are modeled in GIS.
|
|
|
|
| Gravity sewer | Manhole | Flow monitor |
| Force main | Pumping station | Sampling location |
| Siphon | Lift station | Cleanout |
| Tunnel | Treatment plant | Vault |
| Casing | Wet well | Tunnel door |
| Service Lateral | Outfall | Tunnel shaft |
| Reuse main | Diversion chamber | Tunnel vent |
| Reuse Service | CSO | Valve |
| . | Valve | . |
| . | Pipe fittings | . |
| . | Cleanout | . |
Typical wastewater system assets (components) are listed below:
The conversion process for wastewater system utilities begins with GPS data. Features such as manholes and lampholes are collected using a GPS unit. These point features are combined into one GIS (e.g., ARC/INFOÒ ) dataset and then attributed. Wastewater system component attributes can be collected in two phases (or passes):
Limited attributes can be collected by the GPS survey crew when a structure is visited or surveyed for the first time. These attributes should be visible from outside and should not require confined space entry or opening of structures. Examples of such attributes are manhole cover type, catchbasin condition (clean, debris, etc.), and outfall condition (submerged, flowing, dry, etc.). This phase may also include ID marking of structures for the future visits. In this phase, up to 200-300 points can be surveyed per day.
Additional attributes can be collected when a structure is revisited by the attribute crew. These attributes may require field measurements, detailed inspections, confined space entry or opening of structures. Examples of such attributes are manhole depth, pipe size, or structural/hydraulic deficiencies, etc. Final attributes depend on the mapping application. For example, if the GIS will be used to develop a hydraulic model, then the weir height in a CSO diversion chamber may be important; or if the GIS will be used for NPDES permit reporting, then the condition of the sanitary outlet (clean, clogged, surcharged, etc.) in a CSO diversion chamber may be a critical attribute. In this phase, final attributes for 50-75 structures can be surveyed per day. New real time differential GPS receivers can be used to navigate the attributes crew back to the structures visited in Phase 1.
GPS precision varies from millimeters to 100 meters. Required precision depends on the project specific requirements. Available GPS precision varies with GPS mode (static, real time kinematic (RTK), or kinematic), GPS equipment, time of occupation, and location (vegetation, reflection, buildings). GPS survey cost increases with the accuracy. Typical utility precision standard is 3-5 cm. For GIS-based mapping, mapping grade GPS equipment equipped with code-based receivers is needed. For detailed and highly accurate surveying, survey grade GPS equipment equipped with carrier phase receivers is needed. GPS equipment can be classified into three categories:
These light weight and hand-held systems are about the size of a calculator. They are less expensive ($3,000 to $4,000) and less accurate (2 to 5 meters, worst in woods). Differential corrections are applied in a post-processing step after the collected field data has been downloaded to a computer running a GPS processing software package. Because of their low accuracy, they are not suitable for wastewater system GPS surveying. They are more suitable for educational use. Trimble's Geoexplorer IIä hand-held GIS data collection system shown in Figure 1 is an example of this category. Geoexplorer II provides ARC/INFOÒ , AutoCADÒ , IntergraphÒ , MGEÒ , ERDASÒ and GRASSÒ support. GIS export is provided using Trimble's Pathfinder Officeä software. The steps for using Geoexplorer II GPS data in GIS are given below:
Figure 1. Basic GPS Equipment Example
(Source: Trimble's home page at http://www.trimble.com/gis/index.htm
A simple data dictionary for Phase 1 GPS survey is given below:
These systems are more expensive ($10,000) but provide sub-meter accuracy required for wastewater systems. Differential corrections are applied in real time if the GPS receiver is linked to a radio receiver designed to receive broadcast corrections. This features is critical for accurate navigation. Trimble's GPS Pathfinderä Pro Xr/XRS GIS data collection system shown in Figure 2 is an example of this category. In Pathfinder, attributes can be entered using Trimble's hand-held Asset Surveyor, or a pen-based notebook running Trimble's ASPENä software. Like Geoexplorer, GIS export is accomplished using Pathfinder Office software. They have an integrated differential correction receiver and can provide real-time sub-meter accuracy. Pathfinder also features patented Everestä multipath rejection technology to remove multipath signals in reflective environments.
Figure 2. Advanced GPS Equipment Example
(Source: Trimble's home page at http://www.trimble.com/gis/index.htm
Survey grade equipment feature real-time kinematic (RTK) technology which can deliver ± 1 cm accuracy in real time using dual frequency receivers. Due to their high accuracy, they are expensive ($50,000). Trimble's GPS Total StationÒ 4800 integrated real-time kinematic survey system shown in Figure 3 is an example of this category. Due to their more than needed accuracy and high cost, they are not suitable for wastewater system mapping applications.
Figure 3. Survey Grade GPS Equipment Eaxmple
(Source: Trimble's home page at http://www.trimble.com/gis/index.htm
In addition to using GPS, many valuable attributes can be captured from the as-built drwaings, if available. This can be facilitatted by automating the attribute entry process. For example, using an ARC/INFO Arcedit session for attribute data entry, Arc Macro Language (AML) routines can be executed to enter the attributes in user-friendly dialog boxes rather than at the command prompt. Rather than selecting and typing in the attributes of each point and line, the AML uses pop-up menus to prompt the user to enter the correct data. The use of AMLs automates the entire process, thereby increasing the speed, efficiency and accuracy of the conversion. The AMLs can be modified to fulfill each individual project's requirements. This approach reduces data errors and can even be used to validate the input data.
The data for points and the corresponding lines are generally derived from construction and as-built drawings. Each drawing is assigned a number, called the Source ID. Each point and line that is attributed from a source document carries the Source ID as well. This allows the user to identify the drawing from which attributes are derived. Figure 4 shows an AML form developed by Chester Engineers to create and modify (edit) point and line features. Figures 5 and 6 show the forms for adding point and line features, respectively.
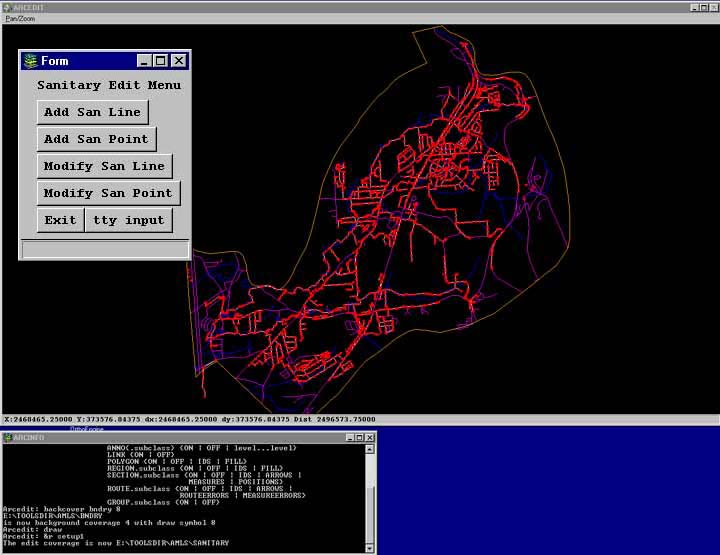
Figure 4. Chester Engineers' AML Form for Attribute Entry
Each individual point is selected and attributed. As shown in Figure 5, the menu for the point selected allows the invert elevation, Source ID, and other field (which alerts the user to missing attribute data ) to be entered. After the necessary data is entered, the user clicks on "okay" and the attributes are saved for that feature. If a point is missing from the dataset (not field collected), that feature can be added using distances from the source document. After attributes are added, the point is displayed with a specific symbol indicating the condition of the attributes. For example, points which are completely defined can be displayed using a white box. Points which are missing attributes can be displayed as a box with an X through it. Manholes that are added from source can be shown as green boxes with an X through it. This coding allows the user to quickly identify the points that are not completely defined. Several important attributes which ensure quality control of this process are:
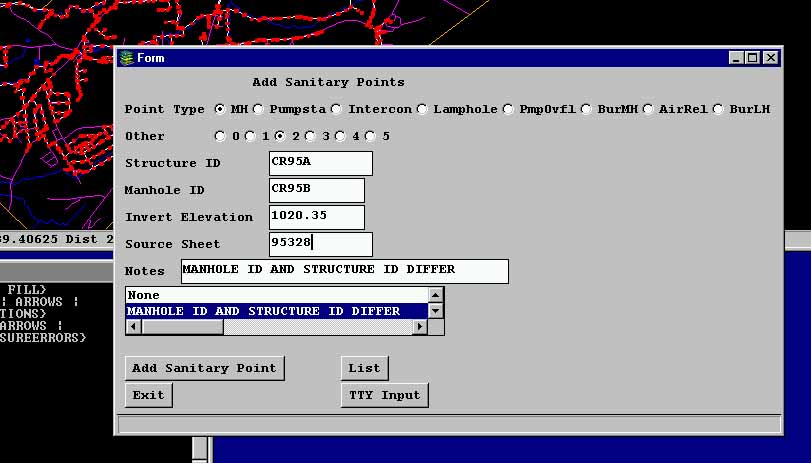
Figure 5. AML Form for Entering Manhole Attributes
After the points are attributed, the connecting lines are added. Again, the attributes for each line are added in a menu environment. As shown in Figure 6, the pipe sizes, material, end invert elevation, beginning invert elevation, slope and Source ID are added. The note field allows special information to be added (such as "concrete lined") for which a field does not exist.
After the necessary data is entered, the line is added. A type field is added, with 1=main line, 2=wye, 3=force main and 4=stub. When the dataset is displayed, each different type is coded a different color. This allows coding errors to be detected easily and thereby corrected early in the conversion process.
The lines are added from point to point. The AML prompts the user to select the upstream manhole and then the downstream manhole. After both are selected, the arc is added to the dataset. By selecting upstream and downstream manholes to add the arcs, the flow direction of a gravity sewer is incorporated into the dataset, ensuring the proper connectivity of the system. Additionally, the lines are snapped to the point features, ensuring that the points of connection correspond to manholes.
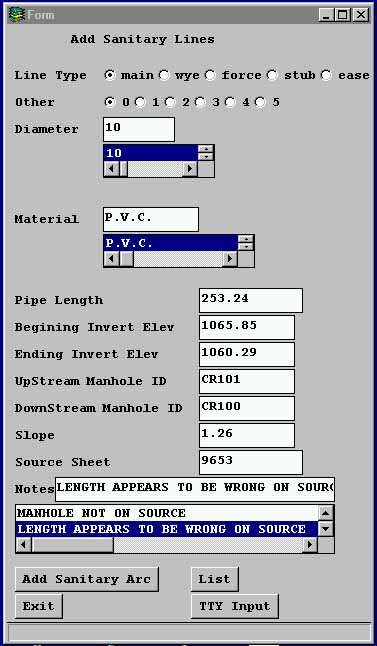
Figure 6. AML Form for Entering Sewer Pipe Attributes
At the conclusion of each day, the dataset is massaged to ensure the stability of the dataset (including calculating the IDs and building the dataset). The dataset is then exported and saved as a backup file. After the process is completed for an entire area, check plots are created. These check plots show the lines and points along with their attributes. The flow direction of the lines are also displayed to ensure that proper connectivity has been established for the system. The plots are then delivered to the municipal engineer for his review.
ARC/INFO (7.x) database is proprietary and cannot be accessed outside the GIS by other applications such as hydraulic modeling or work order management software packages. This problem can be resolved if only a minimum number of attributes (mostly links to external tables) are stored in GIS and the rest of attribute data are stored in an an open RDBMS (ORACLE, MS ACCESS, etc.) which can be accesssed by third party application software.
A differential GPS (DGPS) which can provide real-time sub-meter accuracy is suitable for mapping a wastewater system. Wastewater feature attributes can be captured from as-built drawings using AML scripts and from a GPS survey using pen based field computers or GPS data collectors. It is recommended that attributes data be stored in an "open" database system which can be accessed by other applications (modeling, work management, etc.).
We would like to thank Rachel Jones for providing information that has been used to prepare the data attribution section of this paper.
Uzair M. Shamsi, Ph.D., P.E.
Senior Technical Manager
U.S. Filter / Chester Engineers , 600 Clubhouse Drive, Pittsburgh,
PA 15018, USA
Phone: 412-269-5907 , Fax: 412-269-5865
E-mail: shamsiu@usfilter.com
Web Site: http://www.pitt.edu/~ushamsi/ushamsi.html