Protected Areas GIS: Bringing GIS to the Desktops of the National Estuarine Research Reserves and Marine Sanctuaries
The Protected Areas Geographic Information System (PAGIS) is a National Oceanic and Atmospheric Administration (NOAA) National Ocean Service (NOS) project designed to assist National Estuarine Research Reserve and National Marine Sanctuary managers. NOS is providing each Reserve and Sanctuary with a fully integrated geographic information systems (GIS) and Internet capability. NOS is compiling key GIS data layers for each protected area (e.g., bathymetry, hydrography, transportation) and providing technical assistance and training in ArcView® and Spatial Analyst® to Reserve and Sanctuary staff. NOS also will be customizing ArcView® to address specific coastal management issues, as well as creating a MapObjects® Internet GIS mapping application to help support and illustrate common research agendas among the Sanctuaries and Reserves.
 The Protected Areas Geographic Information System (PAGIS) project is a three-year initiative to develop a fully integrated geographic information system (GIS) within the National Estuarine Research Reserves and the National Marine Sanctuaries. The Reserves and Sanctuaries are pristine areas dedicated to education and research of the nation's coastal and estuary habitat. The National Oceanic and Atmospheric Administration (NOAA) Coastal Services Center is taking the lead technical role, in conjunction with NOAA's Office of Ocean and Coastal Resource Management and Special Projects Office, in creating a nationwide GIS network among these protected areas.
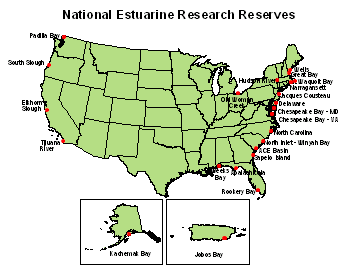
The National Estuarine Research Reserve system is comprised of 23 individual sites throughout the U.S. and Puerto Rico. The Reserve system was created with the 1972 passage of the Coastal Zone Management Act. The Reserves are estuarine and coastal areas that focus on long-term monitoring of the local estuaries, and provide education and research opportunities on the local estuarine and coastal habitats. The Reserves are involved with many different projects ranging from studies on the natural and human-induced change in the ecology of estuarine ecosystems, to establishing local networks of continuous water quality monitoring stations. They also have developed a nationwide database on baseline environmental conditions for the Reserve system.
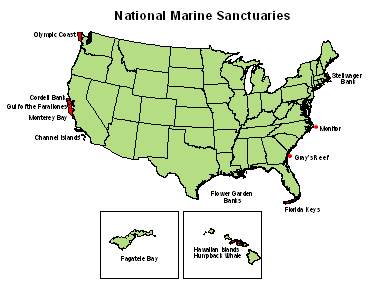
The National Marine Sanctuaries are comprised of 12 marine areas under the umbrella of NOAA. The Sanctuaries serve as stewards of the nation's marine protected areas by helping to provide resource protection through conservation and management practices. They also help to support scientific research and monitoring of the local marine resources. One Sanctuary may concentrate on protecting the breeding ground of humpback whales, while another may house the remains of historical shipwrecks.
With 23 Reserves and 12 Sanctuaries participating in the PAGIS project, there was a great assortment of GIS knowledge and experience among the managers. The main goal of the project was to build a basic level of GIS capability at each of these protected areas. In order to accomplish this goal, six different steps were developed. They included purchasing GIS hardware and software; providing GIS and metadata training; developing spatial data layers; creating and maintaining an Internet home page; creating custom GIS applications; and providing technical support to all the protected areas.
The first step in bringing GIS to the Reserves and Sanctuaries was purchasing a fully-equipped computer with Internet capabilities. The system included the best hardware available, such as a Gateway® or Micron® Desktop PC; a backup tape drive; an Iomega® Zip drive; and an EPSON® 11" x 17" color printer. Environmental System Research Institute (Esri)® GIS software ArcView®, Spatial Analyst®, and ArcPress®, also were provided. In addition to the individual sites, the Estuarine and Sanctuary division headquarters were supplied with the same GIS hardware and software package. Providing GIS at the headquarters level allowed for a more system-wide view of the protected areas.
PAGIS staff wanted to make sure the newly delivered software and equipment was fully utilized. Therefore, Esri certified instructors at the Coastal Services Center trained at least one person from every Reserve and Sanctuary in basic and advanced ArcView. The Center also provided Federal Geographic Data Committee compliant metadata training to give the Reserves and Sanctuaries the fundamental knowledge of how to document their data. To date, the PAGIS project has provided ArcView training to 36 Reserve, eight division, and four Sanctuary staff.
In addition to the fundamental GIS software and hardware, global positioning system (GPS) units also were purchased for some Reserves. Using GPS to create spatial data layers has become increasingly more common. PAGIS staff have helped to bring GPS technology to the Reserves by developing a customized training manual that details how to collect, process, and integrate GPS data with a GIS. PAGIS staff also have been conducting site visits to provide more hands-on training with the units.
Once the Reserve and Sanctuary staff people were trained, the project switched its focus to data development. At the beginning of the project, PAGIS staff determined that there were 10 fundamental spatial data layers needed to start a spatial database. Those layers included hydrography, transportation, watersheds, wetlands, landuse, digital boundaries, bathymetry, etc. Because of their partnerships with state agencies, most Reserves had a good data source for these layers. If they did not, PAGIS staff helped to compile and distribute the datasets to the individual Reserves.
Other base data layers such as an accurate digital boundary, however, were not so easy to find. It was quickly realized that six of the 23 Reserves did not have any digital representation of their boundary and the other 17 had an outdated version. Therefore, the first spatial data layer developed was an updated and accurate digital boundary for all 23 Reserves.
The boundary creation process was an intense effort between the Center and the Reserves, and was completed in three steps. The first step involved sending each Reserve a version of their boundary to be edited or changed. The boundaries were printed on U.S. Geological Survey (USGS) 7.5 minute topographic maps and sent to the Reserves. If no version of the boundary existed, a blank USGS map was sent. The Reserves were then instructed to edit the boundary by either deleting or adding new boundary lines on the paper map. The Reserves used their existing management and research plans as sources for the edits.
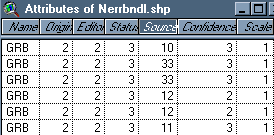
The paper maps were then sent back to the Coastal Services Center, and the PAGIS staff began the process of recording the changes. The PAGIS team wanted to make sure that the lineage of the changes to the digital boundaries could be maintained. Therefore, a system was designed to attribute each arc to reflect the changes or edits it underwent. These attributes included the name of the Reserve; the original source of the file; the editor of the file; the status of each arc, whether it is was edited or unchanged; the source of each arc (i.e., the physical ground source by which the arc was moved); the confidence of the edit; and the scale by which each arc was edited. As each arc was changed, either by on-screen digitizing or by using a digitizing tablet, it was coded with these attributes. Once the edits and changes were verified by the Reserve, the final boundary files were compiled. An example of boundary coverage, its attribute table, and the corresponding codes for the confidence attribute can be seen below.
|
Reserve Boundary
|
Boundary Attribute Table
|
Attribute Codes
|

|
|
| SOURCE CODE |
SOURCE |
| 10 |
Road |
| 11 |
River/Bay Edge |
| 12 |
Marsh |
| 15 |
Tax Boundary |
| 30 |
Section Line |
| 33 |
Railroad |
|
 In addition to the boundaries, other base spatial data layers were developed for each protected area. These layers included USGS Digital Orthophotographs (DOQ), USGS Digital Raster Graphic (DRG) files, and Digital NOAA Nautical Charts. Each of these layers, including the boundaries, were compiled and projected to fit the Reserve's projection system. The DOQ and DRG files were also compressed with MrSIDTM
compression software for faster viewing in ArcView. All four data layers were then placed on a PAGIS data CD-ROM and distributed to each Reserve.
Technical support, another component to the project, was essential in helping the Reserves and Sanctuaries utilize GIS in their daily work. The project developed four avenues of technical support; telephone and e-mail support, a GIS listserver, a PAGIS World Wide Web page, and local site visits.
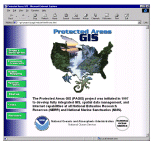 The PAGIS web page, www.csc.noaa.gov/pagis, provides many different avenues for resources. Along with a description and status of the project, it provides an interactive GIS application for viewing datasets via the Internet, an archive of submissions to the PAGIS listserver, and links to data and GIS resources.
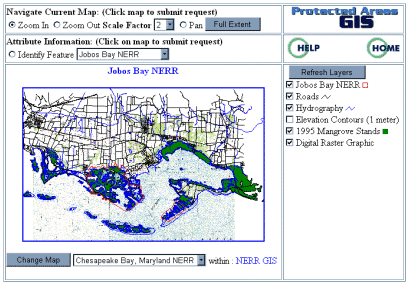
The PAGIS GIS mapping application is an Esri MapObjects® Visual Basic Internet application that allows the user to view, pan, zoom, and query different data layers for different Reserve sites. The mapping application was added to the PAGIS web page as an example of the potential of GIS on the Internet. It allows many different users to see the wealth of datasets that the Reserves use in their activities. It also can serve as a focal point on how the Reserves are doing as a system.
The PAGIS listserver, pagis@csc.noaa.gov, is a forum where GIS and/or spatial data-related questions can be asked. The listserver was created to spark conversations about problems and ideas between all the protected areas, as well as to start a support network that the Reserves and Sanctuaries can use for future GIS work.
In addition to the web and telephone support, PAGIS staff also have been traveling to various Reserve and Sanctuary sites for on-site training. An added component to PAGIS' technical support came with the joint NOAA and National Geographic Society's Sustainable Seas Expeditions. The Sustainable Seas Expeditions are an initiative to map the Sanctuary sea floors over the next five years using underwater one-man submersibles. The Center and PAGIS staff have provided GIS support in terms of data layer creation and on-site training when the Expeditions are at each Sanctuary.
The last goal of the project was to create custom GIS tools for the protected areas. The project is currently in the planning stage of this task. PAGIS hopes to work in partnership with selected Reserves to identify site-specific spatial data applications that can be implemented not only at each Reserve but also throughout the entire system.
By the end of its third year, the goal of bringing GIS to the desktops of the National Estuarine Research Reserves and Marine Sanctuaries will be accomplished. Over the past two years, the PAGIS project has purchased GIS-dedicated hardware and software; provided base spatial data layers; created a support network through the PAGIS web page and listserver; and conducted site visits to the Reserves and Sanctuaries. With the addition of customized applications, the Reserves and Sanctuaries will have a strong basis by which to expand and utilize GIS technology in their management and research programs.

Darcee Killpack
GIS Data Analyst
TPMC Contractor
NOAA Coastal Services Center
2234 South Hobson Ave.
Charleston, SC 29405
(843) 740 - 1336
(843) 740 - 1224
Darcee.Killpack@noaa.gov
 The Protected Areas Geographic Information System (PAGIS) project is a three-year initiative to develop a fully integrated geographic information system (GIS) within the National Estuarine Research Reserves and the National Marine Sanctuaries. The Reserves and Sanctuaries are pristine areas dedicated to education and research of the nation's coastal and estuary habitat. The National Oceanic and Atmospheric Administration (NOAA) Coastal Services Center is taking the lead technical role, in conjunction with NOAA's Office of Ocean and Coastal Resource Management and Special Projects Office, in creating a nationwide GIS network among these protected areas.


 In addition to the boundaries, other base spatial data layers were developed for each protected area. These layers included USGS Digital Orthophotographs (DOQ), USGS Digital Raster Graphic (DRG) files, and Digital NOAA Nautical Charts. Each of these layers, including the boundaries, were compiled and projected to fit the Reserve's projection system. The DOQ and DRG files were also compressed with MrSIDTM
compression software for faster viewing in ArcView. All four data layers were then placed on a PAGIS data CD-ROM and distributed to each Reserve.
  The PAGIS web page,
