
A PC-Based Tool for Viewing
and Mapping the Region of Paris
Michel Hénin
Fabrice Thévenon
Régis Dugué
For more than 15 years, the Region of Paris has been building a regional GIS covering different thematic fields : economy, demography, planning, environment, transportation, public buildings, etc. The Paris regional planning agency, the IAURIF, has developed a PC-based application used by a team of more than 100 professionals (engineers, architects, economists, etc.). This application provides them with very user-friendly tools for accessing the GIS in their everyday tasks. Directly from their PC, they can view and browse the data on screen (MapObjects maps) or ask for paper maps anywhere in the region (remote AML-driven ARCPLOT cartography). They can also get some explanation on the Paris regional GIS, its content (metadata for nonspecialized users), and some updated news about this GIS. Last september, this application won the application contest organized by Esri-France.
Contents
1. The régional GIS of the Parisian Region
The Parisian region is called
Ile-de-France. It covers 4 700 square miles (12 000 km2) and has a
population of eleven million.
Ile-de-France is a local authority
and therefore it deals with different fields: town planning,
transportation, environment, education, economic development, etc.
The Parisian Region’s planning
agency is called IAURIF, which stands for " Institut
d ’Aménagement et d ’Urbanisme de la
région Ile-de-France ". This could be translated as
the " Institute for Development and Town Planning in the
Ile-de-France region ".
IAURIF was originally created in
1960 in order to develop the Master Plan for the Paris region.
IAURIF has specialized in Regional
Council studies since 1983.
Almost 200 people work for IAURIF
and this multi-disciplinary team manages all the major problems
within the planning and development fields.
In order to work efficiently, we
realized that we needed to access information relating to our area of
activity. Consequently, we set up our regional GIS very early, about
15 years ago.
In general, we use the abbreviation
RGIS instead of " regional GIS ".
This GIS includes over fifty data
layers, we are particularly interesed in the following fields :
administrative boundaries, population, employment, land use,
planning, transportation, public facilities, economy, environment,
hydrography, land relief, etc.
It covers the whole region.
We exploit our regional GIS through
20 networked Unix workstations, a data server and some printing or
plotting devices. To date, we have fifteen Arc/Info and 8 ArcView licences.
We have been using Arc/Info since
1990. Since then about 20 technicians have been trained to use
Arc/info. These specialists work in the technical departments. They
support their colleagues who don’t know how to use Arc/info,
performing various exploitation tasks such as : data
integration, data updates, cartography, analyses, calculations, etc.
This system worked well for many
years, but it didn't allow the nonspecialized personnel to access the
GIS directly.
3. The goals of the RGIS Assistant
The application presented in this
paper is called the " RGIS Assistant ".
It was designed and created to
improve accessibility to the GIS, for the personnel that have no
specialized knowledge of the GIS system.
It’s a PC-based application.
Users can use it on their personal
computers, at their desks.
This application is very easy to
use and provides basic tools to access the GIS.
The users don’t need previous
knowledge about the way the GIS is organized (names of files,
directory paths, etc.).
The RGIS Assistant offers four categories of services, which are clearly displayed in the main menu of the application (we have translated most of the application windows into English to make them clearer to the reader) :

- Mapping (printing of
customized maps, in various paper sizes and on user-selected areas)
- Viewing and browsing (the
users can vizualise geographic data on screen and browse the attributes).
- Information (users can
obtain some basic information about the GIS and its content).
- Help (on line help for
using the tool).
We are going to take a look at these services, in order to see how they work and what development tools were used.
4. The mapping services of the RGIS Assistant
4.1 the mapping menu
It proposes a map request queue, maps on groups of communes (similar to municipalities), regional maps and examples of these various types of maps.
We are going to see in detail the tool offering maps on groups of communes.
4.2 Maps on a group of communes
What were the user needs ?
The users wanted a tool for
printing thematic maps of various types on user-selected areas.
They wanted a very simple
interface, allowing for self-training and for occasional use.
They wanted high-quality
cartography in various paper sizes.
They also wanted a function for
customizing page setting.
The main form of the application
When you launch the application,
this form will appear on screen, on which you will be able to build
your request.
This form allows users to call
wizards to:
- choose the maps
- choose the communes
- customize the page setting
Selecting the type of maps
This form allows for map selection :
The left-hand frame of this form
proposes a list of themes, which correspond to various categories of
thematic maps (sorry, we did not translate the themes in the frame).
The right hand frame displays the
maps related to the selected thematic entry on the left.
The check-boxes show what choices
have been made.
The number of selected maps is
written at the bottom of the form.
The left button here allows the
users to obtain a brief description of each available map and of
every constituting dataset.
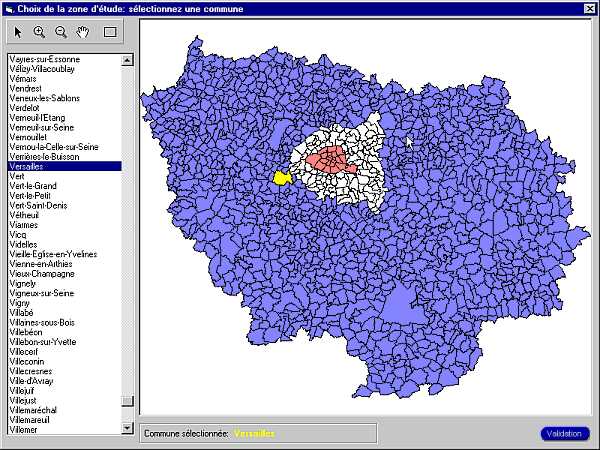
Selecting the communes
This tool displays a map showing
all the communes of the region. It enables the users to select the
communes they want in a very user-friendly way.
Customizing the page setting
The users can choose the paper
size, type in a title, set the peripheral margins and the binding
margin, if any, etc.
The scale of the map is
pre-calculated to fit the drawing frame, but users can set it by
themselves, for example to enter a round figure.
The effects of these choices are
interactively shown on a template.
Check before printing
This form shows a summary of the
request in progress.
Users can check their choices. If
necessary, they can return to the previous forms to modify the
choices that don’t suit them.
What happens then ?
It ’s very simple :
The request has been written as an
ascii file and stored in a special directory, somewhere on the network.
Somewhere else on the network,
there is an Unix workstation that scans the directory every minute to
see if a map request file has arrived.
If a map request file is copied
into the directory, the workstation starts up Arc/Info and launches
an aml program which moves the request file to a working directory on
the station and opens it.
The aml reads the request and calls
the specialized ArcPlot aml corresponding to the maps that are needed.
When ready, the graphic files are
sent to the printer or to the plotter, depending on the size of the maps.
The map request queue
It ’s possible to consult
the map request queue to see how many requests are waiting to be processed.
Each line shows the username, the
request time and the nature of the request.
The users can delete one of their
requests by double-clicking on it.
4.3 Regional maps
The mapping menu also proposes two
categories of regional maps : small size and large size.
For regional maps, there is no
Arc/Info processing after the request since the graphic files are
pre-processed and are therefore ready to be sent to the printer or to
the plotter.
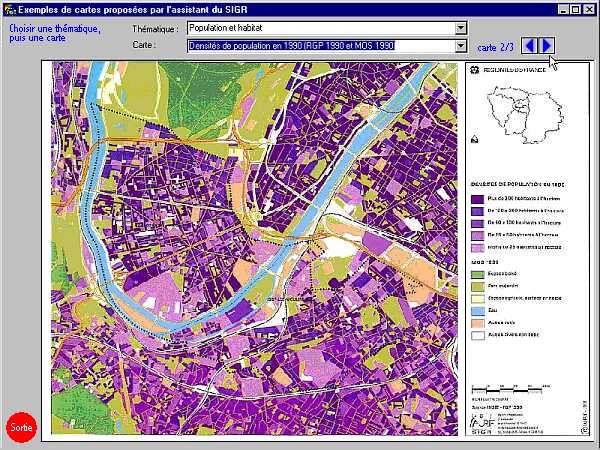
4.4 Examples of maps
The mapping menu also allows users
to consult examples of the various available types of maps.
For each type of map, the users can
visualize two or more examples, in various scales and in various
contexts (urban or rural areas, etc.).
5. The mapping services of the RGIS Assistant
5.1 User needs
The users wanted a very simple tool to view and browse the RGIS data layers even if they didn’t have any knowledge about how the data-base was organized.
They wanted a very simple interface, allowing self-training and occasional use.
They needed a catalog of pre-defined maps, with some simple functions for browsing the attributes.
We have called this application the " RGIS Window " : let us see now how it works...
5.2 The RGIS Window
Once launched, the application asks
the user to choose a map.
To date, there are about fifty
pre-defined maps in the application.
Selecting the map to be displayed
The available maps are organized in
a map catalog, with thematic entries (population, land use,
environment, networks, etc.).
These entries are displayed on the
left-hand frame (sorry, they have not been translated for the paper...)
The right-hand frame displays all
the maps which are related to the selected thematic entry.
Map display, legend box,
situation view
After selection, the map is drawn
on screen in a MapObjects frame.
The map below shows the railway
network to its full regional extent.
The different colors correspond to
the various service categories.
The railway stations are small
black dots.
The background indicates a simple
land use, with only four colors.
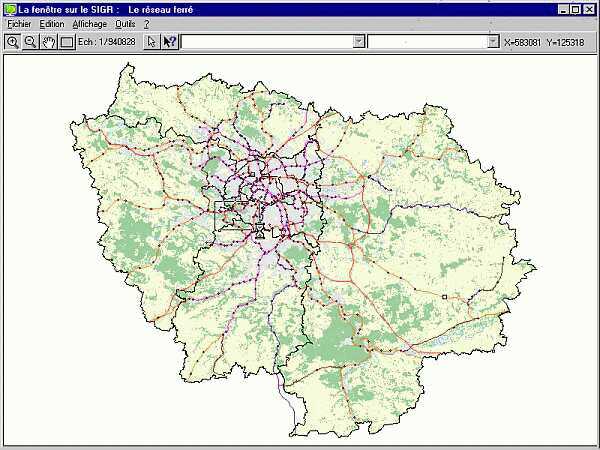
On the top left, there are four buttons to zoom in, zoom out, pan and return to full view.
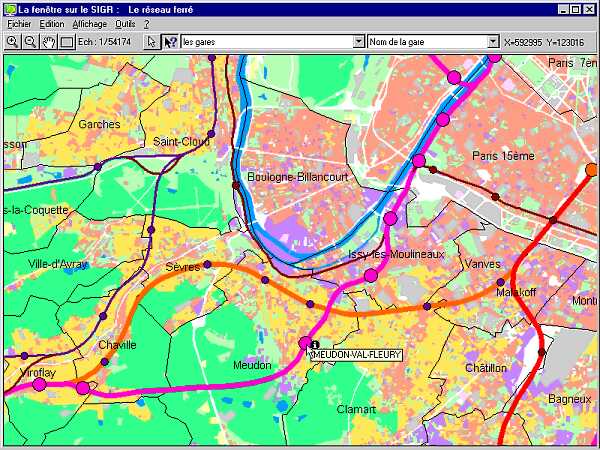
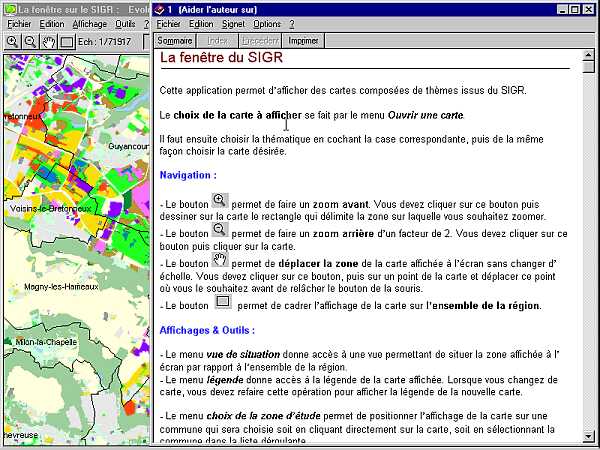
The picture below shows how the
display automatically adapts itself to the scale : After zooming in,
the land use background becomes more detailed : 11 colors intead of four.
The commune boundaries and commune
names are now visible.
The railway stations are drawn with
symbols depending on their status.
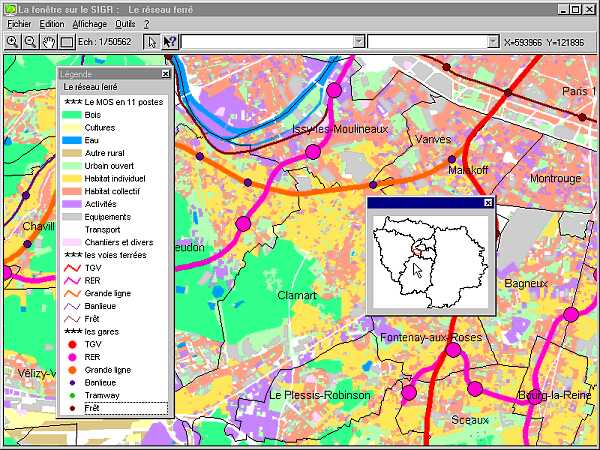
By using the menu, the user can
call up a legend box : it appears in a separate window. This
window can be moved above the map and closed when it is no longer needed.
Actually, priority is given to the
map display area.
In the same way, the user can call
up a location vew which shows the extent of the displayed map and
optionally allows to graphically redefine the map extent within the region.
Browsing the attributes
It’s possible to browse the
attributes related to the themes which are displayed. To do so, the
user must press the button marked with a black arrow and a question
mark. This activates the two entry fields on the top right.
These two fields are drop-lists
which allow the user to choose which theme and which attribute he
wants to browse.
After selection, the attribute
values are automatically displayed on a label attached to the cursor,
just by moving the cursor across the map.
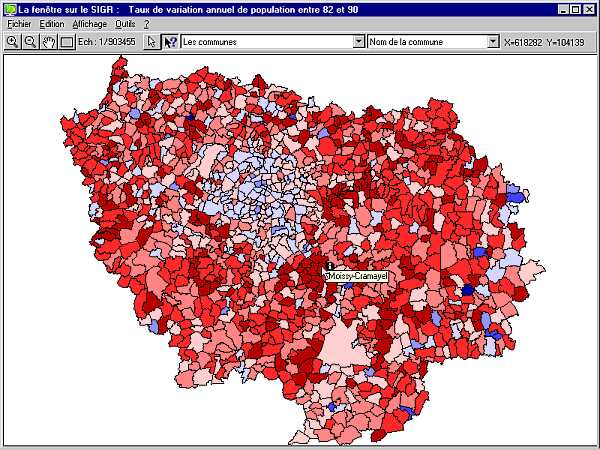
Examples of maps
These are some samples of maps
which can be displayed by the RGIS Window.
The map below shows the population changes between the two last censuses :
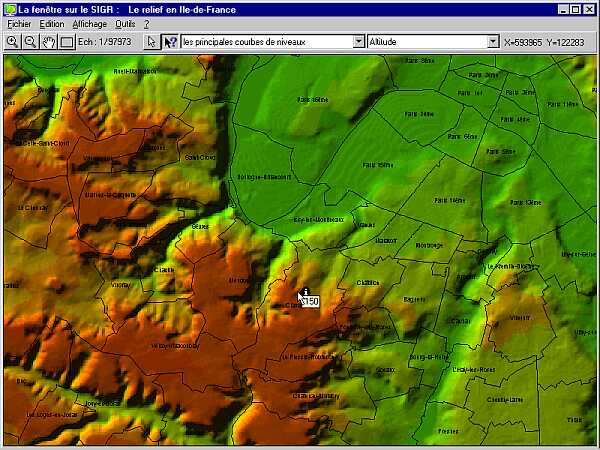
This one displays a TIFF image which is a hillshaded representation of the terrain relief :
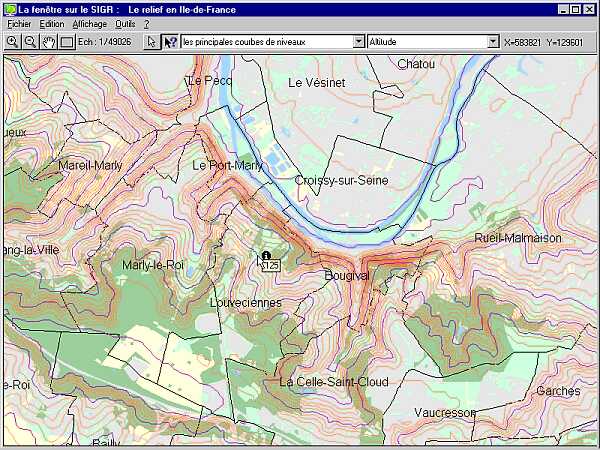
At a larger scale, the TIFF image is replaced by contour lines with a simplified land use background :
Some other tools
Of course, there is a tool to allow
users to set the map extent to a given commune : this tool displays a
commune map with a list. The user chooses a commune in the list, and
the main map will be redrawn within the commune boundaries after validation.
There is another useful tool to copy and paste from this application to another : users can copy either the map, or the legend, or the situation view and paste one of those in a document they are authoring.
There is also a Help file that gives basic explanations about the application (in fact this help file is very short since the application is very simple to use).
Development aspects
The application has been developed
with Visual Basic and MapObjects 1.2.
The geographic data is stored as
shapefiles or TIFF images.
We had to add some functions to MapObjects.
The first one is a Librarian-like
approach for very large datasets.
In our regional GIS, we use
Librarian within ArcInfo to store some large data layers : for
example the land use layer, which encompasses about four hundred
thousands polygons.
We have kept the same tiles for our
shapefiles and we managed to make MapObjects cope with them.
We also managed to adapt the
display to the scale : Some datasets are or are not displayed
depending on the scale. And the way most datasets are displayed also
depends on the scale.
In the same field, there is another
function that we added to MapObjects : the size of the symbols is
proportional to the scale, with mini and maxi thresholds.
Last point : the maps are not coded within the application. They are described outside the application in INI files.
INI files are text files which are
managed by the Windows system.
We use these ascii files to store
the descriptions of all the maps which are proposed by the application.
For each map, we store the thematic
entry, the name, and the constituting layers.
For each layer, we store :
- the symbology, which may depend
on the scale,
- the elements used to build the
legend box,
- the browsable attributes (with
their name in clear language).
This technique allows for an easy handling of map descriptions without modifying the code.
6. The Help and Info services of the RGIS Assistant
6.1 Help services
In each form of the RGIS Assistant, help buttons provide information for the user on how to use the application.
We use the Microsoft Windows Help
System, which provides some useful functions such as :
- contextual help
- hypertext links
- index with key-words
In the main menu of the application, the Help menu proposes direct access to some general help tools :
6.2 Info services
The Info menu of the RGIS Assistant gives information about the RGIS itself or about the datasets in it :
There is also some information about the partenerships which have been established around the GIS and some recent news about the RGIS.
Users can also call up several working documents in Word or Excel format, in order to copy them onto their own PC and re-use them for example in a text that they are currently writing.
Very few files are stored on the
users’ PCs : all the executable files and all the data
files are stored on a server, somewhere on the agency local network.
But the PCs can see these files
in their directory tree and they can use them as if they were local.
This brings two valuable advantages :
1. the footprint on the PCs is
very small.
2. updates of the application
are made solely on the server : the 120 networked PCs become
updated in the same operation.
We have also installed the
application on a few standalone PCs, mainly laptops. We use a CD to
install (the footprint on the hard disk is about 500 Mb).
8.1 Reactions from the users
The application was developed last
year and put into practice last September.
So far so good : the users are very
satisfied with the application.
They find it easy to use.
They like the wide range of
functions available, the large number of available maps to date and
the quality of paper maps and displays.
Over five hundred paper maps of
various sizes are printed every month.
Since last September we have
produced five thousand paper maps with the application.
An average of forty users access
the RGIS window per month to display maps on their PC ( these users
change from one month to another, depending on the studies in progress).
We have constant requests to add
new maps to the application.
8.2 Nice surprises and unexpected benefits
Our first big surprise was our success at the Esri-France Application Contest last September.
Another unexpected indirect benefit
is that we are now able to use this application to demonstrate our
regional GIS to our visitors. We use a laptop and a box light for
this. It is very convenient.
This was also an opportunity for us
to work as a team with many colleagues throughout the company. During
the development phase, they shared their knowledge and experience,
providing existing Aml programs and helping to design the maps. This
application proved to be a fantastic way to capitalize on this very
important expertise stored up for years.
8.3 Positive and negative aspects of Esri products
We have chosen ArcPlot to produce
the paper maps because of its good mapping capabilities. We already
knew this product very well. On the whole we were very satisfied with
its performance.
As for Aml, it was neither good nor
bad ! We also knew this product very well and were used to
dealing with its weaknesses.
MapObjects provided a good starting
point for the development of our application. We had very few
problems with the 1.2 version, in spite of some missing functions
that we had to develop by ourselves.
8.4 Prospects for the future
Some improvements are being considered to enrich the application. But we want to keep it simple : we don’t want to replicate ArcView !
We are in the process of installing the system at the Regional Council and intend to do the same in other organisations.
We are also thinking of an Internet version which would provide similar functions.
Michel Hénin
IAURIF, GIS Manager
Phone : 33.1.53.85.76.30
Fax : 33.1.53.85.76.36
e-mail : michel.henin@iaurif.org
Fabrice Thévenon
IAURIF, GIS developer
Phone : 33.1.53.85.76.22
Fax : 33.1.53.85.76.36
e-mail : fabrice.thevenon@iaurif.org
Régis Dugué
IAURIF, GIS developer
Phone : 33.1.53.85.76.18
Fax : 33.1.53.85.76.36
e-mail : regis.dugue@iaurif.org
Mail address :