Urban Drainage Network Modeling
Better Analyzed Using
ArcView 3D Analyst
ABSTRACT
| When studying urban drainage systems using techniques like hydrodynamic calculations an overwhelming amount of data are produced and are to be interpreted. Additional information like street plans, groundwaterlevels, full-terrain models etc. is very helpful in quickly determining the necessity of measures to be taken in case of i.e. flooding problems. Moreover when acquiring data and building a computer model for a given sewer network it is laborious to eliminate data-errors. Arcview and 3D-analyst provide visualization techniques which enhance the data checking an interpretation of modeling results. Dynamic water flow in the sewer network as well as water levels in man-holes can be visualized. |
A lot of GIS-applications will gain efficiency if they are enriched with 3D-technics. Significant benefit can be gained on aspects such as improvement of data-validation, increase in insight and more flexible calculation-exercises. The accessibility of modeling-results will improve, which is an advantage by the presentation of this results for non-colleagues
3D-GIS increases insight into drainage systems
3D-GIS offers
new potential in visualizing spatial information. Often GIS is linked to
computer models in order to visualize the model results. 3D-GIS offers
a new dimension in this aspect.
The main
application for this technique in the GIS world is the visualization of
phenomena at surface level and of soil layers or groundwater levels below
surface level. However, 3D-GIS offers a powerful tool in gaining insight
into piping/cabling systems such as drainage systems.
Drainage
There is approximately 80,300 km of underground drains in the Netherlands. As long is everything functions properly, there is little concern about this system, until a heavy storm occurs, and water cannot drain rapidly from the streets. In the Netherlands, about 85% of the storm water/sewerage is a mixed gravity sewer system.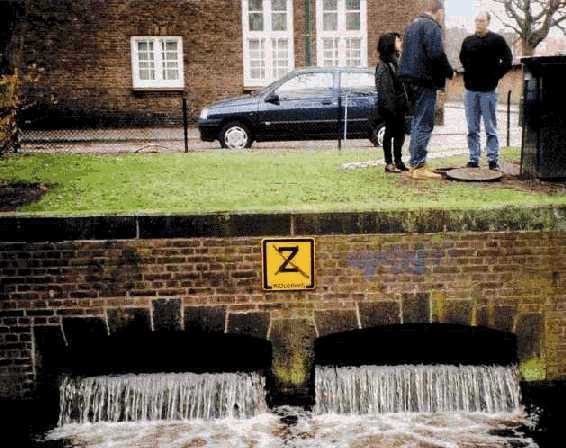 The drainage network in which stormwater discharges whether or not in a
combined sewerage system or the dry weather drainage is gravity flow. The
capacity of the drains is determined by the flow that can be discharged
by the drainage system and the storage available. When hydraulic capacity
is insufficient in a certain discharge situation, flooding occurs and water
discharges on surface waters. The occurrence of these events must be minimized,
particularly because of the composition of wastewater in mixed sewerage/drainage
systems, related to public health hazards.
The drainage network in which stormwater discharges whether or not in a
combined sewerage system or the dry weather drainage is gravity flow. The
capacity of the drains is determined by the flow that can be discharged
by the drainage system and the storage available. When hydraulic capacity
is insufficient in a certain discharge situation, flooding occurs and water
discharges on surface waters. The occurrence of these events must be minimized,
particularly because of the composition of wastewater in mixed sewerage/drainage
systems, related to public health hazards.
Modeling
To assess the hydraulic functioning of drainage systems and to judge possible structural improvements, modeling as well as field measurements are required. Such models are used to make hydraulic calculations to quantify the efficiency of proposed modifications to the system, such as limiting overflow discharges or preventing or reducing flooding in the catchment area. With a model, (HydroWorks; Wallingford Software Ltd.) event calculations and series calculations are carried out. An event calculation gives general insight into the hydraulic functioning of the drainage system, and when and to what extent water flooding may occur. These calculations are made with ten standard storm events, to each a reoccurrence time is assigned. A series calculation is made to obtain the statistical overflow frequency, in which the behavior of overflow and discharge are described and quantified. Such calculations require major data input and generate a large data output. The accuracy of the input data must be checked to ensure correct modeling. In addition, the results must be assessed and interpreted. These are labor-intensive activities which need to be carried by experienced experts. Advanced GIS techniques offer major advantages in checking input data and interpreting model results.Checking drainage
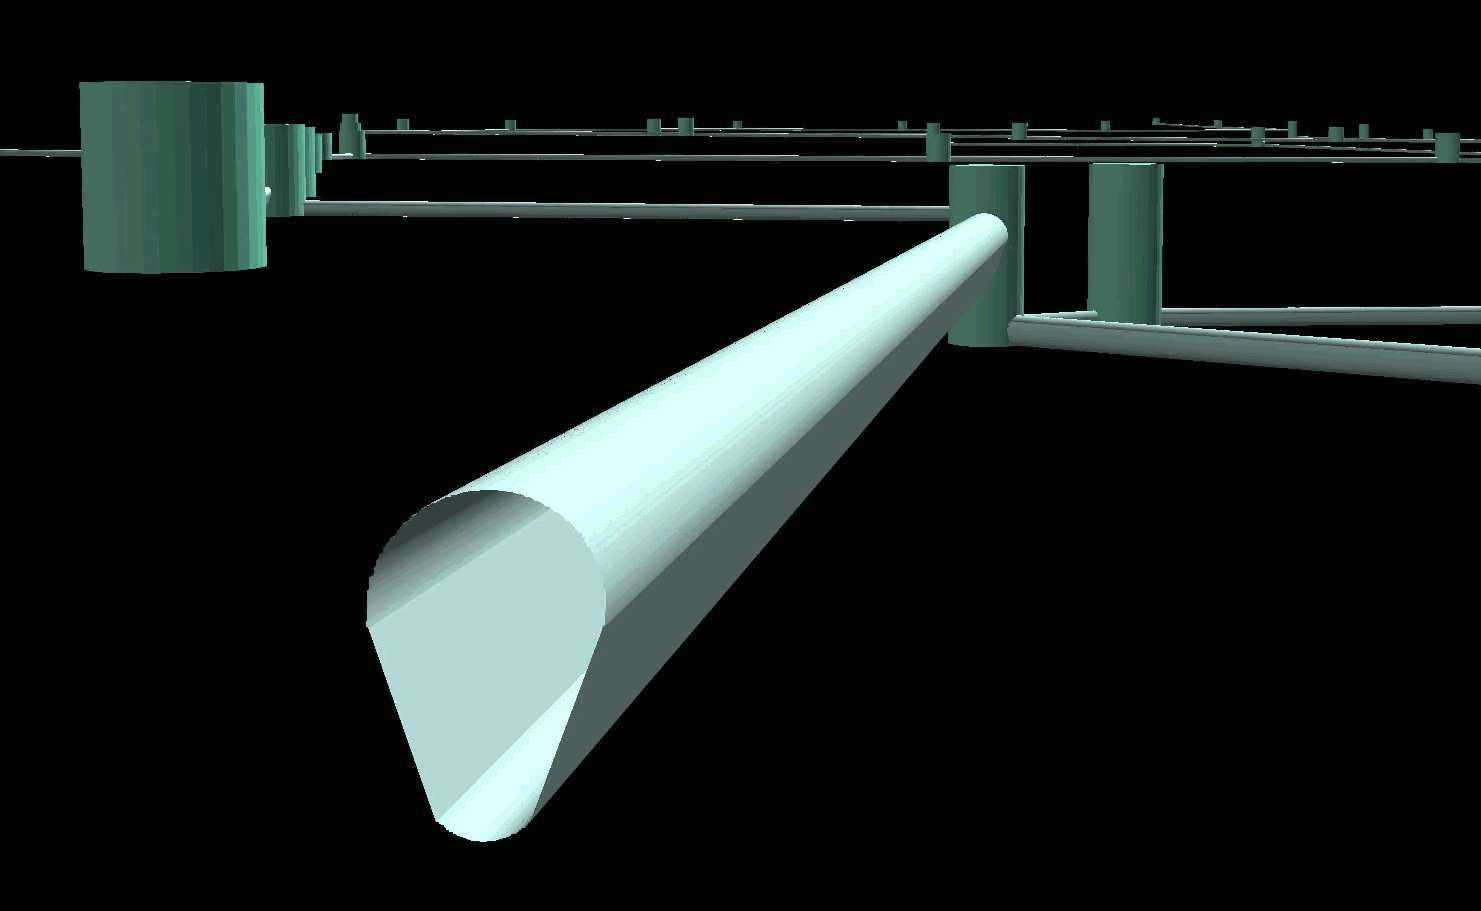 Accurate
information about a drainage system is essential in computer modeling.
Digital information is often stored in a management package or in CAD drawings.
In addition to the geographical layout of the system, there are also drains
and conduit codes as well as the diameter of the conduit and the depth
of the drains and conduits. GIS is a powerful tool for checking the completeness
and accuracy of information about a drainage system. As well as 2D overview
maps which can be used to assess the location, completeness and coding,
3D visualization can be used to establish the depth of the system. ArcView
3D analyst can be used to maneuver through the system and to check the
invert levels and drain connections. This greatly increased clarity and
insight into the system.
Accurate
information about a drainage system is essential in computer modeling.
Digital information is often stored in a management package or in CAD drawings.
In addition to the geographical layout of the system, there are also drains
and conduit codes as well as the diameter of the conduit and the depth
of the drains and conduits. GIS is a powerful tool for checking the completeness
and accuracy of information about a drainage system. As well as 2D overview
maps which can be used to assess the location, completeness and coding,
3D visualization can be used to establish the depth of the system. ArcView
3D analyst can be used to maneuver through the system and to check the
invert levels and drain connections. This greatly increased clarity and
insight into the system.
Drainage area
One of the input variables of the hydraulic model is the allocation paved area and the drainage area to the calculation units in the model. Many of these calculation units are drains. Account taken of the possible disconnection of the built-up area with the drainage area, divided by the pavement types allocated to the drains. The distance criterion is used here.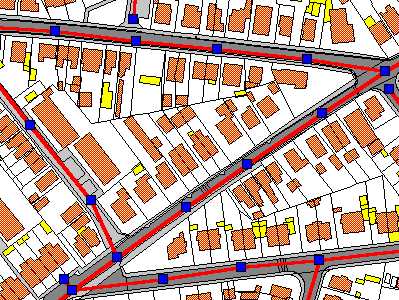 When
the conduits are used as calculation units, processing requires more calculations.
In determining the drainage area, often the GBKN is used. The GBKN (Large
Scale Map of the Netherlands) is a digital topographic map developed mainly
as a reference for FM-purpose. Even though the quality and completeness
of the GBKN varies considerably, it is a good starting point. The GBKN
is a vector database with line attributes. This database often does not
contain polygon information. In the GIS, the GBKN can be processed semi-automatically
to a polygon cover, which distinguishes built-up area and open and closed
pavement. On the basis of a repeat reconnaissance or aerial photos, the
built-up area can be differentiated into buildings with sloped and flat
roofs. This differentiation is important for hydraulic calculations, as
sloped roofs discharge rainwater more rapidly to the drainage system than
do flat roofs. The catchment-areas are determined by using Thiessen-polygons for allocation toe the man-holes ore Euclidean distance for allocation to the conduits.
When
the conduits are used as calculation units, processing requires more calculations.
In determining the drainage area, often the GBKN is used. The GBKN (Large
Scale Map of the Netherlands) is a digital topographic map developed mainly
as a reference for FM-purpose. Even though the quality and completeness
of the GBKN varies considerably, it is a good starting point. The GBKN
is a vector database with line attributes. This database often does not
contain polygon information. In the GIS, the GBKN can be processed semi-automatically
to a polygon cover, which distinguishes built-up area and open and closed
pavement. On the basis of a repeat reconnaissance or aerial photos, the
built-up area can be differentiated into buildings with sloped and flat
roofs. This differentiation is important for hydraulic calculations, as
sloped roofs discharge rainwater more rapidly to the drainage system than
do flat roofs. The catchment-areas are determined by using Thiessen-polygons for allocation toe the man-holes ore Euclidean distance for allocation to the conduits.
Simulation
With linkage to 3D-GIS, model results can be assessed. Witteveen+Bos has developed a ArcView-application to visualize an access the model results. This application, called Ritme (RIolerings Tool voor Model Evaluatie (Sewerage Tool for Model evaluation)) is developed using only ArcView 3D Analyst and Avenue. The 3D visualization provides a spatial picture of the system, the location of the conduits and drains and the conduit diameters. By linking the model results, the rainwater discharge in the system per time period can be simulated for a specific rainfall. The discharge conduits is visualized in a classification of six categories. The water level in the drains is presented in the third dimension. So the fluctuations in levels during the discharge period can be seen. When water in a drain reaches the freeboard (0.20 cm below surface level), the water threatens to overflow at street level.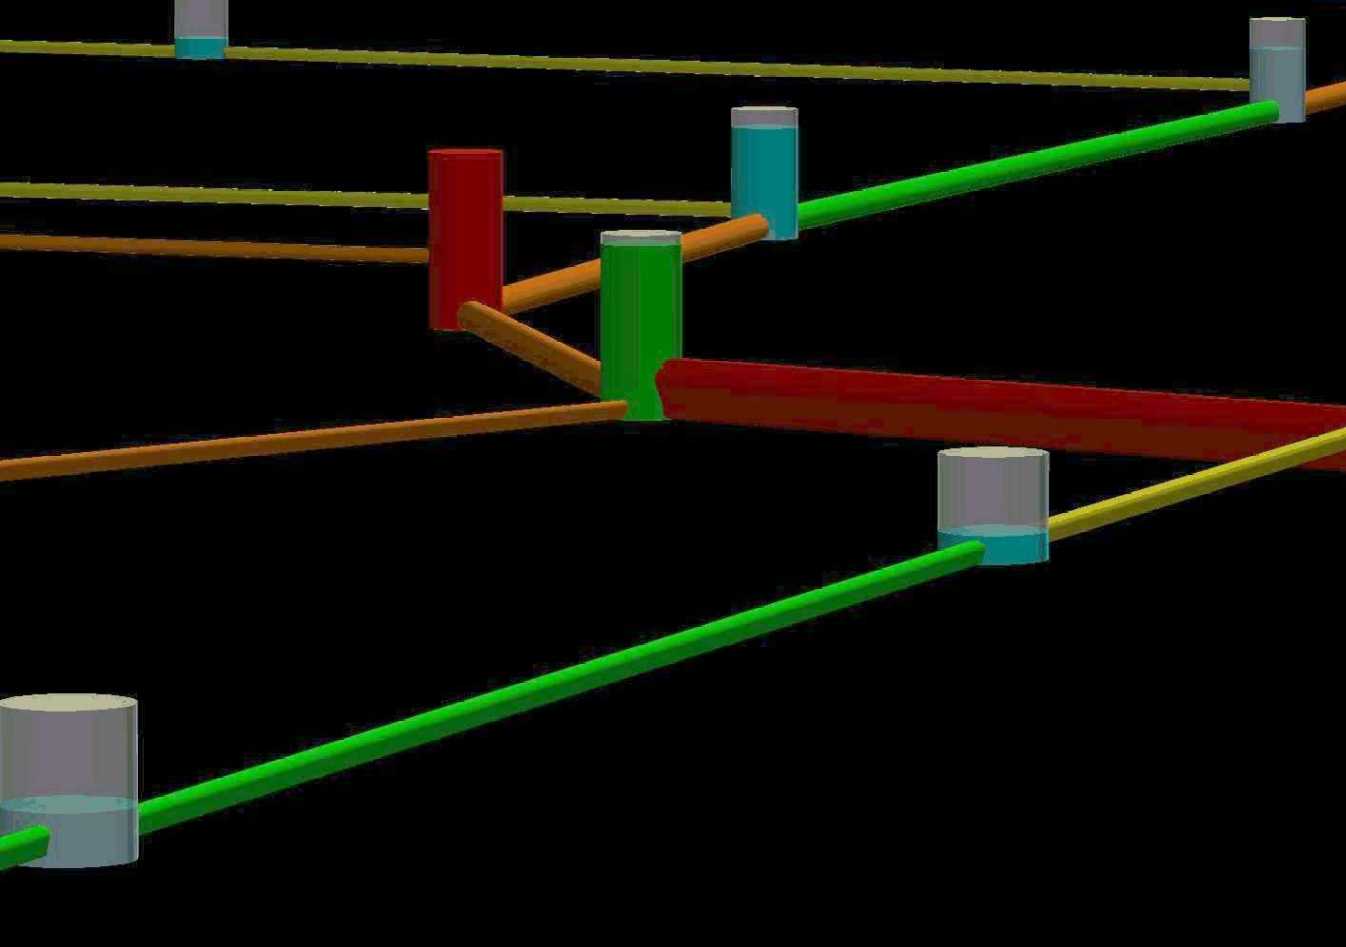 This
water level can be classified in the same way as the discharges and designated
by color codes. If the water level in the drain rises above surface level,
then there is water on the street. This situation is given the color code
red. By processing consecutive time steps with a short interval one after
the other in an application, you can see the dynamic process of water discharge
through the drainage system from a vantage point of your choice. The movement
of the discharge is clearly visualized. Because you can click on the 3D
visualization, all information about the present situation can be obtained
at any time, such as gauge levels, discharge and fluxes. Replay of the
simulation or selection of a specific moment can be done as an aid to selecting
the required measures, such as adjustment of the diameter of one or more
conduits. In some cases, it may be necessary to disconnect a conduit or
additional connections may be required. In a GIS environment, such modifications
can be applied and the results imported into the hydraulic model. The calculation
can be carried out again and the effects assessed.
This
water level can be classified in the same way as the discharges and designated
by color codes. If the water level in the drain rises above surface level,
then there is water on the street. This situation is given the color code
red. By processing consecutive time steps with a short interval one after
the other in an application, you can see the dynamic process of water discharge
through the drainage system from a vantage point of your choice. The movement
of the discharge is clearly visualized. Because you can click on the 3D
visualization, all information about the present situation can be obtained
at any time, such as gauge levels, discharge and fluxes. Replay of the
simulation or selection of a specific moment can be done as an aid to selecting
the required measures, such as adjustment of the diameter of one or more
conduits. In some cases, it may be necessary to disconnect a conduit or
additional connections may be required. In a GIS environment, such modifications
can be applied and the results imported into the hydraulic model. The calculation
can be carried out again and the effects assessed.