The Marine Aids Program of the Canadian Coast Guard, Department of Fisheries and Oceans, is responsible for the review of aids to navigation systems to ensure the provision of equitable, safe and cost effective marine transportation. Aids system reviews have traditionally been carried out using paper hydrographic charts, graphs and tables and have been very labour intensive.
In an effort to improve the efficiency of the marine aids review process, the Marine Aids Program Review Analytical Tool (MAPRAT) has been developed using ArcView GIS. The result is the ability to analyze numerous aids system design options under various climatic conditions and using known vessel routes
In future, it will be possible to use MAPRAT to conduct all stages of an aids system review, including the site analysis of weather conditions, wave and current patterns, users, vessel traffic patterns, and search and rescue activity.
The Marine Aids to Navigation Program of the Canadian Coast Guard installs, operates and maintains a system of Aids to Navigation throughout the coastal communities, inland lakes and waterways of Canada. Aids to Navigation such as lightstations, buoys, beacons, Loran C and Differential Global Positioning Systems (DGPS) assist mariners to avoid dangerous waters, determine vessel position and chart courses.
Reviews of existing aids are conducted on a 5-year cycle to select the appropriate locations and types of aids to navigation for the level of vessel traffic in the waterway under study. The reviews of aids to navigation systems are divided into 4 stages (Canadian Coast Guard, 1992):
Aids to Navigation reviews have traditionally been conducted manually using tables, graphs and paper-format hydrographic charts. A typical review may take several days, using these labour-intensive techniques.
The Marine Aids Program Review Analytical Tool (MAPRAT) has been developed within ArcView as a desktop GIS to make the review process more efficient and effective. MAPRAT can facilitate all stages of the review process, with particular emphasis on identifying unmarked hazards, required visible distance of aids and the comparison of aids system design options.
Frequently used vessel routes can be viewed and intersected with vector bathymetry (water depth) data to determine unmarked hazardous locations. MAPRAT calculates and displays the minimum required visible distance (perception requirement) for aids in conjunction with the actual visible distance to show where equipment upgrades may be required. MAPRAT displays the actual visible distance aids using attribute information under different visibility (i.e. fog) and background lighting (i.e. city lights) conditions.
An aid system design option consists of several aids working together to meet the user vessel requirements for the waterway. Alternative design options can be created and tested by adding new aids or by repositioning or removing existing aids. The effectiveness of several possible design options can be analyzed by displaying the visible ranges of the aids to determine whether complete coverage is achieved under typical and severe weather conditions.
MAPRAT simplifies the review process while allowing for more thorough analysis of the implications of changes to a system of aids. A larger number of aid design options can be tested under more visibility conditions in less time than it would take using traditional methods. The increase or decrease in the level of service provided by a design option can be shown graphically and used to communicate the impacts of proposed changes to affected mariners.
MAPRAT was developed using a rapid application design and development (RADD) approach. Upon project start up, a Requirements and Design Workshop was conducted to clarify and further define the requirements and functionality that were described in the project Terms of Reference. At this time, the scope of the project was also refined with input from all project team members, including the end users of the application, the staff in the Marine Aids Program Review Office.
The information from the Terms of Reference and the Requirements and Design Workshop were then translated into a Detailed Design Document which was reviewed and approved by Coast Guard staff for accuracy and completeness. This document was used as the guide for the development of the initial functionality of the application, which was presented to the users through a prototyping approach.
Each of the four prototype sessions introduced a new area of the application’s interface and functionality to the review officers, based on the specifications of the Detailed Design Document. The sessions allowed the users to assess how well the documented design translated into functionality in an integrated desktop application. This approach provided an opportunity to make adjustments early in the development process, and supported continual improvement of the application, by incorporating suggestions on how to tailor the interface and functions to best support the Marine Aids review process.
The development process created a final system that fits directly into the Marine Aids Review process. Vessel Route management and analysis exist to facilitate the identification of unmarked hazards or under-serviced waterways. Aid tools allow for both the identification of required aid types and for analysis of existing and proposed changes to aids under different weather conditions.
Nautical charts are irregularly tiled, so that there can be several charts at varying scales covering a particular area. As the user pans and zooms in the display window, appropriately-scaled charts are added automatically to the theme list. The current view extent is intersected with an index theme, giving all the available charts. That list is refined to exclude charts that are either too detailed or too coarse for the current view scale. This feature makes MAPRAT much more intuitive for users not experienced in GIS.
Aids to Navigation are displayed as points in MAPRAT, with attribute information taken from a SQL Server database maintained by the Marine Aids program. Each aid has approximately 20 attributes, including those required for identification, MAPRAT calculations, and proper symbology.
An Aids Properties dialog box displays aid attribute information and allows the user to change values to test the implications of changing the characteristics of an existing aid. However, no changes are permitted directly to the existing aids theme. Any change to an existing aid results in the creation of a new, user-defined aid. This feature preserves the integrity of the aid to navigation database while allowing the testing of several design options. At any time, the user can remove the proposed changes to restore the current situation. The Aid Properties dialog also controls aid editing (move, clone, delete, add new aid), as well as the display of visible ranges for the selected aids.
Visible range is an arc that defines the maximum distance from which an aid can be seen. The required visible range of an aid depends on many factors, including how the vessel approaches the aid and the navigation equipment on board the vessel. Required visible ranges are known as Perception Requirements and can be calculated and displayed on an aid-by-aid basis. The required visible range can be compared with the actual visible range to show necessary equipment modifications (see Figure 1).
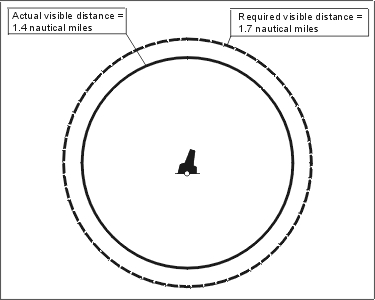
Figure 1: MAPRAT can illustrate gaps in required service
During the initial Site Analysis stage of a review (see Background section), typical and extreme atmospheric conditions are determined from weather data from the area. The weather conditions affecting the waterway will impact the effectiveness of the aids to navigation. For example, if a harbour is close to a major city there will be a reduction in the visibility of lit aids due to interference from background lighting. Another factor is the tendency for fog or haze in an area which will also reduce how far aids can be seen. Atmospheric visibility and background lighting conditions can be set and applied to all aids, to selected aids or to individual aids. These settings are used in the calculation of actual visible ranges, so that once set, circles are drawn around each aid showing how far that aid can be seen under the specified atmospheric conditions (see Figure 2).
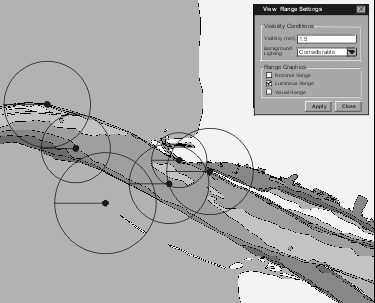
Figure 2: Circles illustrate how far aids can be seen under the specified visibility conditions
One of the major benefits of using MAPRAT over traditional manual techniques for calculating and plotting visible ranges is the ability to compare different systems of aids to determine the best combination to meet user vessel requirements. Aid system design options can be created by adding new aids or editing existing aids. Design options can be saved as scenarios and opened in later MAPRAT sessions. A scenario consists of the location and attributes of user-defined aids, the global and over-ride visible range settings and the current view extent.
The ability to compare several design options quickly and easily represents a significant advancement over traditional review techniques. Consider, for example, a set of 100 aids on a major river system in a large city. To determine how far an aid can be seen, the review officer must: refer to a List of Lights book or to the aids database to determine the optical intensity of the light (how strong the aid light is, measured in candela); use a graph to determine how far the aid can be seen under the specified background lighting and atmospheric visibility conditions; use a compass to manually plot the visible distance of the aid to scale on a paper-format hydrographic chart. The entire process for one aid usually takes at least 5 minutes. Multiply 5 minutes per aid by 100 aids in the waterway and to estimate 8 hours to draw the visible distance of all the aids in one proposed design option under one set of atmospheric and background lighting conditions. Consider that a thorough analysis should consider several design options (combinations and positions of aids) under at minimum summer and winter visibility levels and it becomes clear that the traditional review techniques are extremely labour-intensive and time-consuming. Compound that with influences from error in the graph and plotting techniques and the impact of simple human fatigue and the traditional review techniques are shown to be inaccurate as well.
Since the development of MAPRAT, the visible distances for 100 aids can be calculated in 5 minutes, which represents a substantial time savings from 8 hours. The time that was once used to prepare one design option can now be used to plan and test several design options under more atmospheric conditions, resulting in a more thorough analysis.
In addition to the functions used to edit point, aid to navigation features, MAPRAT can also be used to create, display, and analyze linear vessel traffic route features. A vessel traffic route is the actual or planned path that a ship or smaller vessel travels through a waterway. Vessel traffic routes can be created using the mouse or imported from other applications that use Open Navigation Format data files.
Routes contain attribute data associated with the route vertices (waypoints) that make up the route, and information that applies to the entire route. The geographic coordinates of the waypoints, and the range and bearings between waypoints are automatically calculated by the application and displayed in attribute forms and standard ArcView query tools. Although the standard projection for nautical charts is Mercator, all coordinate values are displayed in latitude / longitude degrees, minutes, and seconds. Ranges are displayed in nautical miles, bearings in true degrees. The application uses great circle navigation formulae to accurately calculate the range and bearing between points. Figure 3 shows an example of the attributes associated with a waypoint.
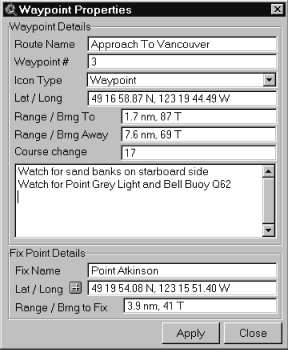
Figure 3: Waypoint Attributes
Each waypoint can contain a fix point. A fix point is a landmark or aid to navigation that the mariner uses to determine that the vessel is at the waypoint. MAPRAT calculates the position, range, and bearing from the waypoint to the fix point, and displays a purple line on the display between the waypoint and fix point.
MAPRAT can warn the user if a route intersects shallow water. A dead-reckoning error tool is used to automatically create ‘potential navigation error’ polygons on the route that represent the distance that a mariner might deviate from his intended course between fix positions. When an error polygon is created, the minimum depth for the polygon is determined by analyzing the bathymetric data for the most detailed nautical chart present under the error polygon. The ‘settings’ form is used to set the critical depth considered dangerous for a particular vessel type. The navigation error polygon outline colour changes depending on whether the water under the polygon is shallower or deeper than the critical value or if there is insufficient data to make a safety determination.
MAPRAT can also warn the user if a route contains hazardous course changes. If a route contains course changes greater than the value set in the ‘settings’ form, alarm graphics are automatically placed at the waypoints where hazardous course changes occur. An example route including its components is shown in Figure 4.
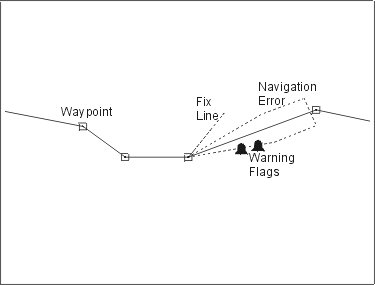
Figure 4: Components of the Route object
The map view displays the routes and waypoints in the same manner as standard ArcView themes, but the routes are not stored in coverages or shapefiles. Routes are implemented using an object-oriented approach that encapsulates the waypoints, attributes, and other objects associated with the route into a custom route object. Route objects can be saved in separate route files in a user directory, or written to Open Navigation Format files. All route attributes and objects are saved with the route.
The route functions in MAPRAT greatly facilitate the initial Site and Needs Analysis stages of the marine aids review by increasing the understanding of vessel traffic patterns and hazards to navigation in an analysis area.
MAPRAT is unique in several ways. Firstly, it represents one of the first applications of marine aids locational analysis in a GIS. Secondly, the use of prototypes during the development process allowed for rapid feedback and implementation of required changes. At a more technical level, the Avenue programming techniques used to build the application and the object-oriented approach to route feature storage were innovative, achieving of the desired results quickly and effectively.
Nevertheless, the system could be expanded and improved to incorporate more aspects of the marine aids review process. The GIS could be used in the Site Analysis stage of the review when an inventory of the conditions and activities affecting the waterway are studied, to view weather, tide and current data in conjunction with aids and vessel routes to identify relevant threats and hazards at the site. Additionally, MAPRAT Version 1.0 does not readily facilitate the final stage of the review, Cost Analysis. Functions and utilities could be added to estimate the installation and maintenance costs for each design option under consideration.
MAPRAT is now in use in the Marine Aids Program office in Victoria, British Columbia. The success of the MAPRAT project is attributable to the involvement of the users at all stages of the project. The review officers requested a tool to help eliminate the tiresome components of the review process and they were active and involved participants throughout the development process.
More information about MAPRAT and other GIS applications in use or under development in the Canadian Coast Guard - Pacific Region can be found at the CCG Pacific Region GIS Web Page.
Procedures Manual for Design and Review of Marine Short-Range Aids to Navigation Systems. Canadian Coast Guard, 1992.