INTEGRATING GIS AND REMOTE SENSING WITH URBAN HYDROLOGY
Xiaohui Zhang , George Ball, Phil Guertin, Eve Halper and Lihong Zhang
Advanced Resource Technology Group
School of Renewable Natural Resources
University of Arizona, Tucson, AZ 85721 USA
e-mail: xzhang@nexus.srnr.arizona.edu
Abstract
This paper presents an integrated system to improve urban hydrologic modeling with GIS, remote sensing (RS) and hydrologic simulation. Satellite images for a highly developed urban area were used to automatically acquire land use information. Next, a GIS derived the distributed hydrologic parameters from processed satellite images and incorporated them into a GIS spatial database. The GIS organized the input files for a distributed hydrologic simulation. The paper demonstrates the characteristics of an RS and GIS-based urban hydrologic simulation. Techniques to model urban drainage with a large database are discussed. A user-friendly interface was developed for supporting design and management.
Keywords:
GIS, hydrological modeling, integration, remote sensing, simulation, stormwater management.
1. Introduction
This paper presents an integrated system to support the urban stormwater runoff estimation by using remote sensing and GIS technology with a distributed hydrologic simulation. The integration framework is discussed first, then a real application is introduced. In the application, the study area is located in the city of Scottsdale, Arizona. High resolution GIS data, as well as three different remote sensing data were used to study the impact of remote sensing data to urban stormwater runoff estimation. The results show the advantages of the integration of RS and GIS with hydrologic simulation to improve the urban hydrology. One conclusion from this research is that RS and GIS complement each other; the high quality RS data is necessary in addition to high resolution GIS data for modeling a residential area mixed with some commercial and industrial uses.
1.1 Recent development in the integration of remote sensing and GIS with hydrology
Many types of hydrological analysis are limited by a lack of spatial data, since traditionally hydrological data are point measurements. Remote sensing data are fundamentally different, they incorporate spatial information. The rapidly developing GIS technology is a powerful tool to organize, process and visualize spatial data. Thus, RS and GIS can complement each other and enable hydrological models to be more physically based and more efficient. It is only during the last five years that an integration of RS and GIS with hydrological models became technically feasible (Baumgartner et al 1997). For hydrological modeling, the integration of RS and GIS was weak (Shih 1996). However, in 1998 Esri and ERDAS together released the Image Analysis tool for ArcView GIS, which directly linked some basic functions in RS and GIS.
GIS has provided a new environment to develop distributed hydrological models. These models take into account and predict the values of the studied phenomena at any point within the watershed (Mitas and Mitasova 1998). Zhang (1997) developed a framework integrating a stochastic space-time rainfall model and a distributed hydrologic simulation with GIS. Recently, Hellweger and Maidment (1999) implemented an automatic tool in ARC/INFO and ArcView to define and connect the hydrological units, then linking them to the HEC-HMS for the lumped hydrological model.
RS and GIS have become increasingly important in hydrology. However, the current use of RS information in the field of planning, design and operation of water resources systems still falls far below its potential (Schultz 1997). GIS technologies are relatively new and still near the lower end of the growth curve in terms of applications (Goodchild 1996).
Valuable urban spaces and resources require precise stormwater management and flood control. Stormwater runoff estimation is a fundamental problem for both urban planning and urban water resource management.
2. The framework of integration RS and GIS with hydrology
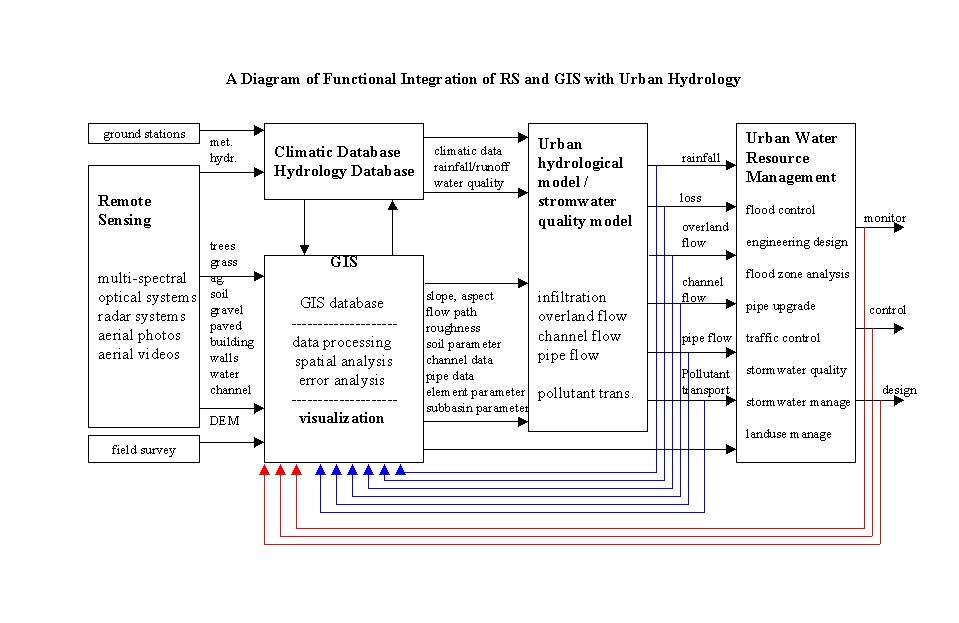
To best preserve the functionality of each software package in RS, GIS and distributed hydrologic simulation, coupling their inputs / outputs can be one approach for integration, since those software have been widely applied and extensively tested. The data exchange might be complex, but the computation in each subsystem has been proven to be reliable. Figure 1 details the functional integration of RS and GIS with urban hydrologic simulation in support of urban stormwater management (adapted from Zhang et al 1999). The functionality and coupling will be discussed.

The integrated system consists of four subsystems. These sub-systems are RS, GIS, hydrologic simulation and decision support. It is necessary to develop an information management system to handle the data exchange. A RS tool provides the spatial information on both land use (from optical RS systems) and rainfall information (by radar systems). GIS performs the spatial analysis at the multiple scales from multiple data sources. It also prepares the input files for hydrologic simulation. The simulated results will be stored, retrieved and visualized by GIS. These results provide support for decision making in urban resource management. A real application based on this framework will be introduced in the next section.
3. An attempt to integrate RS and GIS with urban stormwater management
In 1997, an attempt to integrate RS and GIS with urban stormwater management was made by a research group in The University of Arizona. It was initialized from a research project supported by NASA and The City of Scottsdale, Arizona. The study site was a highly developed urban area, Basin 9 in the City of Scottsdale, Arizona. Its area is about 6.69 square kilometers and is predominantly mixed residential with some industrial and commercial areas. The remote sensing data consisted of images from Landsat TM, SPOT, NS001 (which is a TM simulator with the same 7 spectral bands as TM but a 2.9 m spatial resolution) and aerial photography. The high-resolution (1ft grid size) digital elevation map (DEM) was acquired from the field survey. The GIS database included the data for streets, underground pipes, flow paths, soils, etc.. The distributed hydrologic modeling and simulation were carried out by using HEC-1 (it is now updated as HEC-HMS). GIS/Avenue, an ArcView programming language, was used to customize the information management system. This integrated system provided a new environment for both research and application.
3.1 Processing Remotely Sensed Data
Three remotely sensed images, Landsat, SPOT and NS001 were processed by supervised classification, then geo-registered and rectified with reference to aerial photography and street map. The identified categories were residential buildings, industrial buildings, asphalt, concrete, trees, grass, bare soil, water, and agriculture land. The processed images were spot-checked by the field observation in an adaptive sampling approach. NS001 show the best classification, since its sensor has best spectral resolution and highest spatial resolution of those three systems. Landsat TM has a more accurate classification of the paved area than SPOT, due to its higher spectral resolution. The impact of RS data resolution to hydrologic simulation were investigated in detail, the results will be introduced later.
3.2 Digital Elevation Modeling the Urban Watershed
A high-resolution DEM with 1-foot grid size was provided by the City of Scottsdale, together with a basin boundary map. The research team made field surveys to improve the GIS database, especially with regard to data on channels and flow paths. The field surveys showed that, in this area, it is necessary to model walled boundaries to delineate the sub-basins, since a mile-long wall can physically change flow direction. These walls could not be identified from the three RS images, and it was not in DEM either. Field investigations of flow paths were performed on some streets and large parking lots that were relatively flat, the flow paths were field investigated. Data were also collected along the channels. Data for detention ponds were collected in industrial areas. These field data greatly improved the GIS data quality. Using these data, the basin was partitioned by GIS hydrologic functions, based on pre-selected outlet points. The TOPOGRID function in ARC/INFO GRID was used to perform the hydrologic corrections. Figure 2 compares the basin partition with hydrologic corrections (based on the feedback from the field data) to the original one, using the same set of outlet points. In the hydrological corrected DEM model, in contrast to the original one, the streets no longer served as sub-basin boundaries, since the streets in this area have a shallow V shape.
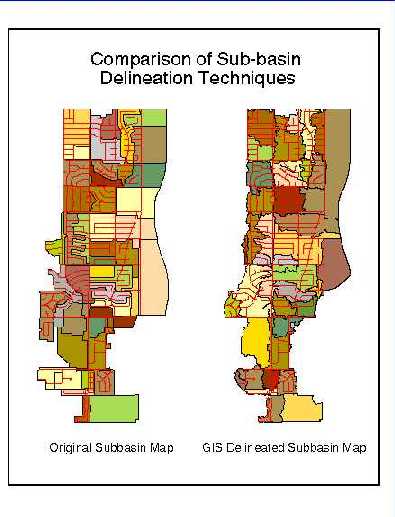
Figure 2. Comparison of Basin Patition
3.3 Hydrologic Parameterization by RS and GIS
Each processed image was converted to a grid. The spatial land use information was organized and processed with GIS tools. Using a rule base, the GIS determined the pixel hydrologic parameters based on the surface feature (soil type, vegetation type, ...) combined with other GIS data (natural channel, residential area, ...). The typical pixel hydrologic parameters derived mainly from RS are the surface resistance factor, N, and SCS Runoff Curve Number, CN. The parameters for modeling overland-flow elements were the area, average flow length, slope, roughness, and CN. For modeling flow routing along a channel or pipe, the GIS provided cross-section data, roughness and slope. Figure 3 shows the geo-reference connected RS and GIS with hydrologic parameterization together.
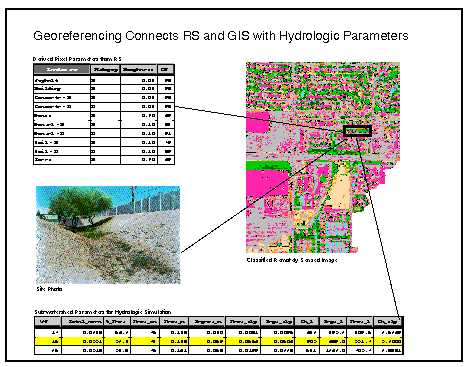
In summary, GIS tools played a central role for parameterization. Geo-referencing connected RS and GIS with hydrologic parameterization together. Here, the parameters were directly observed and then automatically derived from each pixel, which is significantly different from the traditional approach where the parameters were interpolated from the point measurements. It would be very difficult to apply the traditional interpolation approach in the highly developed urban area, where land use conditions change rapidly.
3.4 Hydrological Model and Simulation
To model the urban stormwater runoff processes with a high-resolution, a physically based hydrological model, with a set of non-linear partial differential equations, was required. Since those equations can not be solved analytically, and their numerical solutions are far beyond the existing GIS functions, thus, HEC-1 was used in this integrated system to model hydrologic processes.
With HEC-1, each overland flow element involves three hydrologic processes: precipitation, infiltration and runoff transformation. The channel element receives lateral inflow and may also route upstream flow. The kinematic wave approach was adopted in this model. The governing equations are described as

where Q is flow, A is the cross-section area, q is lateral inflow, R is hydraulic radius, S is the bed slope, n is Manning's resistance factor. Kinematic wave routing was used in this project. The rainfall loss was computed by SCS CN method in HEC-1. In HEC-1, the surface resistant factor N is slightly different from the Manning's n.
Regioanl design storms, with 5, 10, 25, 50, 100 year return periods, were used for simulation. The parameters derived from three remotely sensed images and GIS data were incorporated into the simulation. The simulation results were compared with the computed runoff by using the data from a ground survey, since no recorded historical rainfall-runoff data available. The results show that the simulation from high-quality remote sensing data is very close to the results by using the ground survey data, while the simulations from Landat TM and SPOT severely underestimated the flood flow. Figure 4 compares the simulation results at the basin outlet with 44 sub-basin configuration, where 'COS' is the result by the parameters from the ground survey in City of Scottsdale. Figure 5 shows the simulated flows with a 50-year storm event at one culvert in the basin and also at the basin outlet. In Figure 5, the highest runoff peak was produced by using NS001 data,and the lowest one from SPOT data. The results show that the care must be taken when we use RS data to model stormwater runoff in a highly developed residential urban area.
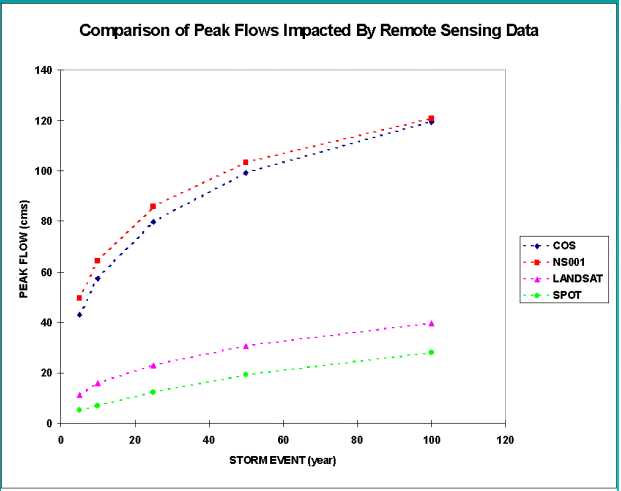
Figure 4. Comparison of Simulated Peak Runoff
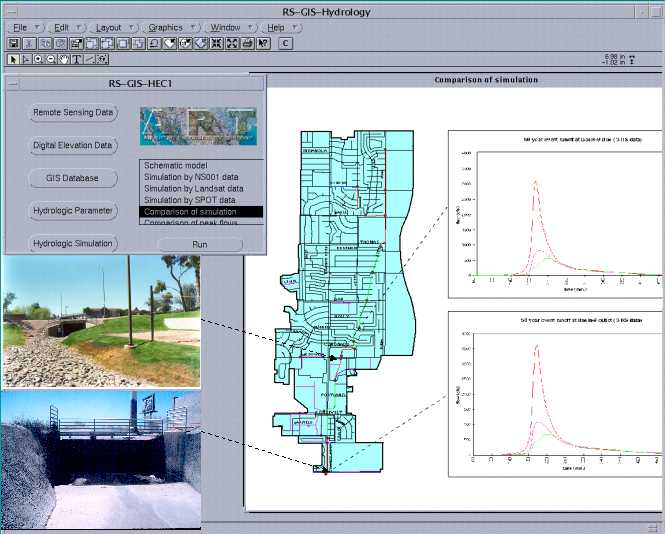
Figure 5. Comparison of Simulated 50 yr Event Storm Runoff
3.5 GIS in Supporting Design and Management
In order to support engineering design and resource management, a set of GIS functions was developed in this research. One of them is a channel cross-section view or a profile view along a specified line in the basin, which could be easily displayed by a click-and-draw interface, shown in Figure 6. Another example of the integration is the multimedia data have been incorporated into a geo-referenced database to support the design and management, it shows the detail field photos at the critical sites.
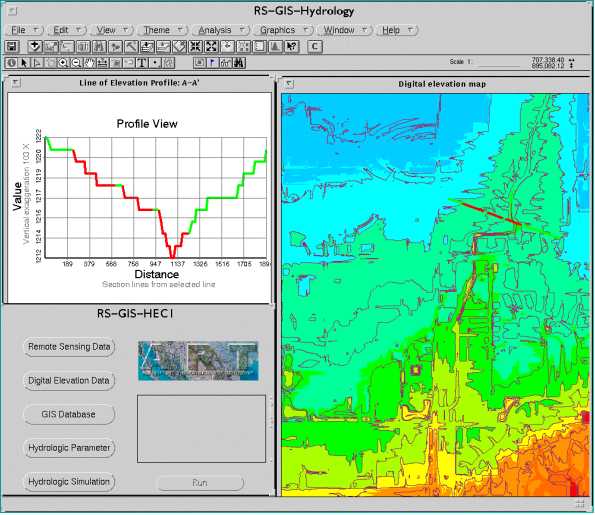
Figure 6. A Profile View by "Click-and-Draw"
4. Summary and Discussions
The integration of RS and GIS with hydrological simulation has become increasingly important. RS technology provides hydrological modeling with a fundamentally different data incorporating spatial and temporal information. GIS tool can play a central role in these integration. It is very powerful to organize, process, and visualize the spatial data from multiple sources in multiple scales. GIS can be used to retrieve and display multi-dimensional data to support engineering design and resource management. GIS parameterization makes hydrological models more effective and more efficient. An integration framework was discussed in this paper, the approach is based on the coupling of existing RS and GIS tools with a hydrologic simulation package. The advantage is that all the software packages are well-tested and agency-recognized, thus, the computational results are considered reliable. The disadvantage might be the complexity of the data exchange and the necessity of developing an information management system to handle it. An attempt was made to implement the integration of RS and GIS with hydrologic simulation, the results show an integrated system has a great potential for both research and application.
Acknowledgements
The work was partially supported by NASA Grant NAG5-4256 and City of Scottsdale, AZ.
Reference
:Baungartner M, Schultz G. A. and Johnson A. I. (1997), Remote Sensing and GIS for Design and Operation of Water Resources Systems, IAHS Press, Institute of Hydrology, Wallingford, Oxfordshire, UK
Goodchild M. F. (1996), the application of advanced tecnology in assessing environmental impacts, In Application of GIS to the Modeling of Non-point Source Pollutants in the Vadose Zone edited by D. L. Corwin and K. Loague, Soil Science Society of America: 1-17,
Hellweger F. L. and Maidment D. R. (1999), Definition and connection of hydrologic elements uing geographic data, Journal of Hydraulogic Engineering 4: 10 - 18
HEC-1 Flood Hydrograph package: User's Manual (1990), US Army Corps of Engineers, Hydrologic Engineering Center, 609 Second Street, Davis, CA 95616
Mitas L. and Mitasoca H. (1998), Distributed soil erosion simulation for effective erosion prevention. Water Resources Research 34: 505 - 16
Shih S. F., (1996) "Integration of Remote Sensing and GIS for Hydrologic Studies", Chapter 2 of Geographical Information Systems in Hydrology, edited by Singh V. P. and Fiorentino M., Kluwer Academic, 15-42
Shultz G. A. (1997), Use of remote sensing data in a GIS environment for water resources management, in Remote Sensing and GIS for Design and Operation of Water Resources Systems, edited by Baungartner M, Schultz G. A. and Johnson A. I., IAHS Press, Institute of Hydrology, Wallingford, Oxfordshire, UK
Zhang, Xiaohui et al (1999), Integration of remote sensing and GIS with urban stormwater management, The 2nd International Conference on Multiple Objective Decision Support systems for Land, Water & Environmental Management, Brisbane, Queensland, Australia, Aug. 1 - 6, 1999, Preceding in Press
Zhang, Xiaohui, (1997) Integration of A Stochastic Space-time Rainfall Model and Distributed Hydrologic Simulation with GIS, Ph.D. Dissertation, University of Arizona, Tucson, AZ, USA