Ahmed Soliman
Developing a GIS-based Zoning Management System
ABSTRACT
The City of Indianapolis Department of Metropolitan Development (City) is responsible for land use regulations within Marion County. Every year, the zoning staff faces the challenge of processing a large number of rezoning petitions submitted by citizens. Planners working under the supervision of the zoning administrator are responsible for the data entry of rezoning boundaries. They are also assigned the responsibility of conducting research on zoning history, providing information to the public, and producing detailed zoning maps to reflect zoning changes as they take place. With such a dynamic process, it is essential to integrate GIS tools in the decision-making process to enable the City to handle spatial data efficiently and with minimal training. As part of Convergent Group’s commitment to manage and support GIS applications for the City, we developed a multi-facet zoning management system to reengineer the data flow process. The system consists of eight primary modules. The first module is a Coordinate Geometry (COGO)-based application, developed in ARC/INFO AML, to support data entry for rezoning legal boundaries. Five modules were developed in ArcView GIS to provide staff with tools for data viewing, data management and update, analysis, reports, and map production. A data entry module for rezoning records was developed in Visual Basic to maintain rezoning records. Finally, a MapObjects IMS application was developed to serve live zoning data over the Internet, accompanied with an online zoning ordinance and property information system.
Introduction
This paper describes the process for re-engineering and automating the zoning process for the City. The main objective of the project is to migrate the process to a single, integrated system in which new rezoning boundaries will be entered instantly into the system, and associated case records will be maintained in a client/server environment and integrated with the spatial data component. Additionally, the countywide zoning data layer will be updated with new rezoning areas, once they are approved. To achieve this goal, Convergent Group software engineers formed a team with the City to accomplish project tasks.
Workflow Re-engineering
To gain full understanding of the current zoning process, the project team conducted several interviews with the zoning staff to document the current workflow. This process included an inventory of current data sets, software tools, and paper documents. Based on the workflow analysis, and an assessment of the current system, a new workflow was proposed to re-engineer the current process. Using the new workflow, the zoning staff will integrate a suite of software tools throughout different stages of the process.
System Specification
Based on user feedback, the project team documented a detailed functional requirements specification for the development and deployment of the system.
Hardware Requirements
UNIX server: UNIX 4.0D, running SDE 3.0 and Oracle 7.3.4 for future migration to SDE
LAN server: Novell 4x
GIS server: NT 4.0, running ARC/INFO 7.2.1
PC specifications: Pentium II 300 MHz, 64 MB RAM, 4 GB hard drive, 4 MB video RAM,
24x CD-ROM, and 17" monitor
Operating system: Windows 95 and Windows NT 4.0
HP 755CM ink jet plotter, 72 MB RAM
HP laser color printer
HP ScanJet 600 dpi color scanner
Casio QV-10 LCD digital camera
Software
The following is a list of proposed software products for the development and deployment of the zoning project:
Data Conversion
Zoning spatial data was maintained as a set of 200 AutoCAD base-map tiles. Each drawing (tile) contained a set of base-map layers, in addition to the zoning layer. Using a set of LISP routines and AML scripts, all tiles were standardized, edge-matched, and separated by layers to constitute a countywide zoning coverage in the ARC/INFO format. Rezoning case records, used to record petition information, were standardized and converted to Oracle.
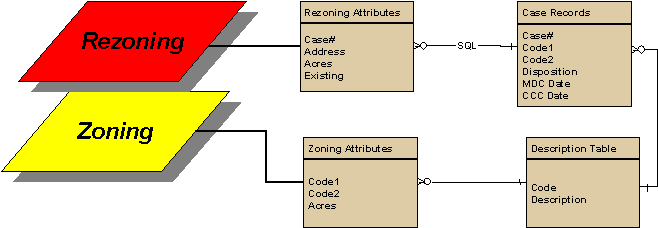
Conceptual Data Model
The zoning data set consists of a zoning layer to reflect up-to-date zoning information, and a rezoning layer to serve as a repository for zoning history data. Approved rezoning boundaries are transferred into the countywide zoning. The rezoning layer contains spatial information, such as address, acreage, and previous zoning. Rezoning spatial attributes are linked to the case records external table using a many-to-one relationship. The external table contains rezoning case records, and will be updated and maintained using the Table Editor module. The GIS interface will retrieve the external table through an SQL connection.
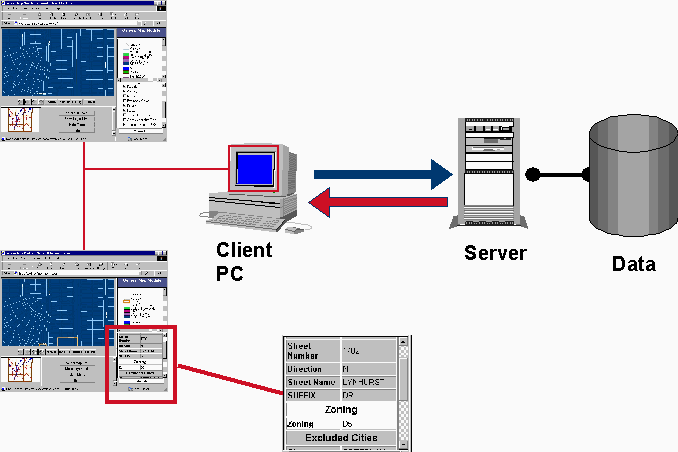
Software Architecture
The Zoning Management System (ZMS) was designed in a modular approach to ensure that interfaces are simple and user-friendly. This approach provides the developer with flexibility in design and ease of maintenance. In coordination with the reengineering of the permitting process, the GIS interface will integrate the zoning process with the permitting and document imaging systems.
The system interface will consist of a number of software modules, and will expand across multiple software platforms to support needed functionality. The following figure illustrates the overall software architecture for the ZMS, including other modules outside the scope of this application.
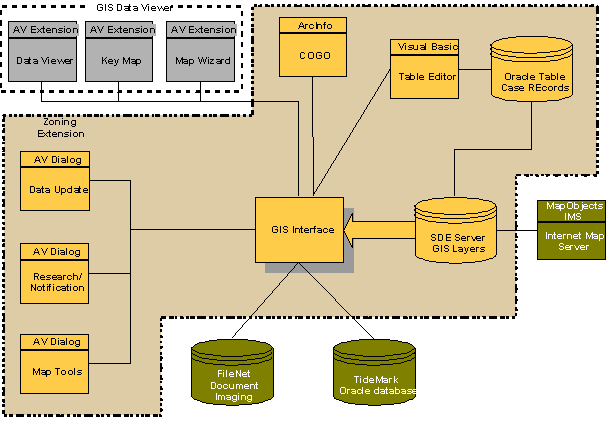
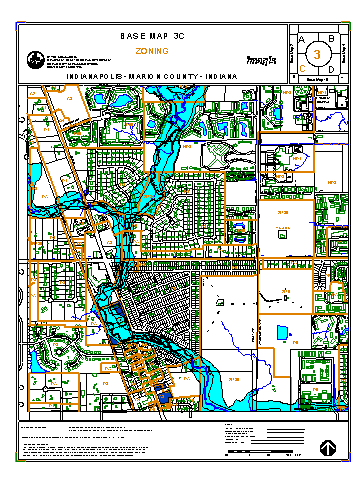
Zoning Management System Interface
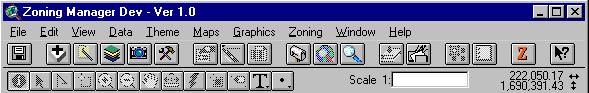
The ZMS is designed to provide users with tools to automate data entry, maintenance and updating for the rezoning process. It also contains functions to support data query, zoning research, online ordinances retrieval, and map production. The ZMS consists of the following primary software modules:
Software Design
Application Interface
The main application interface consists of a customized ArcView Graphic User Interface (GUI). The application interface contains a number of integrated extensions to provide the end user with seamless access to general data retrieval tools as well as to zoning management functions.
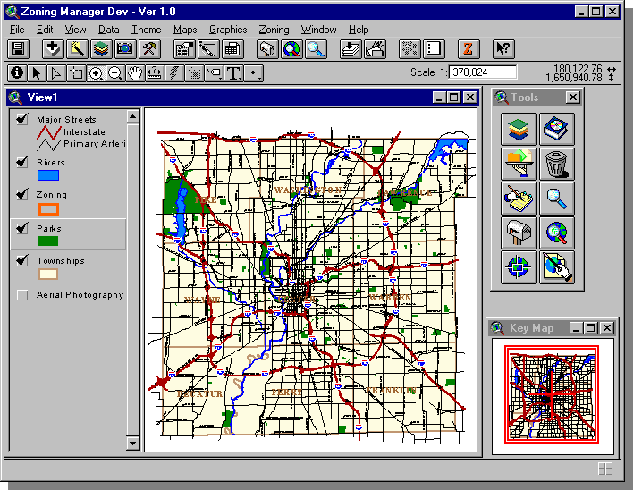
Data Access Tools (Data Viewer)
Combines common functionality in one extension to support the following: display of spatial layers, geocoding, search and queries, and simple map production. It provides the user with a customizable data access menu to view selected spatial layers. It also enables the user to store preferences for layer groups, display thresholds, geographic extent, and menu interface preferences. This application was developed using ArcView’s Avenue scripting language and Dialog Designer to create visual forms.
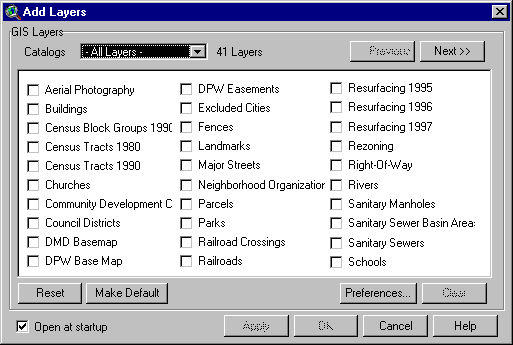
The Add Layers menu in the Data Viewer provides the user with a customizable data access interface. Groups of data layers are defined as catalogs. Catalogs are stored in an external ODB object that resides locally on the user’s PC. The catalog stores the following information for each layer: layer name, file source (path to data file), legend, display threshold, and a Boolean object to determine if a layer is selected by default. Once the user selects a catalog from the drop-down list, the application will populate a list box with a list of layers in the current dialog. Users can specify a default catalog to load automatically once the Add Layers menu is opened. Also, users can modify, delete, or create new catalogs using a special dialog to edit catalogs. This end-user level of customization provides more flexibility and efficiency for users to customize and manage their work environment.
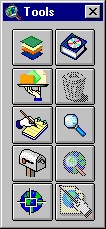
The Tools Box provides users with instant access to various functions in the application. The same set of functions on the tool box are also available in a pull-down menu.
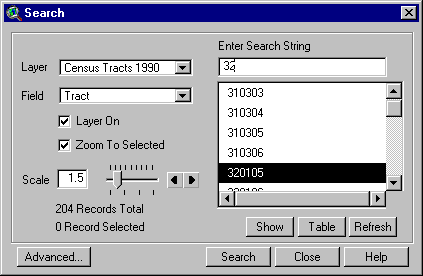
The search dialog enables the user to perform context sensitive search. It will display a list of values based on a searches string entered by the user. Also, at the user’s discretion, it will allow zooming to the selected feature using a user-specified scale ratio. This function does not require the user to enter database expressions to execute a query.
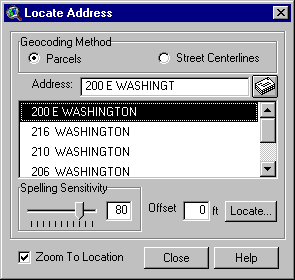
The Locate Address dialog enables point and range address matching. Once the user enters an address, it will display a list of matching candidates to select from. Users can control address-matching accuracy using a spelling sensitivity scale bar and an input box for offset distance.
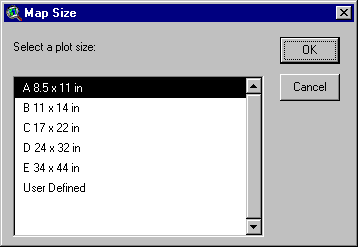
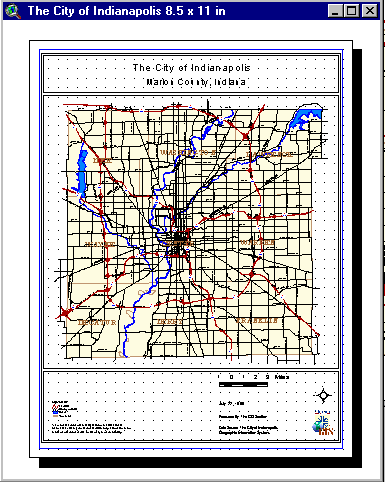
In addition to data access tools, a Map Wizard was developed to allow for custom map production. It enables the user to specify map size, orientation, and layout information. Based on the user’s input, it will automatically create a map layout and generate map cartography. System update scripts constantly adjusts the scale bar to legible units based on the map view display scale.
|
|
|
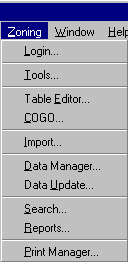
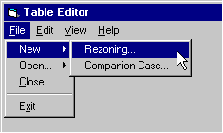
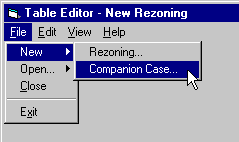
Table Editor:
The Table Editor enables zoning staff to enter new rezoning cases into the Oracle database as soon as they are filed at the front desk. The Table Editor application enforces a number of data validation rules to ensure proper data entry into the system. The Table Editor is linked to the GIS interface, and can be launched whenever users need to add a new record or edit an existing record. The GIS interface notifies the user of new rezoning cases filed, so staff can take the proper action.
This application supports multi-user editing in a client/server environment. A record accessed by the user will be locked from editing by other users until the user completes and saves the current record. The Table Editor will be launched from a separate icon on the Windows desktop or from the ArcView GIS interface. This module consists of a menu bar and four panels representing four data entry forms. Each panel contains a set of grouped functionality.
![]()
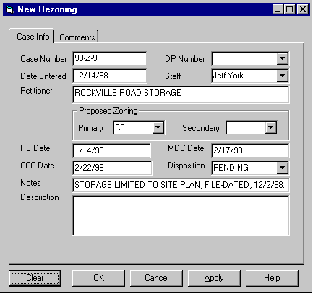
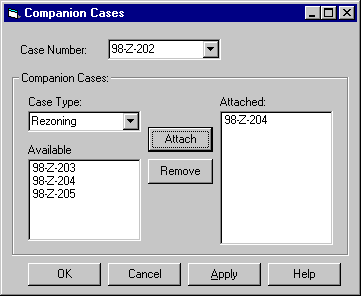
Additional functions in the Table Editor enable the user to relate records from different tables to maintain a relational database for rezoning case records. Users can build many-to-one relationships between rezoning records and other types of petitions filed by the same petitioner at the same time. This function helps zoning staff to handle land use petitions more efficiently.
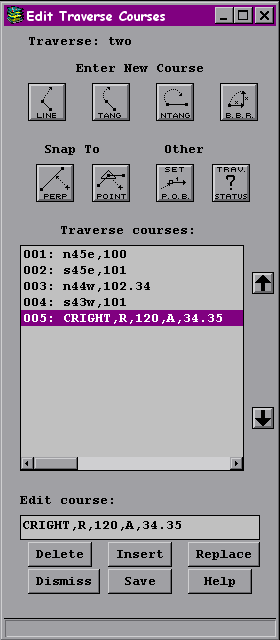
COGO Editor:
The COGO Editor was built using ARC/INFO AML. It provides users with a set of COGO tools to enter rezoning boundaries using legal descriptions. It also includes tools to adjust graphic features and to check accuracy and closure for legal boundaries. In addition to data entry functions, it contains query tools and data retrieval tools to load necessary background layers to support data entry.
![]()
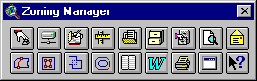
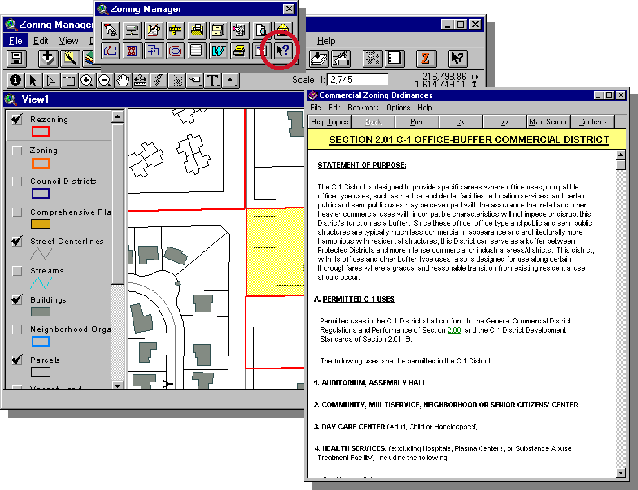
Zoning Management Tools:
Zoning specific functions are grouped in one pull-down menu to enable the user to easily find desired functions. Also, a floating toolbox provides instant access to the application functionality. A pop-up menu enables the user to easily interact with spatial features in the map display.
|
Zoning Manager Menu Bar Floating Tool box Pop-up menu |
Pull Down Menu |
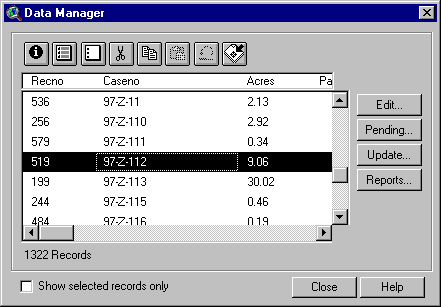
Data Manager
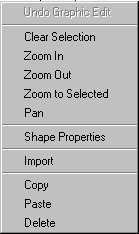
A data management dialog provides the user with a set of spatial editing tools to maintain rezoning data. The end user can interact with features on the map display or records in the dialog’s list box. Using the zoom function, the user can locate a feature (e.g., rezoning case) instantly by zooming to a selected record in the list. Using editing buttons, the user can delete, copy, and paste geographic features and associated attributes into the rezoning layer. An undo function enables the user to restore a feature if a case is deleted by mistake.
Using the View pop-up menu, the user can copy a selected feature from another layer to use as a rezoning legal description. The paste function in the pop-up menu or the Data Manager dialog will enable the user to paste the feature from memory into the rezoning layer. A list box will prompt the user to assign a case number to the rezoning case. This will ensure a link between the geographic feature and the corresponding record in the Oracle table.
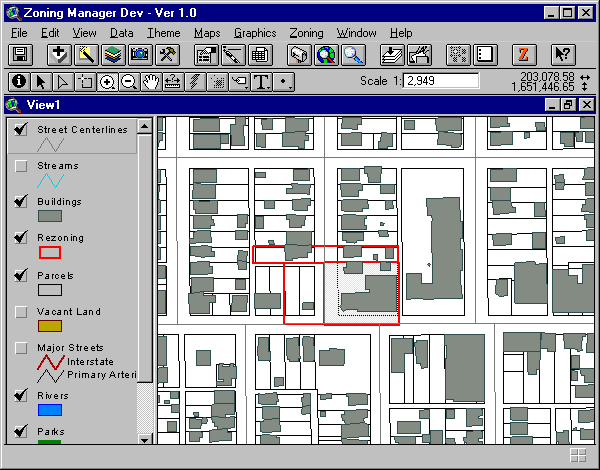
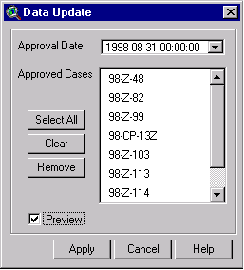
Data Update
The Data Update tool enables the user to update the countywide zoning map with new zoning cases that were recently approved. A built-in query function will select all approved cases based on a Council approval date selected by the user. When the user executes the update function, the application will process each selected case and insert the rezoning case into the zoning layer.
The application will zoom to each selected case so that the user can monitor the update process.
Each case will clip overlapping zoning lines, replacing them with new rezoning boundaries.
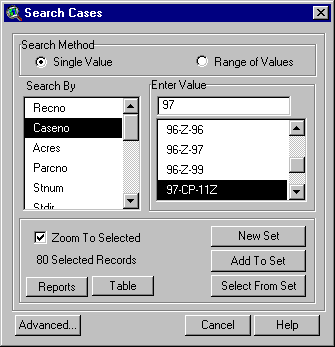
Search and Analysis
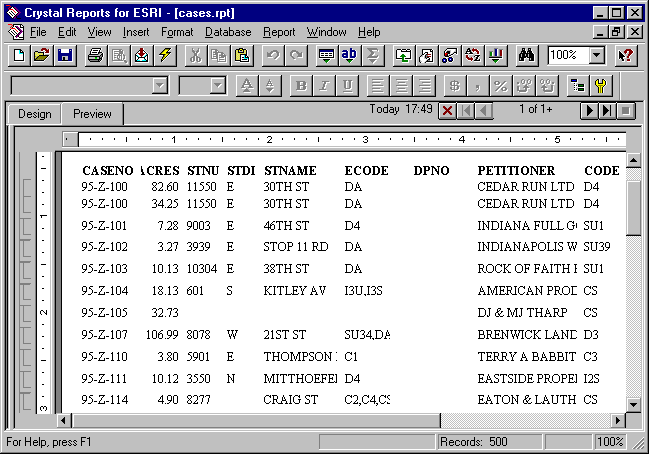
The Search Cases function alleviates the need for building query expressions. Users can query rezoning data by selecting values from a list. Users can search on a single value or on a range of values. They can also zoom to the selected feature, if the Zoom To Selected option was checked. Upon execution of the query, the user can display the attribute table with selected records promoted at the top, or can create a report for query result.
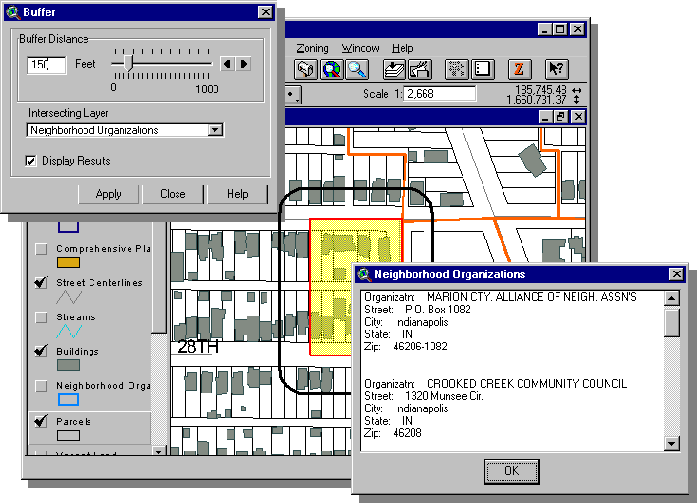
The Buffer function creates a buffer around a selected rezoning polygon. The buffer will intersect with features in the active theme. If the user selects to display results, the application will display attributes for intersecting features in a message box.
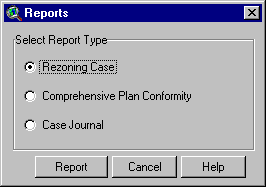
The Reports function provides the users with the option to select from three types of reports. Users can create a report for a subset of selected rezoning records, or for all records in none were selected.
The online Zoning Ordinance function provides zoning staff with instant access to the ordinance related to a specific rezoned site. Using this tool, the user clicks on the site, and it displays the ordinance section related to the specific zoning classification of the sites that are proposed for rezoning.
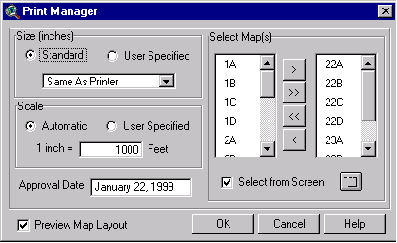
Map Production
Output maps are an essential product of the Zoning Management system. The Print Manager module presents a user-friendly interface to quickly create custom zoning maps. The user selects one or more map sections to be printed, and the application will process each tile individually, creating a custom layout with the necessary information for each base map. The user can choose to preview each map before printing, or can process a batch of maps all at once. Also, the user can terminate the printing process at any time.
Internet Map Server
The public demand for zoning information made this application a priority. The first phase of GIS-Internet applications is a general map viewer using Esri’s Internet Starter Application. The user can submit requests to the server using a standard Web browser. Users can select layers to view, change map display, or request attributes on features in a specific location. The Internet server will process the request, retrieve the information from the database server, and submit the data to the client PC in the form of HTML pages and JPEG images. The user can review the results on the Web browser, then initiate another request.
Acknowledgments
Thanks to the following individuals for their major contribution in application development and overall project tasks:
Roger Carribine
Dominick Cisson
Kathy Jackley
Fei-Chi Tuang
Author Information
Ahmed Soliman
Software Engineer
Convergent Group
6200 S Syracuse Way, Suite 200
Englewood, CO 80111
http://www.convergentgroup.com
(303) 741-8400 Phone
(303) 741-8401 Fax
Ahmed.Soliman@cvg-grp.com