USING GIS FOR SNOW PLOW ROUTING
AND FACILITIES LOCATION
Abstract
GIS has been effectively used for snowplow routing and facilities location analysis in four counties and a state DOT district. Variations in speed, number of lanes, number of plows per route, cycle times, and plowing priorities are examples of the complexities that had to be dealt with. Objectives were to effectively allocate plows to garages, close or combine several garages, or build a new garage. In all cases, GIS was effective in finding alternatives that made the system more efficient. For the DOT in Minnesota, a potential savings of about $500,000 per year was the result of an alternative.
Introduction
Facilities Location and Snow Plow Routing can range from a very simple use of Arc/Info's ALLOCATE commands, to a very complex process using ROUTE and development of an extensive database that reflects plowing times and delay factors. This paper describes the range of complexity by providing examples from two counties and a state DOT. People have tried to develop a "canned" routing process, but as the parameters get more extensive, routing and allocation becomes a customized approach, using GIS tools as an aid. It is not a simplistic one or two step "canned" process.
The objective of this analysis is determine a way to get the plowing done in a minimum amount of time with the least amount of resources. To get the roads plowed quickly, a county could have many garage facilities distributed across the jurisdiction. But facilities cost money, and have to be maintained and supervised. In contrast, one large garage in the center of a jurisdiction would be efficient from a management and operation and maintenance perspective. However, some plows would be deadheading for miles before they get to the beginning of their route, which is not only inefficient, but adds to the response time. Determining the number of and best locations for garage facilities is a balancing act.
Modeling is done by evaluating the existing system of routes and the related statistics, such as total plowing time and deadhead time. The statistics about the existing system form the basis for evaluating proposed changes to the system. The existing system is also evaluated regarding how well it is currently meeting the guidelines for response time that may have been set by the jurisdiction.
Alternatives include re-assigning plows from one garage to another, changing plowing service areas, and moving, eliminating or combining garages. Evaluating alternatives is based on whether response time is improved, or efficiencies are achieved by closing a garage.
Definitions
Several terms need to be defined before modeling can begin. These definitions may vary by jurisdiction, but here are some examples of the terms and definitions. Additional terms will be defined later in this paper.
"Average" snow fall: 2-3 inches of snow that has fallen and it has stopped falling before plowing begins.
"First pass" - the effort needed to open the through lanes of traffic. Does not include shoulders, turn lanes, rest areas, frontage roads, etc.
"Deadheading" - time to travel from the garage to the beginning of a route or between discontinuous portions of a route. Often this is travel over a road that is assigned to another plow.
Modeling is done for the "first pass" for an "average" snow fall.
1. Simple Location Analysis
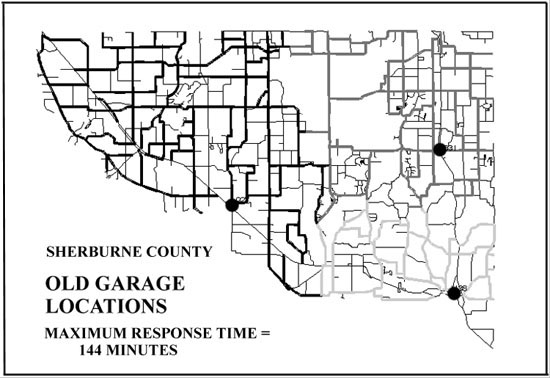
A very simple location analysis was done for Sherburne County, Minnesota, using only the ALLOCATE module of ArcInfo. The county plows only county roads and has only three garages, with a possible fourth one being proposed. A constant speed of 35 miles per hour was used. Intersection clearing time was set at 5 minutes for all. Garage capacity was set at an equal amount of 1500 minutes for each. The criteria used to evaluate the routes was the degree to which the garages handled an equal amount of plowing, and the maximum response time to the farthest point served by the garage. Deadheading was not specifically measured and taken into consideration. This analysis showed that the County did not need a fourth garage. It could reduce the maximum response time from 144 minutes to 103 minutes by moving two of its garages to better locations. The one garage on the west side of the county was over capacity, and obsolete, and needed to be replaced anyway. With the new set of three garages, the plowing demand was also more evenly distributed, and the garages could be about the same size. Although deadheading was not measured in this project, deadheading out of the old western garage was substantial. Under the new scheme, deadheading would be greatly reduced.
2. More Complex Analysis
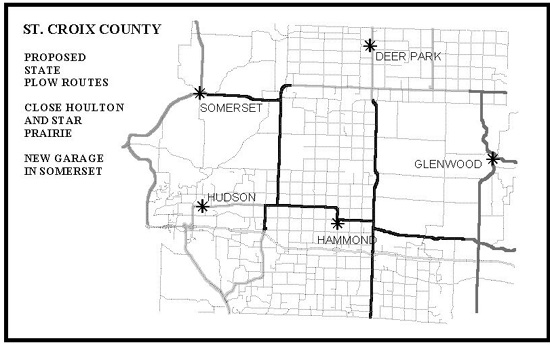
St. Croix County, Wisconsin plows the interstate, state, county and township roads. However, each type is treated as a separate system so that accounting for salt and sand usage can be precisely done, and Townships could be billed based on plow time. The county is provided funding from the state to plow the interstate and state roads. Therefore, separate models were needed for the interstate, state and county systems. Since efficiency in plowing the township roads was not an objective, no modeling was done for the townships. Delays for intersections, stop signs and signals were included in the analysis. Intersection clearing responsibilities varied by the type of route. (State plow routes only clear intersections with other state highways. County routes clear intersections with state and other county highways.) Since three systems had to be modeled separately, the most difficulty was in evaluating facility location changes. A facility location change could benefit the state routes but not the county routes, or vice-versa. Maximum response time also varied by type of system. Interstate routes were to be cleared within 2 hours, county roads within 2.5 hours and state routes within 3 hours. The longer response time for state roads is due to the amount of funding the state provides.
The maps show the existing county and state plow routes. There are six garages. Under the
existing system, about 11.5 lane miles of county roads are not being plowed within the two hour
maximum route time. For the state roads, about 6 miles are not being plowed within the 2.5 hour
route time.
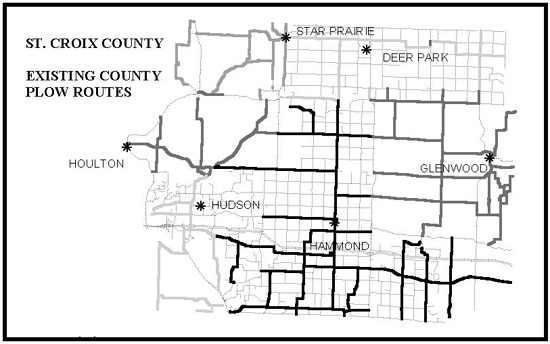
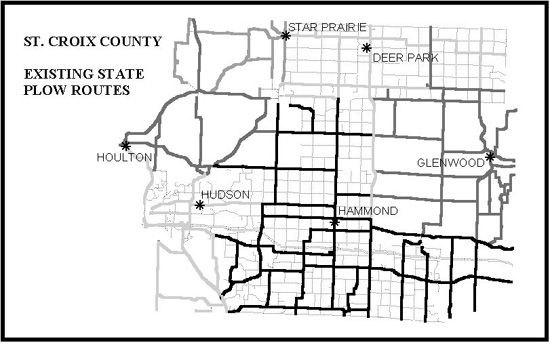
Many alternatives were studied, but a major proposal was to close the garages at Houlton and
Star Prairie, and build a new one in Somerset. Under this alternative, all of the county roads are
plowed within 2 hours, and all but a short segment of state road is plowed within 2.5 hours.
A project for MnDOT District 1 and the Arrowhead Regional Development Commission (ARDC) was a very difficult one. The impetus came from the MnDOT district manager, out of a concern for the future and being able to "do more with less".
The database was built by using MnDOT's ROUTE file created with Workstation ARCIINFO. Each route in the state system is given a GIS_HWY ID. The route database is capable of linking data from a database based in GIS_HWY ID and route reference point. The database items used in this project came from the TIS system. Many variables were included in the database, including the number of lanes, surface type surface width, shoulder width, AADT, etc. It was later found in the study that many of these items were not needed because we were only modeling the "first pass . The number of through lanes proved to be the most important item. In addition to the TIS data, we added ramps, stop signs, signals, bridges and railroad crossings. Rest areas, crossovers, and weigh stations were also added, but were unnecessary to model the "first pass".
This district has 60 routes and 20 Truck Stations. Some routes have 2 or 3 plows on them to
plow the multi-lane highways. The routes have differing cycle times, unlike all of the other snow
plowing projects we have completed to date. The district has cycle time priorities depending on
the type of route:
Super Commuter - 72 minutes (most of the freeway in downtown Duluth)
Urban Commuter 90 minutes( Interstate 35 and surrounding! the cities)
Rural Commuter - 126 minutes
Primary - 240 minutes
Secondary - 300 minutes
As in St. Croix County, deadheading was taken into consideration. In some places, there was a
considerable amount of deadheading. The maps illustrate deadheading on two routes in Duluth.
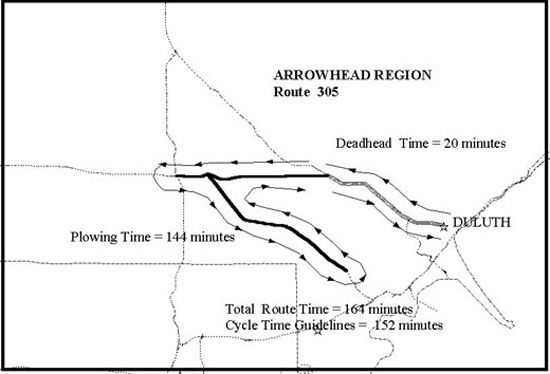
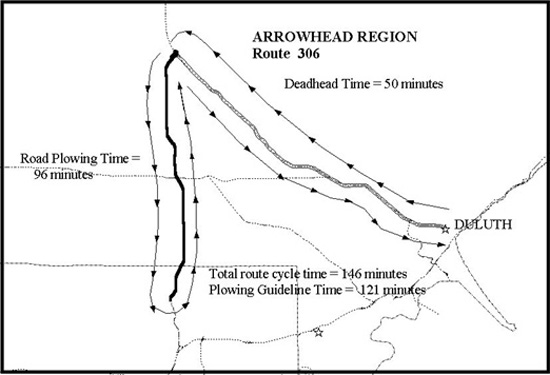
The deadheading on route 306 applies to two trucks, so the total "wasted" time due to deadheading is 100 minutes.
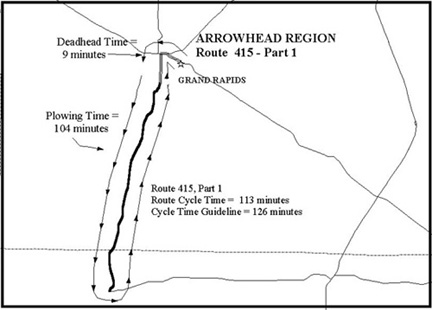
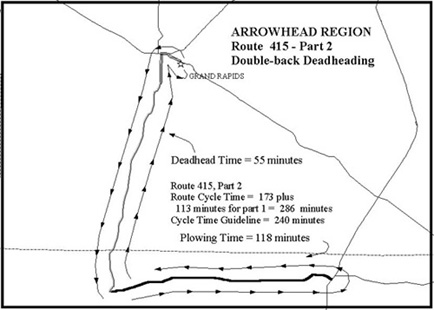
However, a new type of deadheading emerges from the analysis as well, as illustrated below.On
some routes, plows do the higher priority section of route first, then return to the garage for more
salt and sand. Then they "double-back" over road they have already plowed, to continue to plow
the lower priority route. The following illustrates this on Route 415 out of Grand Rapids.
A major obstacle in this project was that MnDOT had a difficult time obtaining the appropriate route times and speeds from some of its route supervisors. This information is essential to determine the efficiency of the existing system. For example, one route has 28 lane miles and three trucks The plow speed was reported to be 20 miles per hour, and the route time to be 120 minuter. The three trucks each have about 5 minutes of deadhead time. Using the 28 lane miles, divided by three trucks, the total route cycle time comes out to be 67 minutes, not 120. These types of situations existed for about half of the routes, involving 7 of the 20 truck stations. The problem seems to have been a lack of trust by the route supervisors as to how the information was to be used. Indeed, an objective of the study was to determine ways to cut back on plowing resources. After about a year of trying to get better information, it was decided to simply use the speeds provided by MnDOT, and calculate the route times accordingly.
The next challenge was to determine how well the routes were meeting the plowing cycle time guidelines set by the Slate. Since routes often passed through several different cycle classifications, two things needed to be determined:
- How long should a route take to complete under the guidelines?
- Was the route meeting the guidelines for every segment?
In all of the other projects we have done so far, the route cycle times have been uniform, but in this case, each one has its own time determined by the plowing cycle priorities. The time the route should take was determined by calculating the percentage of lane miles in each class, and then multiplying the proportion times the guideline time. For example, a 90 lane mile route with 45 lane miles of Primary and 45 lane miles of Secondary was calculated as follows:
The only way to determine whether the route was being plowed within the cycle rime guidelines was to trace it along its actual path and accumulate the plowing time. The cumulated plowing times for each segment could then he compared to the guideline for that segment to determine whether the guideline was being met. The cumulative times also included deadheading hack to the garage in the middle of a route to reload with salt and sand, plus the time to reload.
By comparing the time a route should take to the cumulated cycle time, the routes that are over capacity or under capacity were determined. This information was summarized by garage. For example, the garage in Virginia, had 390 minutes of excess plowing capacity. This is the equivalent of 3 or 4 plows. Grand Rapids had a deficit of 287 minutes. This information gave an indication as to how plows might be re-allocated among the garages.
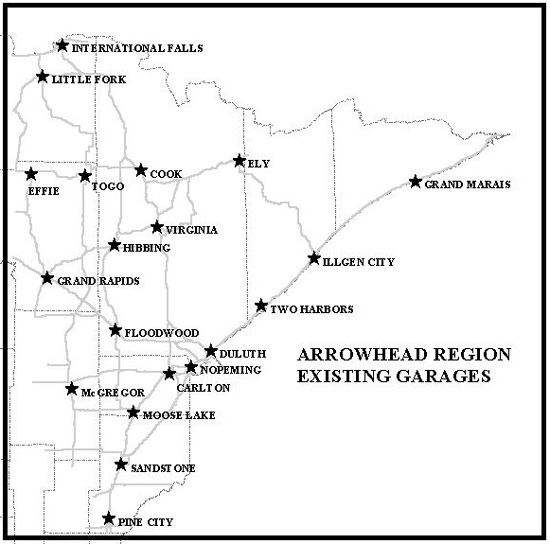
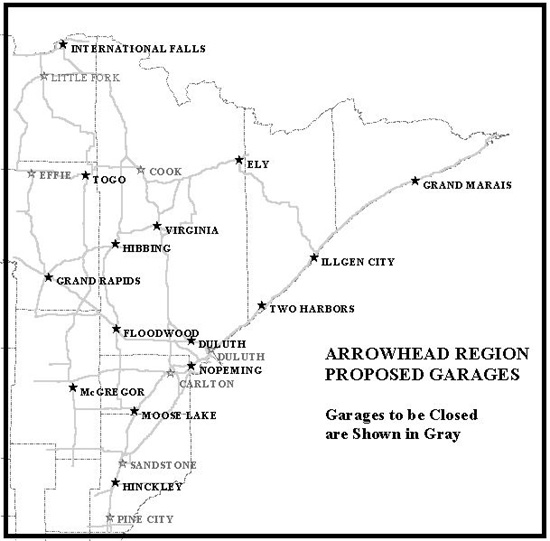
One of the recommendations of the study was the possibility to close eight garages, and build
three new ones. This would mean operating with 15 garages instead of 20, saving on operation
and maintenance expenses. The analysis also showed how state cycle time guidelines could be
met with these 15 garages and the same number of plows. This was done by re-arranging the
routes, and moving plows from areas where there was excess capacity to garages with a deficit of
capacity.
Re-arranging the routes, taking into consideration meeting cycle time guidelines, and unavoidable deadheading was a complex task. Arc/Info's ROUTE tools helped considerably in tracing the probable route a plow would have to take to meet, but not exceed, the cycle time guidelines. Since a route can involve sections with different cycle time guidelines, in some cases, it involved dividing it into sub-parts, and adding in "double-back deadheading" time to meet the guidelines. The cumulative impedances and deadheading for each portion of a route were then again cumulated for the entire route. For each segment along the route, the cumulative impedance could not exceed the cycle time guideline for that segment's type of route. I
f the state were simply to add plows to the existing system, so that cycle time guidelines were met, they would need 12 plows and at least 12 drivers. Garages would have to be enlarged to accommodate the new plows. The annual cost would be about $662,000. If the proposal were implemented to cut back to 15 garages, re-allocate plows, and adjust the routes, the annual cost would be $82,000. This would be primarily to build the new garages, and expand garages where plows have been re-allocated. As a result, the overall cost savings would be about $580,000 per year.
.Summary and Recommendations for Others
Snow plow routing analysis and facility location analysis is not easy. If the entity has differing road types and policies, then the simple ALLOCATE model is not sufficient. It is okay for determining the overall patterns to determine allocations to facility locations. But if a route has situations in which a plow must "double back" to reload or to meet performance time guidelines, ROUTE must be used to model each individual route.
ALLOCATE is good for determining the effectiveness of different possible facility locations, but to determine whether it is actually feasible for routes to originate from them with a minimum of deadheading and coming close to the cycle time guidelines, ROUTE must also be used.
Another recommendation would be to keep the road attribute database as simple as possible. The key data items needed are: length, number of lanes, lane miles, major delay factors, and plow speed. Cycle time priorities and guidelines are also needed. Delay factors include reloading, intersection clearing, and traffic signals. Other delay factors may be important depending on the individual situation. When modeling existing routes, one must capture the actual path taken by the plow driver, including deadheading and "double-back deadheading". Adding superfluous attributes to the database only detracts from the modeling process, which is complicated enough as it is.
The last recommendation is perhaps the most important. Participation and commitment of the route supervisors is also essential. In all of the counties, we worked closely with the route supervisors. This gave them confidence that our simulations of their routes was as close as possible to reality. In projects where that direct contact did not occur modeling was very difficult. Snow plow route modeling and facility location analysis is facilitated by GIS tools, but the human input to the process is essential.
Author Information
Dr. Linda K. Tomaselli
GISRDC
6300 Barrie Rd., #2B
Edina, MN 55435
1-877-221-6684 (toll free)
1-603-994-4786 (fax)
GISRDC@excite.com (email)