Tracking Technical and Non-technical losses in Electric Systems Using GIS
In the postwar period Electricity of Lebanon (EDL) was facing the consequences
of the war that extended over approximately 17 years. EDL was simply
lagging behind in terms of information technology and resources.
Geographic Information Systems Electricity of Lebanon (GISEL) was the project
EDL looked for to help overcome existing problems in the company.
One main problem EDL was facing was collection management. This included
the following: Not being able to track collections on the ground.
Not being able to trace the link between customers and the electric network.
Not having the means to track or improve the work of collectors on the
ground and thus improve revenues. No means to detect illegal power
tapping. No means to query customers for specific electrical information.
No means to track the flow of electricity from transmission level (substations)
to distribution level (customers). In brief the challenge was to
reduce technical and non-technical losses to acceptable international standards,
which currently are abnormally high.
1. Introduction
The Collection Management was one of the applications implemented in project GISEL (Geographic Information Systems Electricity of Lebanon). GISEL project is implemented for EDL (Electricity of Lebanon). It is divided into several phases, 3 of which are already implemented and the rest are still going on. The design of the project was implemented jointly by both Khatib & Alami and Esri. In addition to that, work was done also with Miner and Miner to implement ArcFM in the project. The GISEL project includes 10 applications, AdHoc, ArcFM, Collection Management, Facility Siting, Maintenance, Map Products, Power Flow Fault Analysis, Switching, Trouble Call, and Work order.
What is the purpose behind the Collection Management? .a specific target, to provide EDL with the tools for collection, monitoring and management and consequently reduce the non-technical losses.
To best identify these tools, an Energy model that best represente reality
had to be constructed as well as we had to identify our data sources in
addition to doing some surveys on the ground.
2. Energy Model and Data Sources/Surveys
An energy model that traced the flow of energy from the generation level (factory) to the customer level was established (Appendix 1). The Model showed the flow of electricity from the Generation level passing by the substation then by the MT/BT (Medium Voltage/Low Voltage transformers, an MT/BT could contain more than one such transformers) finally reaching the customers. The model also identified all the technical and non-technical losses on these levels. This helped us related the energy on the different levels as well as isolate the non-technical losses in order to be able to compute their corresponding values.
In addition to this several surveys were done. These surveys helped
update existing maps data such as street names, street numbers, impasse
numbers, building numbers, coffret Numbers, Main Entrance information.,
they also helped update electrical lines attribute information and spatial
information such as which lines are connected to which customers.
In addition to that the surveys helped collect some MT/BT information,
which were needed by some of the functionalities.
3. Collection Management Functionalities
In this section we will pass over the CM functionalities and describe the function of each.
3.1 Tournee
The Tournee (or collection route) is the path the collector passes
on when he is getting the meter readings and collecting money from customers.
In order to facilitate the work of the collector and better monitor the
Tournee information, we set the Tournee to be a group of MT/BTs;
where the Tournee would contain the customers related to these MT/BTs.
To Manage these Tournees several functionalities were added, such as the ability to add a new Tournee, open an existing Tournee, save a Tournee, close a Tournee, initialize (remove all MT/BTs form this Tournee) and delete a Tournee.
Tournee Management View
3.1 UDE Loss
Under this section there are two functionalities which are based on
the energy model. These functionalities will help us identify the
UDE (Undefined distributed Energy) Losses on two levels.
3.1.A UDE MT/BT losses
This functionality compares the Energy reading of the transformer level
to the sum of customer readings on this transformer.
UDE MT/BT loss output
The chart above is the output of this functionality. The whole
chart represents the energy reading on the transformer level. According
to our model this transformer energy reading is made up of the sum of 5
sub levels. Energy Billed not Collected is the energy that has bills
related to it but these bills are not collected yet. Energy Collected,
is the energy whose corresponding bills are already collected. Technical
Energy Losses corresponds to the technical losses on the network between
the medium voltage transformer and the customer. Energy Waved corresponds
to the amount of energy that the customers are exempted from paying for.
And finally, the UDE corresponds to the remaining amount of energy.
By using this functionality we will be able to track which transformers have a large UDE value and thus a crew needs to go on the ground and check them for possible illegal tapping.
If you click on the chart you will get information about the values and percentages of each of the chart components.
Another functionality based on this one was created where by if you
choose it a pie chart will be generated for every MT/BT and displayed as
a label next to it. This will help managers identify possible problem
areas without clicking on each MT/BT by itself.
3.1.B UDE Feeder Losses
This functionality is similar to that of the UDE MT/BT Losses but instead
it will compare the reading on the feeder level to the sum of customer
meter reading related to this feeder.
3.2 Collection
Two functionalities fall under this section
3.2.A: Uncollected Bills
In this Functionality the user is prompted with a list of tournee numbers.
The user chooses one and then is prompted with the sum (money) of uncollected
bills for this tournee and its equivalent amount of energy.
3.2.B: Collected Vs. Uncollected bills
When this functionality is chosen a pie chart will be displayed as
a label for each MT/BT representing 2 values, The amount of collected money
and the amount of non-collected money.
3.3 Consumption
3.3.A: Genre AND 3.3.B: Tarif both answer direct queries
about some customer information. The user will choose what type of information
he wants form a list box displayed as soon as Genre or Tarif is chosen.
3.3.C: Reglage du Disjoncteur
After clicking on a specific MT/BT the user chooses "mono" or "tri"
and consequently customers with one phase or three phase electric subscription
are chosen.
3.3.D: Energy per Sector
The user here is able to query any sector for energy information.
This information can be any of energy consumed, energy billed, energy collected,
energy waved, energy billed not collected, undefined distributed energy,
and technical energy losses.
(Description of each can be found in appendix 1)
3.3.E: Variation
Variation will track customers whose consumption value has decreased
a certain percentage value from last period to this period. The user
chooses an MT/BT an all customers whose consumption has decreased less
than a certain percentage threshold value will be highlighted and their
corresponding buildings will be selected and highlighted.
3.3.F: Zeroe Meters
Will show us those customers whose consumption values for this period
is zero. The user clicks on an MT/BT and customers with zero consumption
for this period are selected and their buildings highlighted
3.4 Disconnection
Disconnection will help us query customers whose subscription is active,
those whose cut was asked by EDL, customers whose cut was asked by them,
those whose meter is removed and those whose counter is destroyed.
These queries can be done on different levels. Such levels would
include Beirut, Cadastral area, Sector, Feeder level, MT/BT level, and
can be done also for a single customer.
3.5 Temporary Meters
Temporary meters are those meters that are placed for temporary reasons,
such as a construction. These meters should be removed when the reason
is gone. This is a tool that monitors these meters and can identify
their time of existence.
3.6 Other Functionalities
Other than the functionalities found in the menus there are tools and
buttons which call other general functions. Below are these functions:
Appendix 1
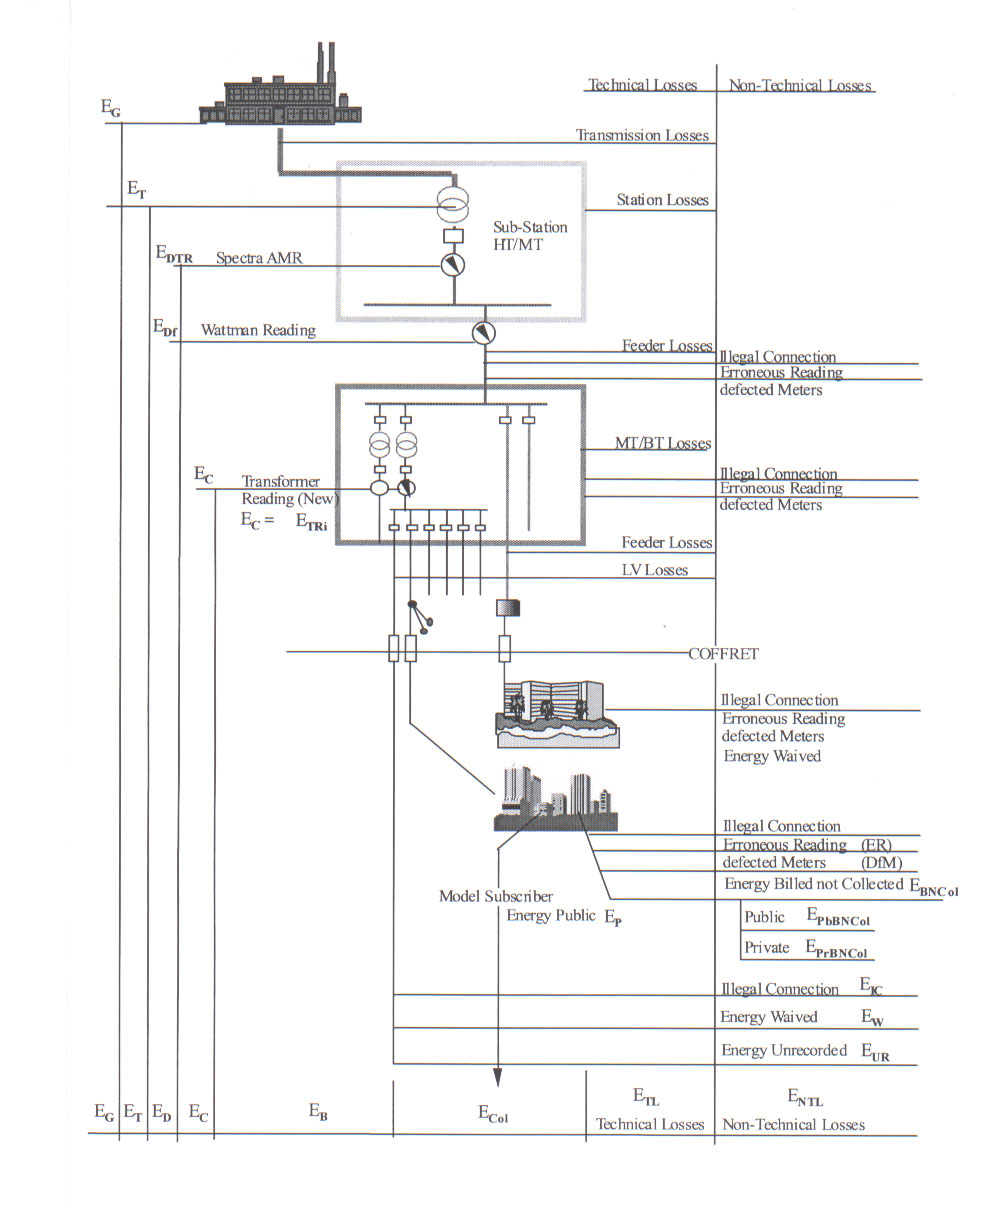
Energy Road Map from Generation to Collection
Energy Formulae:
Ec = Ecol + Etl+Entl
Entl = Ebncol + Ew + Eude
Eude = Eic + Eer + Edfm + Eur
Eb = Ecol + Ebncol
Ew = Erc - Eb
Terminology:
| Term | Reads | Definition |
| Ec | Energy consumed | Energy consumed, measured as the total energy expanded at the output bus(ses) of the transformer(s) of an MT/BT, for a whole billing cycle - Meter readers or curve estimations |
| Eb | Energy billed | Energy for which bills are issued in every billing cycle |
| Ecol | Energy Collected | Energy corresponding to the money effectively collected for a given billing cycle |
| Etl | Technical Losses | Technical losses in the circuitry starting at the output bus of MT/BT and finishing with the customer for a whole billing cycle |
| Entl | Non-Technical Losses | Energy lost for reasons other than technical losses for a whole billing cycle:Ebncol + Ew + Eic + Eer + Edfm + Eur |
| Ebncol | Energy billed but not collected | Energy corresponding to bills that were issued but not collected by the end of the billing cycle |
| Ew | Energy Waved | Energy the collection of which is waved |
| Eude | Undefined Distributed Energy | Non technical losses excluding waived and billed but not collected: Eic + Eer + Edfm+ Eur |
| Eic | Illegal Connections | Energy expanded through illegal connections in a billing cycle |
| Eer | Erroneous Reading | Energy consumed but not noted due to human reading errors (coincidental or purposeful) |
| Edfm | Defected Meters | Energy consumed but not noted due to defected meters |
| Eur | Unrecorded Energy | Other energy consumed but not recorded |
| Erc | Recorded Consumed Energy | Energy consumed as recorded in the consumer file |
Computation of "a" and other related terms:
A = Eb/Ec
= Eb/(3*T*LF*pf*(?(Pfi*Vi*Imi) for every transformer
i)
Terminology:
| Term | Reads | Definition |
| Index a | Index a | Index a = Eb/Ec is a per unit billed value (similar to a percentage) |
| Index 1-a | Index 1-a | Index 1-a = 1 -Eb/Ec is a per unit loss value (similar to a percentage). Loss = (Etl + Entl)/Ec |
| T | Billing Period | 24Hours * 61 days (considering a period = 2 month) |
| Pf | Power Factor | Power factor = 0.85 |
| Lf | Load Factor | Load Factor = User Input (defaulted to 0.6) |
| Pfi | Peak Factor | Peak Factor per transformer i |
| Vi | Phase Voltage | Phase Voltage per transformer i |
| Imi | Average Transformer Current | Average Transformer Current |
| Name | Tony Wakim |
| Title | Tracking Technical and Non-Technical losses in Electric Systems Using GIS |
| Organization | Khatib & Alami |
| Address | Cornish El Mazraa, Beirut, Lebanon |
| Tel | 961-1-300609/818861 |
| Fax | 961-1-603301 |
| twakim@gisel.kacec.com.lb | |
| tonyhwakim@hotmail.com |