Lifesaving Choices:
Developing a Comprehensive Critical Facility Geo-Spatial Database for Regional Emergency Management
By Eric J. Householder
South Florida Water Management District
ABSTRACT
The South Florida Water Management District has developed a Critical Facility Geographic Information System (GIS) database for use in the Districtĺs Emergency Operations Center (EOC). The database contains such crucial geographic data as shelters, hospitals and fire stations for the sixteen counties within the District. The project team overcame numerous obstacles including, establishing contacts with regional and local agencies, obtaining data in various formats, datums and projections, and processing the data into ARC/INFO coverages with a consistent format. With the completed database in place, District EOC GIS staff can use ArcView to quickly map critical facilities and provide valuable information to emergency managers.
OVERVIEW OF THE SOUTH FLORIDA WATER MANAGEMENT DISTRICT
The South Florida Water Management District is the largest of the five Florida Water Management Districts and is headquartered in West Palm Beach, Florida. The South Florida Water Management District is a regional agency organized along hydrologic boundaries rather than political lines. Its authority is delegated through the Florida Legislature and is considered a special taxing District with the authority to collect ad valorem (property) taxes from landowners within the sixteen counties within its boundaries. Regulatory programs, long-range planning surface water restoration ecosystem restoration, land acquisition and water resource education programs are just some of the ways District protect Florida's natural water systems.
PROJECT BOUNDARIES
The project area is comprised of all or part of the sixteen counties that make up the South Florida Water Management District (Figure 1). These counties include: Broward, Charlottee, Collier, Dade, Glades, Hendry, Highlands, Lee, Martin, Monroe, Okeechobee, Orange, Oscela, Palm Beach, Polk and St. Lucie.
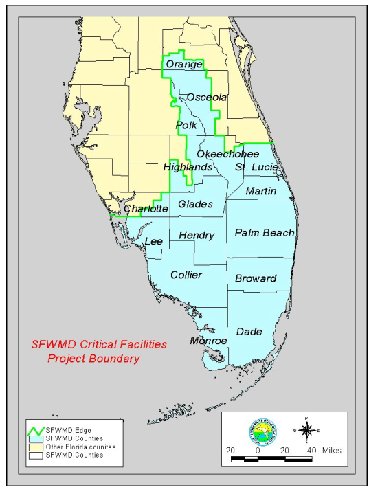 Figure 1: Project Boundaries
HISTORY AND MISSION OF THE EMERGENCY OPERATION CENTER
The Districtĺs Emergency Management program was established in 1992, in accordance with recommendations following Hurricane Andrew. Organizationally, it is located within the Executive Office and is the focal point for all District emergency management policies and procedures. The District is a member of the State Emergency Response Team (SERT) and may be requested to respond to non-District emergencies within District boundaries, or emergencies that occur outside District boundaries
The mission of the Districtĺs Emergency Management program is to prevent or minimize, prepare for, respond to and recover from emergencies or disasters that threaten life or property within the boundaries of the South Florida Water Management District. These activities ensure that the District can accomplish its mission during adverse conditions. The District also works closely with, and offers support to local and state emergency managers: To prepare for and assist with manmade hazards, dam failures, nuclear power plant failures, fires, storms and a number of other types of emergencies within Florida.
METHODOLOGY
The objective of this project was to create a GIS Critical Facility geospatial database for use in the Districtĺs Emergency Operation Center (EOC). The SFWMD EOC staff members have repeatedly identified critical facilities data as an important data layer that should be developed and added to the EOC/GIS. The project team, composed of GIS personal from various parts of the District obtained, evaluated and processed both state and local datasets to create ARC/INFO Critical Facilities coverages for all sixteen counties within the District (Figure 2).
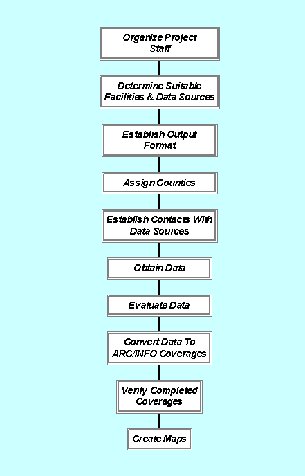 Figure 2: Project Steps
GIS Software used for the Project was ARC/INFO and ArcView, both from Environmental Systems Resource Institute Inc.(Esri). The primary data for the project consisted of ArcView shapefiles from the State of Florida Division of Emergency Management, ARC/INFO coverages, ArcView shapefiles, Critical Facility address text files and GPS coordinates from individual county planning and county emergency management departments.
CHOOSING THE APPROPRIATE CRITICAL FACILITIES
The first task for the project team was to establish what critical facilities were appropriate for the database. Based on prioritized needs and data expected to be readily available, the project team identified the following types of critical facilities to be mapped during the project: Emergency Operation Centers, Police/Sheriff Stations, Fire/EMS Stations, Hospitals/Emergency Rooms, Shelters and Mobile Homes Parks. Though not technically a critical facility, mobile home parks were included due to their potential of blocking canals and waterways with debris following a major storm event.
It was decided that ARC/INFO Coverages would be the standard data format due to wide spread availability at the District along with the softwareĺs flexibility with handling various data formats. The output Datum, Projection, Item, Sequence, Definition, and brief description of items in the coverage Point Attribute Tables (PATs) are as follows.
Datum: NAD83
Projection: Stateplane Florida East
ITEM DEFINITION DESCRIPTION
Facility 45 45 C Facility name
Address 50 50 C Facility address
City 25 25 C City name
Zip 5 5 I 5-digit
Function 30 30 C Facility type
Contact 25 25 C Person or Agency (if available)
Phone 12 12 C Area code, exchange and number: xxx-xxx-xxxx
Latitude 8 12 F4 Derived from coverage
Longitude 8 12 F4 Derived from coverage
County 12 12 C County name
Symbol 2 2 I Symbol number from Crit-Facs markset
Source 50 50 C Source of the data for the coverage
OBTAINING CRITICAL FACILITY DATA
With the coverage output format in place, possible data sources were then identified. From past experience and knowledge of existing datasets, the project staff identified both state and county level contacts to obtain the Critical Facility data. These sources included, the State Division of Emergency Management and individual county governments including both planning and emergency management departments. Minor data sources included the state's Regional Planning Councils and the American Red Cross
Once the data sources were identified, the project staff was each assigned individual counties based on their knowledge and experience with those specific counties. To ensure the major counties were ready by the peak of hurricane season, the counties were prioritized based on location, population, and potential impact. Within individual county assignments, coastal counties were completed first, followed by counties around Lake Okeechobee, and then all remaining interior counties.
Data was obtained by contacting each agency and department that could provide a Critical Facility dataset for the particular county. The Florida Division of Emergency Management was contacted first and provided ArcView shapefiles that contained critical facility locations along with attributes for each county within the District (Figure 3).
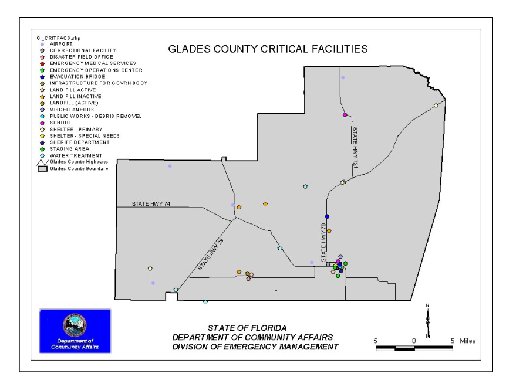 Figure 3: Glades County State Emergency Management Shapefile
Individual counties were contacted next to obtain both county planning and county emergency management data. It was found that many of the counties, especially the smaller ones, used one dataset for both planning and emergency management purposes. However, larger counties had numerous datasets that were maintained separately by the individual county departments, some with little to no coordination. In these situations, all datasets were requested for evaluation by project staff. All county departments were informed that the preferred format was ARC/INFO coverages (Figure 4) but shapefiles, textfiles, hardcopy addresses (Figure 5) and GPS coordinates would also be accepted.
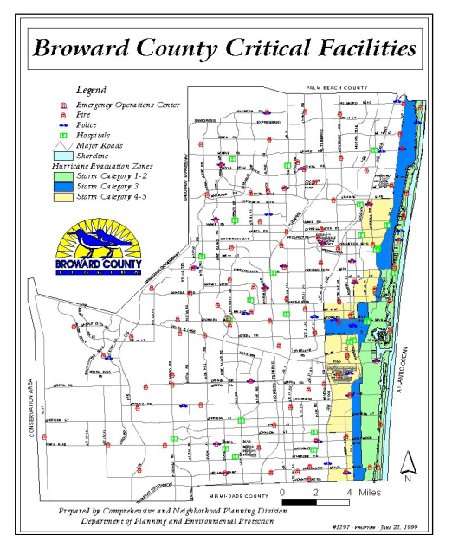 Figure 4: Broward County ARC/INFO Coverages
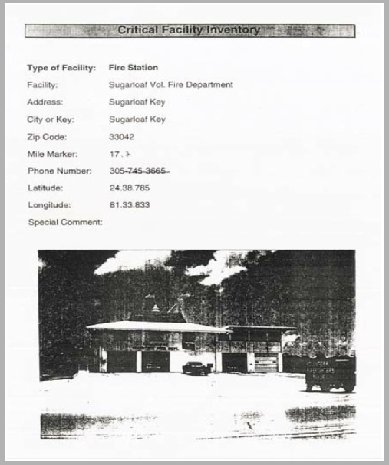
Figure 5: Monroe County Critical Facility Inventory
Numerous obstacles were encountered during the data acquisition phase of the project. It was discovered that while many counties have full GIS capability with dedicated staff, many were in the beginning phase or possessed little to no GIS capability. In several cases repeated requests had to be made to individual county departments to obtain data which often took weeks or months to receive, often without any metadata. Staff also discovered that many of the datasets received were in a different projection or datum and had to be converted before the data could be evaluated. If the dataset obtained was either in a coverage or shapefile format, it was be evaluated immediately depending on its projection and datum. If the county department could only provide critical facility GPS coordinates, the coordinates were brought into ArcView as a table and converted to a shapefile. If facility addresses or mobile home park listings were provided, the text file was brought into ArcView as a table and geocoded using the county DynaMap coverage. The resulting shapefiles were then evaluated along with the other county datasets (Figure 6).
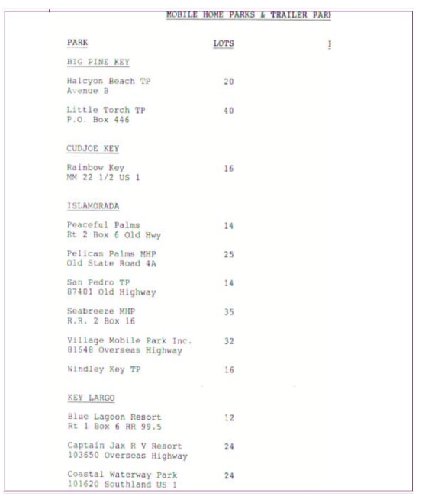 Figure 6: Monroe County Mobile Home Park List
DATA EVALUATION FOR SPATIAL ACCURACY
Once the data was in a usable format, the data was evaluated for spatial accuracy using several data layers that project staff had access to at the District (Figure 7). ETAK street coverages for each county were used to verify spatial accuracy while Dynamap street coverages was used for address-matching. Digital Ortho Quarter Quads (DOQQ) with a ground resolution of six meters were also utilized for the later half of the project. The staffĺs personal knowledge of each county also proved valuable in this phase. Knowing the address or precise location of a particular police or fire station often helped staff members evaluate the data much faster. Once the evaluation was complete, the datasets that were determined to be the most spatially accurate were selected to create the final Critical Facility coverage.
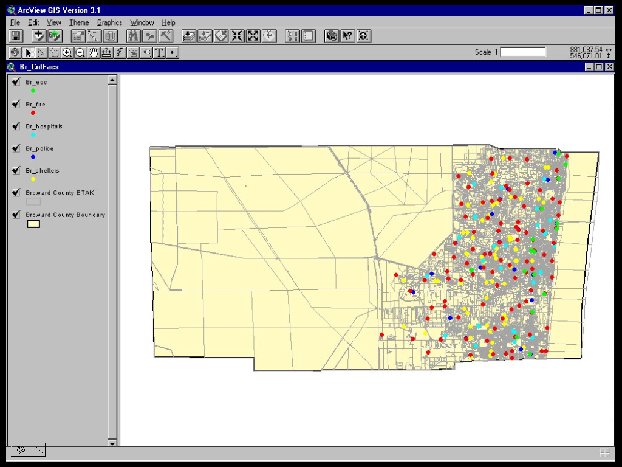 Figure 7: Evaluation of the Broward County Coverages
CONVERTING THE DATA TO COVERAGES
Once the dataset was evaluated and proven to be correct, it went through the process of becoming the final ARC/INFO coverage. If data obtained from a county was already a coverage and had been evaluated, the proper items were added to the coverageĺs PAT and then calculated from the attributes found in the original coverage. If the dataset was in the shapefile format and was created from either GPS coordinates or a geocoded facility address file, it was converted to a coverage using the shapearc command in ARC/INFO and the proper PAT Items added and calculated. If a particular county dataset was split out into several individual coverages, the facilities were merged together into one using the "Put" command in ARC/INFO.
FINAL COVERAGE VERIFICATION
With the final coverages complete, each was verified using the methods performed in the Evaluation Phase of the project (Figure 8). The final verified coverages were then placed in a new centralized directory called ECOVS (Emergency Coverages) to be utilized by GIS EOC staff in the Districtĺs emergency operation center.
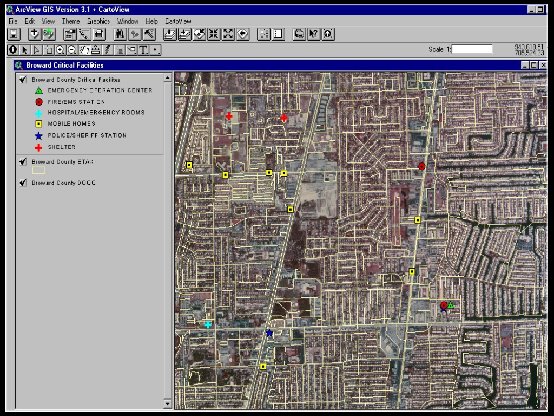 Figure 8: Broward County Coverage Verification
APPLICATIONS
With the new coverages in place GIS EOC staff can quickly call up these covereges in ArcView and identify (Figure 9) or map facilities based on the ôFunctionö item in the PAT (Figure 10). Individual Critical Facility types such as shelters can also be selected from the set and mapped independently. The database can also be incorporated with an application called StormVison. This application was recently developed by Tim Scharff in an on going effort to anticipate the direction of a storm and the effects on District property and personnel.
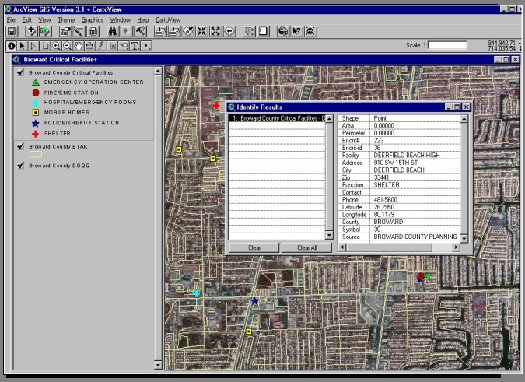 Figure 9: Identifying Individual Critical Facilities
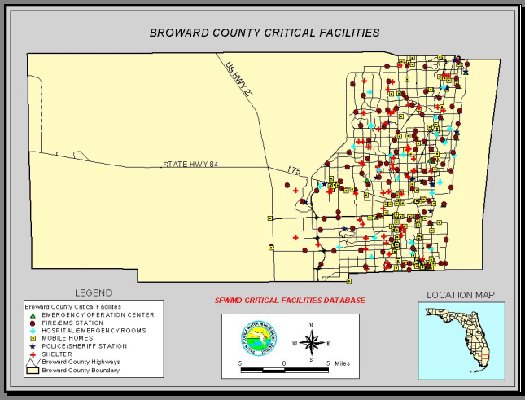 Figure 10: SFWMD Broward County Critical Facility Map
StormVison generates, displays, and maps realistic storm shapes based on wind field quadrant information found in the National Hurricane Centers (NHC) marine hurricane and tropical storm advisory. Using this information, District emergency managers can make informed decisions as to when, how and where they are going to deploy resources.
The Critical Facility database was first used on the morning of September 24, 1998. The South Florida Water Management District activated its Emergency Operations Center because hurricane Georges was approaching south Florida. During the storm, the District GIS unit overlaid the generated storm shapes on top of the Districtĺs critical facilities and other selected layers (Figure 11). This overlay function gave emergency managers the ability to see, hours ahead of time what Critical Facilities would possibly be affected by hurricane and tropical storm force winds along with the approximate time and duration of these winds. By using the StormVision application along with the Critical Facility coverages, GIS staff prepared maps that depicted potential hurricane impact areas within the District.
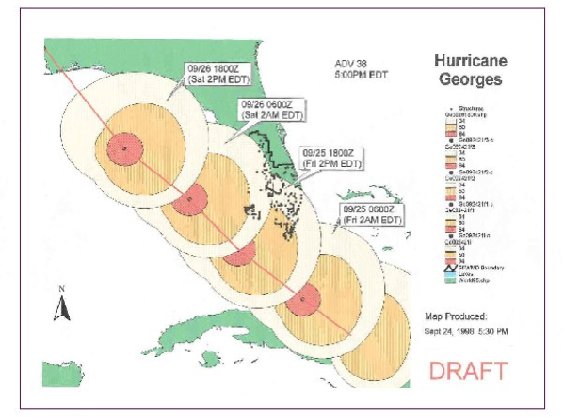 Figure 11: The StormVision Hurricane Modeling and Tracking Application
CONCLUSION
The objective of the project was to create a Critical Facility Geo-spatial Database for use in the South Florida Water Managementĺs Emergency Operation Center. The project staff overcame numerous hurdles to build the first of its kind GIS Critical Facility database that can be used by both the District and individual counties. While the database is a good start, more work needs to be done to make it an effective tool. Due to the nature of this type of database, it can not be left static. With the rapid growth of South Florida, constant updating of the spatial and attribute data is crucial for the database to be an effective resource to emergency managers.
Eric J. Householder
South Florida Water Management District
3301 Gun Club Road, West Palm Beach Fl.
561-682-6582
ehouseh@sfwmd.gov