ABSTRACT The Champaign-Urbana Mass Transit District (CUMTD) operates a small but efficient bus system, serving the University of Illinois and the surrounding communities. CUMTD received the award for America's Best Little Transit System in 1986 and 1994 by the American Transit Associations.
Currently, in addition to schedule booklets, CUMTD provides bus schedules through the World Wide Web (WWW). While users find schedules conveniently there, the task of selecting the best route is not an easy or convenient one, particularly when transfers are involved. Once riders have selected the destination, they must search the schedule to find which routes are the best for their trips. It becomes not a difficult, but a cumbersome task to coordinate their time with that of the bus schedules, particularly when transfers become necessary.
The purpose of this paper is to present a bus Information System (BIS) for CUMTD which an interactive and easy-to-use WWW-based application. BIS will provide users with the shortest travel path transfer once enter origin destination. pertaining most efficient routes given destination nearest stop location schedule arrival time at estimated total be displayed both graphically in text format within second upon request.
To provide this service, we used the Dynamap 2000 by the Esri (data as of November of 1997) as the base map, which has been updated with current street and address data as of October 1998. BIS has been developed using MapObject, NetEngine and MapObject Internet Map Server, provided by Esri. Street networks and bus routes were constructed using ArcView and Arc/Info.
The Champaign-Urbana Mass Transit District (CU-MTD) offers its users route and schedule information through its schedule booklets, a web site, and a telephone service. These methods for conveying information have been suitable. However, new users sometimes have problems finding the appropriate route(s), travel time, and transfer points.
One problem includes the difficulty in finding desired locations (origin or destination) on the available route maps. The bus route maps usually include only the portion of the region’s road network that pertains to the particular route. However, accurately pinpointing one’s location in relation to the closest bus stop may require a complete road map of the region along with the route map. Another problem is the general difficulty of determining a suitable route using the information available. This problem then tends to be perpetuated when a transfer point (or points) is required. To mitigate all of these problems a Web-based Bus Information System (WBIS) has been developed.
A core focus in WBIS’s development has been the creation of a user-friendly system which allows for maximum accessibility by members of the Champaign-Urbana community. Therefore, availability of WBIS will not only be limited to stand-alone systems in key locations throughout the community (Libraries, Transit Centers, etc.). It has also been made available on the Internet. The Internet not only increases the accessibility to information, but can provide an interactive and user friendly interface through the World Wide Web (WWW).
The purpose of this paper is to present a WBIS designed for CUMTD. WBIS will provide information pertaining to the most efficient routes, the given origin and destination, the nearest bus stop, transfer location and schedule, the arrival time of a bus at the given origin, and the estimated total travel time. This information will be displayed both graphically and in text format within a second upon request.
The current interactive information system, run by CU-MTD, is their telephone service. Users are able to gain desired information regarding bus routes and schedules by speaking directly with telephone operators. First, the users provide the operators with their starting point (origin), where they want to go (destination), and what time they want to travel. The operators, using information available to them and personal knowledge, find the most suitable route and travel time for the caller.
In developing the structure of WBIS, we attempted to simulate the communication that takes place when the telephone service is utilized. Like telephone service interaction, the structure of WBIS has three components: input of users’ information, calculation of the shortest bus route, and display of the result. The interaction between WBIS and users takes place at the input and display components. Using Hypertext Makeup Language (HTML), the interface of these two components can be readily designed and made available on the WWW (Figure 1). Because the users do not need to see the calculation process, no interface was developed for this component.
Figure 1. Overall Structure of Web-based Bus Information System
Initially a prototype was developed, using ARC/INFO 7.1.2 and AML, as an attempt to test the overall structure of Bus Information System (BIS). The interface was designed through Graphical User Interface (GUI) provided by ARC/INFO and AML (Figure 2). The engine for finding the shortest path was developed through using the Network analysis component in ARC/INFO.
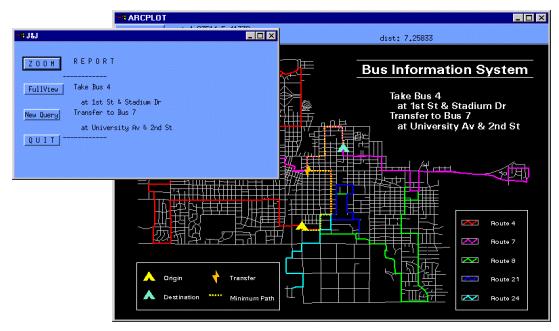
Figure 2. Prototype of Bus Information System – Result Display Windows
Even though the prototype operated successfully problems arose with the development tools. The development software could not satisfy the required capabilities of the final product. For example, the running time of the prototype was too slow to implement WBIS and computer resources were unnecessarily wasted. This occurred because ARC/INFO is a GIS software package containing all GIS related functions while the prototype utilized only a fraction of those functions. In addition, the ARC/INFO 7.1.2 version does not support WWW capabilities. Therefore, new methodology was needed.
3.2 Current WBISTo solve the problems faced with the prototype, MapObjects 1.2 and MapObjects Internet Map Server (IMS) 2.0 were used to develop WBIS. MapObjects has components containing the functions from large GIS software packages such as ARC/INFO or ArcView (Esri 1996). Therefore, developers can create customized mapping software by using necessary GIS functions from MapObjects. Likewise, MapObjects IMS contains components, which provide applications with Internet mapping capabilities (Esri 1998a).
Although MapObjects and MapObjects IMS solve the problems encountered by the prototype, integrated GIS software packages were still needed for manipulating geographic data. These included ARC/INFO 7.1.2 and ArcView 3.1.
Geographic data is used in WBIS for displaying and analyzing maps. Because MapObjects and MapObjects IMS were used in developing WBIS, the file format for geographic data follow the Shape file format by Esri.
A combination of geographic data, including the Champaign-Urbana street network, individual bus routes, a complete route network for the Champaign-Urbana area, bus stops, and landmarks, were used to complete the project. The following table provides the shape type for each map.
|
Maps |
Shape Type |
|
Champaign-Urbana street network |
Line |
|
Individual bus routes |
Line |
|
Route network |
Line |
|
Bus stops |
Point |
|
Landmarks |
Point |
Table 1. Shape Types of Maps used in WBIS
Purpose of maps
Base Street Network
The base street network provides the core geographic data for WBIS. It is used to create individual bus routes, display street map to users, and provide geocoding capabilities for data preparation and for operating WBIS.
Individual Routes and Route Network
Like the base network, individual route information allows specific routes to be displayed as needed by analysis results. Individual routes are also used to create the entire route network and allow for easy maintenance of the network if one route from the network requires alterations.
The route network is then used to recognize transfer points and to create the map of bus stops, which are street intersections on the travel path of routes. Initially NetEngine used the route network to find the shortest travel path. However, as programming progressed, NetEngine was no longer utilized and another method for recognizing the shortest travel path was implemented.
Bus Stops and Landmarks
By using the bus stop map, the location of the closest bus stop to the users’ specified location (origin and destination) can be pinpointed. In addition, these points are used to display for users the places where they would start and end their trip in relation to their selected origin and destination. The map of landmarks is not only utilized for displaying landmark locations, but also allows users to select their origin and destination location directly from the list of landmarks.
Data Source
Before using the data each geographic file and database had to be created and/or prepared.
Base Street Network
Although the Champaign-Urbana street network from Esri’s Dynamap 2000 was acquired in June of 1998, the data it contained was only current as of November of 1997. Due to the nature of this project and because the surrounding community has been experiencing rapid growth, it was essential to update this information to the current Champaign-Urbana street network. Thus the information has been updated with current street and address data as of October 1998.
Individual Bus Routes and Route Network
Shape files of individual routes in addition to the entire route network were essential to WBIS. To create these shape files, each bus route was digitized from the base road network and saved independently. Merging the individual routes into one shape file using an ArcView tool created the route network.
Bus Stops and Landmarks
Although the CU-MTD schedule book only lists times at specific points (time points) on the routes, the size of the Champaign-Urbana urbanized area allows the CU-MTD drivers to stop at any intersection along the bus routes. Therefore, intersection stops were extracted from the entire route network and on-street stops were digitized to create the bus stop shape file. To create the Landmark geographic file, an Excel database of landmarks (received from CU-MTD) was examined for up-to-date names and addresses of numerous landmarks throughout the Champaign-Urbana region. Landmark categories include College and University Buildings, Entertainment, Government Services, Hospitals and Clinics, Parks and Recreation Areas, Schools, Shopping, and Transportation Facilities. Using the addresses in the Excel database, the landmark shape file was created through address matching with addition location corrections made manually in the shape file.
Data Preparation Problems and Solutions
As the project progressed various obstacles and data problems presented themselves. The problems encountered and the degree to which a solution was necessary to continue with the project will be discussed below.
Base Street Network
In the initial stages of the project a base street network was required that would be the main data source from which other data and maps would be developed. The accuracy of this map and the information it offered was, therefore, essential. The primary problem faced with the base network was the outdated street network for the area. Although the Dynamap 2000 is updated regularly, more priority is given to regions in the US with substantial growth rates. And although Champaign-Urbana has experienced continuous growth, it is not a large enough metropolitan region to be considered a priority for annual updating. Thus, the map that was acquired did not include development that has taken place in the last five years. To update the street network missing streets and their respective address information were digitized and added to the existing map.
Figure 3. Address Range Problem
In addition to missing streets, the geocoded information provided on the map also created problems. First, address ranges and block information did not allow accurate address matching. We discovered that address ranges in some areas were offset by a few blocks. For instance, the 400 block of South State Street contained addresses in the 600 range. In addition, addresses range from 0 to 99 (100-199, 200-299, 300-399 etc.) making the assumption that there are 99 lots per block. Realistically, this is rarely the case and blocks may actually only have up to 20 – 30 lots with address ranges from 0 to 30. Therefore, when the program calls for address matching, the result of matching tends to be limited to one end of the block (Figure 3). Due to the scope of the project, corrections made to the acquired map were limited, as correcting all of the errors in the geocoding information of the base map was not possible. However, during manual digitization of missing streets, we entered respective address ranges as accurately as possible to minimize additional errors in address matching.
One area of the map that required full correction of address ranges was the boundary (Wright Street) between the Champaign and Urbana municipalities. It was discovered that the street’s addresses were all designated as Urbana addresses although the West side of Wright Street is within the Champaign municipality and thus lots on the West side have addresses in Champaign, while lots on the East side of Wright Street have addresses in Urbana. In addition, the axis at which block numbering and the North, South, East, and West prefix originates in Urbana is South of the axis in Champaign. Therefore, one block on Wright Street may be the South 100 block on the West side and the North 300 block on the East side of the street. To make needed corrections and assure accuracy, the entire North-South arterial was manually regeocoded.
The final problem encountered on the base street network dealt with zip codes and their boundaries. The map acquired did not have accurate boundaries for zip code areas and did not include all the existing zip codes in Champaign. With the address matching required in the program, accurate zip code information was essential. An address entered with a zip code that was not on the geocoded map would not be found because the zip code was not recognized. To correct this problem, we regeocoded the base network with city names instead of zip codes.
As the project progressed, we discovered that additional miscellaneous errors existed in the map. For instance, an area in Urbana was discovered that had addresses for Champaign. In addition, if street prefixes (North, South, East, and West) were not accurate, or address ranges were missing or incorrect, cases would come up where address matching would locate the desired point in two places. This was more of an issue with East-West streets traveling through both Champaign and Urbana. If encountered, these errors were corrected to represent the actual network information.
Individual Bus Routes
Unlike the base network, the problems encountered when creating the individual bus routes was not as extensive. The primary concern regarded the street network. The lines in the Dynamap used for the base map do not perfectly portray the existing street network. In some cases it was difficult to recognize which street or intersection a street segment on the map was representing. Again, it was not possible to make manual corrections in every case. Corrections were made in extreme cases that were recognized early enough to not create an exorbitant amount of backtracking in the project progression.
Cases also arose where bus routes travel through parking lots that are not represented on the base network map. In these cases, a segment was digitized to represent approximately where the route would travel. Information was also added to describe what the segment represented (i.e. Lot E14, Illinois Terminal Parking Lot, Market Place Mall Main Stop).
Route Network
We were concerned about retaining the ability to fix or alter bus routes as we created WBIS. As mentioned above, changes in the street network or routes could create backtracking or additional work in the preparation process of the project, as the route network map does not dynamically change with alterations to individual routes. Since there are a few areas or points in the Champaign-Urbana area which host numerous bus routes, alterations made to the street network will require redigitizing of each route traveling on any of the altered segments. In the life span of the project this is a primary concern, as the bus stop map and transfer data are developed from the route network map.
Stops
As mentioned earlier CU-MTD designates each intersection as a bus stop. However, time points on the routes are offered at a sparse number of stops or primary transfer points. Therefore, not only was there a lack of data for which intersections were stops, but there was no time (schedule) information for the stops between those provided in the schedule book as time points. To alleviate this problem digitizing of all stops was required. Initially all intersections on the base network were recognized as stops. Once the route network was completed, those stops not on any of the routes were removed from the shape file. What remained was the point shape file of intersections which were also considered bus stops. Additional on street stops were then added (digitized) to complete the bus stop map. Yet, although the stops were recognized, their descriptions needed to be entered. Users need an explanation or intersection name to locate a bus stop, because providing them with a number would just create confusion. Thus, intersection names (i.e. Green and Wright, Lincoln and Bradley) or location descriptions (i.e. on Market St. behind Barnes & Noble) were manually entered for respective bus stops to complete the bus stop map and database.
Landmarks
As mentioned above Landmarks throughout the community were offered as one method for users to select their desire origin or destination point. Therefore, it was essential that the final location of each landmark in the landmark database was accurate. To assure accuracy an initial inspection of addresses was made. Landmarks that had outdated information such as old or missing addresses were corrected. New landmarks were added to the database if they were seen to be significant origin or destination points but were not included in the original database. Correcting the database, however, did not correct all problems.
Due to the condition of the base network, an inspection of the locations of landmarks was required after they were address matched onto the base network. Problems encountered after inspection included landmarks located on the wrong end of a block, landmarks located 2 to 3 blocks from the actual location, two points designated as the same landmark, or landmarks that failed to be address matched (located). Manual manipulation of the landmark map corrected these errors.
4.2 CU-MTD Schedule DatabaseOne of the important elements in WBIS is the CU-MTD Schedule Database, developed in Microsoft Access. Its initial purpose was integrating the entire CU-MTD operations such as run-cutting, payroll management for bus drivers, and so on. The database contains information for the entire bus schedule, data of time-points, which are the bus stops provided in the schedule booklet, and descriptions of routes and time-points. In WBIS, this database is used for finding the shortest bus route and to provide schedule information to the users.
The schedule database is considered a relational database made up of multiple tables rather than a single flat table. These tables, however, are related to each other through the information they contain. To establish the relationship, a common item between the tables is needed. This item is called an identifier. The identifier links the tables together and can be used to search for information throughout the tables.
Three tables are contained in the CU-MTD Schedule Database. They are the schedule table, the bus route table, and the bus stop table. The schedule table contains the entire schedule for each trip of each route. The bus route table includes information related to routes such as route names, descriptions, and their availability during the week. And last, the bus stop table provides data related to bus stops, such as stop-ids, descriptions, and transfer possibilities. Figure 4 provides a flow chart describing the relationship between these three tables and highlights the identifiers between each table that allow for the relationship (link) to exist.
Figure 4. Relationships between Tables in CU-MTD Schedule Database
As shown, there are two relationships among the tables: one between the schedule table and the bus route table, and the other between the schedule table and the bus stop table. The identifier establishing the relationship between the bus route table and the schedule table is given as "route", which is the route name, while "stop-id" is the identifier that establishes a link between the schedule table and the bus stop table.
Because of these relationships, detailed route and stop information can be derived through the schedule table. Even if the schedule table does not physically contain detailed information concerning routes and stops, information in the bus stop table and the bus route table can be located and used by following the links between the tables. Therefore, after WBIS's calculation in the schedule table, other detailed user information can readily be derived from the bus route and stop tables.
4.3 Relationship between Geographic Data and CU-MTD Schedule DatabaseTo utilize the geographic data and the CU-MTD schedule database, WBIS must establish a link between the two. Because the common item between the data is the "stop-id", it is used as the identifier. As a result, bus schedule information related to a specific bus stop, located by WBIS in the bus stop map, can be derived from CU-MTD’s Schedule database through the stop-id. For example, assuming that the stop-id of a bus stop found in the map is "FIGR", searching for the stop-id, "FIGR", can then derive the stop’s schedule information from the database (Figure 5).
Figure 5. Example of Relationship between Bus Stop Map and Schedule Database
With the above mentioned methodology and data, WBIS was developed as two parts. The first was the user-interface. The second was the map server applications.
In the user-interface, or web pages, there are four parts: setting the user's preference, inputting the user's desired origin and destination, verifying the input, and displaying the results. In the map server applications, three types of applications exist: generating web pages depending on the user's preference, locating the desired origin and destination, and finding the shortest path.
Figure 6. Detailed Structure of Web-based Bus Information System
The step by step procedure, in Figure 6, outlines the communication taking place between these various parts. First, according to the set user preferences the application generates the subsequent pages, for selecting the origin and destination points. From these pages, the user's origin and destination data flow into the application for locating the points and their respective bus stops. Once it finds the origin and destination, and bus stops, the application generates the web page which display these points for verification. If all is in order, the application calculates the shortest path and the result is displayed to users via the final web page.
By providing WBIS on the web the user interface has numerous advantages, including the use of various media (i.e. images and text), the capability to collect information through the Internet (remotely), to provide interactive capabilities, and to be available to a large group of users.
Because the WBIS interface is a method of communicating with the public through web pages, we tried to develop an efficient interface that would simulate the interaction users get from using the telephone service provided by CU-MTD. Naturally, this interaction is less personalized, but WBIS utilizes the above mentioned advantages of a web page to create a user friendly, easy to use, and understandable interface for users.
Following is a brief discussion of the graphical interface per the system procedures.
Step 1: Setting Time and Selection Method (Figure 7)
Figure 7. Step 1: Setting Time and Selection Method
Step one is the core of WBIS and establishes how the system will proceed. In this step, the user is asked to provide travel information including the time (hour, minute, and AM or PM) his/her trip will begin and what day of the week (Weekday, Saturday, or Sunday) the trip will take place. The travel information is established in this fashion due to the structure of CU-MTD’s schedule system. In addition, the user establishes the selection method (by address, landmark, intersection, or point-and-click) that will be used to select his/her desired origin and destination.
The page is set up as two columns. On the left, the user enters the needed travel information and sets the selection methods to be used in subsequent steps. The right column provides the user with useful information including instructions for entering information, examples and other helpful notes.
When all information is provided, buttons at the bottom of the page allow the user to either continue to the next step or to reset the current page to clear all fields and allow the user to reenter the travel time and day and reset desired the selection methods.
Step 2: Selecting Your Starting Point (Figure 8)
Step two allows the user to select his/her desired starting point per the set selection method requested in step one. Depending on the selection method set by the user, the page will vary to accommodate the information needed. Note: Selection methods will be discussed later in this paper.
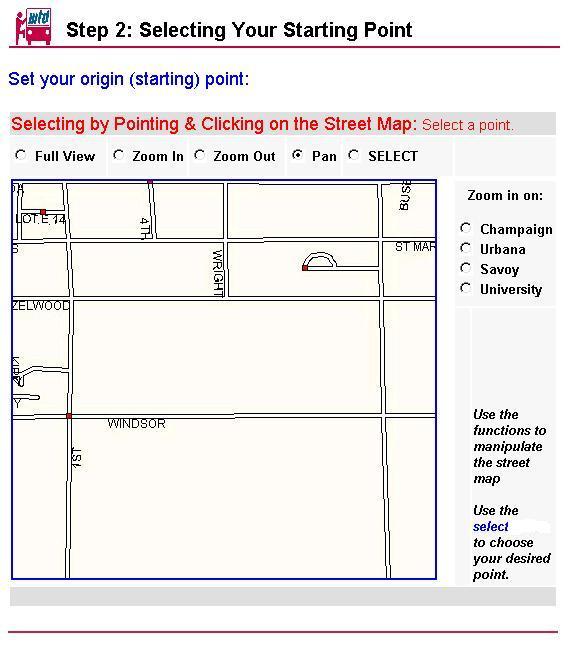
Figure 8. Step 2: Selecting Your Starting Point with point-and-click method
Step 3: Selecting Your Destination Point
Step three allows the user to select his/her desired destination point per the set selection method requested in step one. Depending on the selection method set by the user the page will vary to accommodate the information needed. Note: Selection methods will be discussed later in this paper.
Step 4: Verifying Your Selection (Figure 9)
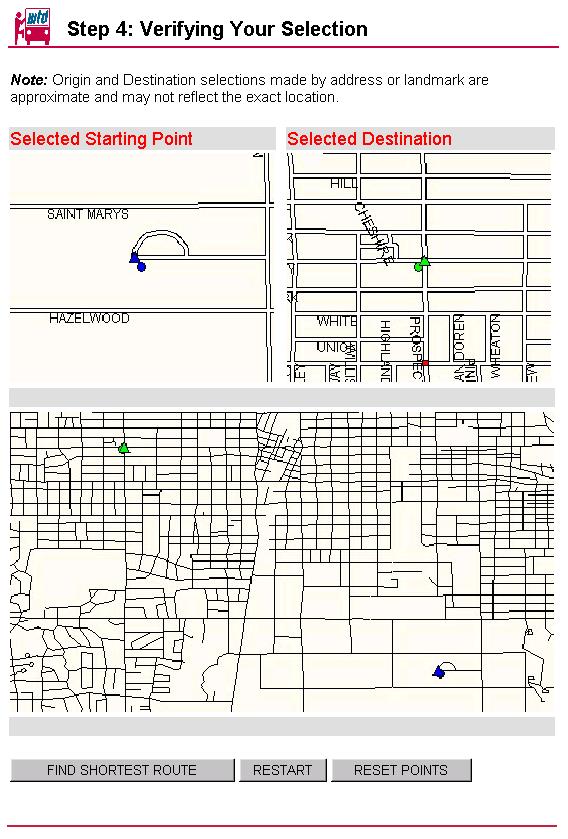
Figure 9. Step 4: Verifying your Selection
Step four allows the user to view his/her selected origin and destination points. Three maps are provided. The first two show the origin and destination points respectively with points designating the closest bus stop to the desired origin and destination. The third map is of a larger size and shows both, the origin and destination points, in relation to one another. Like the two individual maps, this map also provides the user with the nearest bus stops to the selected origin and destination points. In addition, a legend will assist the user in understanding the map.
Buttons at the bottom of this page allow the user to continue to find the shortest route, to restart the system at step one, or to reset their selected points at step two using the same selection methods from the their previous trial.
Step 5: Results (Figure 10)
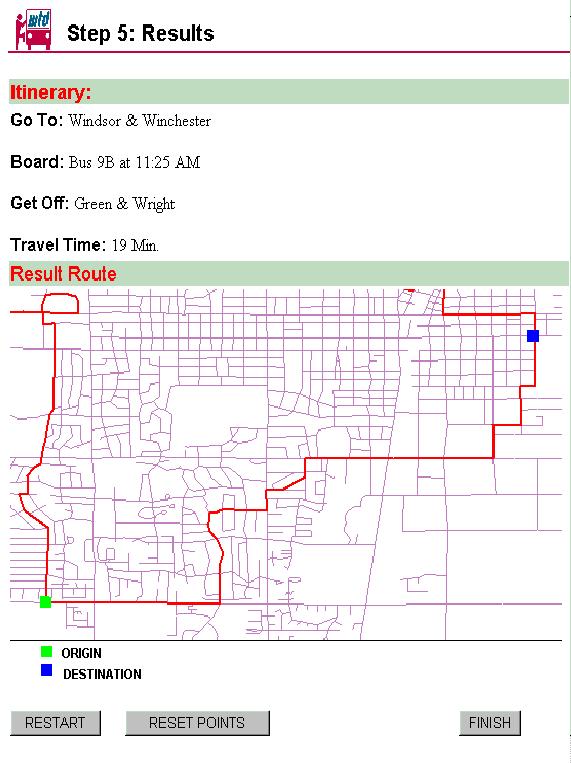
Figure 10. Step 5: Results
Step five provides the user with the query results. This page consists of two parts. The first is an itinerary, which includes information on where the user must go to catch the bus, which bus the user will board, when that bus will leave the time point before traveling to the designated boarding point, where the user should get off the bus, and approximately how long the trip will take. If a transfer is required, the itinerary will include additional travel information like that above to get the user to their desired destination. The second part of the results page is a map similar to the large map provided in step four. However, in addition to the origin and destination points and the respective bus stops the map will outline the route the bus will travel and provide any transfer points needed. A legend will also be provided to assist the user in understanding the map.
Buttons at the bottom of this page will allow the user to restart the system taking them back to step one, reset their selected points, using the same selection methods from the their previous trial, taking them back to step two or exit the system taking them back to the CU-MTD web page.
Selection Methods
For all the selection methods, the interface is generally set up as two columns. On the left the user enters or selects the desired origin or destination point to be used in subsequent steps. The right column provides the user with useful information including instructions for entering information or making a selection, examples and other helpful notes.
Address (Figure 11)
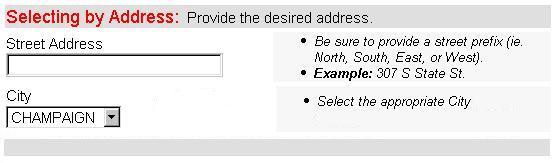
Figure 11. Selection Method – By Address
When selecting an origin or destination point by entering an address, the interface provided requires the user to enter address information into specified text boxes including street address and city. Because of some of the problems discussed earlier in the paper, for street address the user must enter the lot number, street prefix (North, South, East, or West), and street name. A street suffix is not required. In addition, the user must designate which city the address is located. Again due to the problems encountered from the geocoding of the base network map, a zip code is not required. This method then address-matches the desired address onto the base network.
Landmark (Figure 12)
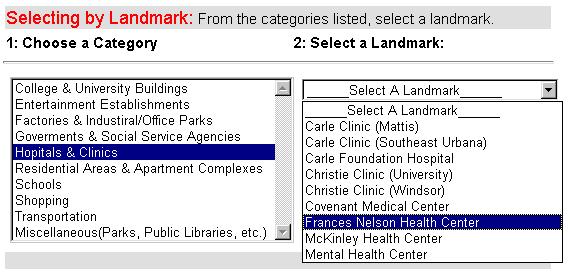
Figure 12. Selection Method – By Landmark
When making an origin or destination designation by selecting a landmark, the user needs to first choose the category in which the desired landmark may lie. When a category is selected, another list will open with the respective landmarks. This selection method then finds the desired landmark on the landmark map.
Intersection (Figure 13)
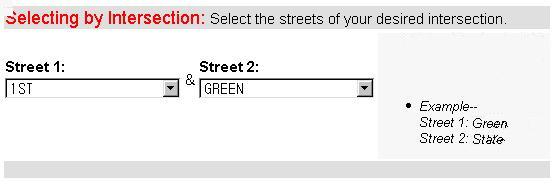
Figure 13. Selection Method – By Intersection
To make an origin or destination selection by choosing an intersection in the Champaign-Urbana area the user must select the names of both streets that make-up the intersection. The interface provides two list boxes from which the user selects Street 1 and Street 2. This selection method then finds the desired intersection on the base network map.
Point-and-click
When designating the desired origin or destination point by using the click-and-point method the user is provided with a full Champaign-Urbana area map. This interface includes the map and functions to manipulate the map. These functions include full view, zoom in, zoom out, pan, zoom in on Champaign, Urbana, Savoy, or University, and select. When the select function is chosen the system will automatically continue to the next step when the user selects a point on the map with the mouse (Figure 8).
A crucial part of WBIS is the algorithm for finding the shortest path. In the initial stages of the project, we used a common algorithm provided by NetEngine 1.1, which is a programming library for network analysis (Esri 1998b). However, problems arose with the existing algorithm. First, the existing algorithm was designed for a fixed transportation network. The bus route network of CU-MTD, however, varies from daytime to evening, and from weekdays to weekends. Second, on the occasion when multiple routes were needed to reach the desired destination, the lag time for the routes were not always constant, making it difficult to use them in the existing algorithm. Because of these problems, we developed a new algorithm, by combining the schedule data, extracted from the CU-MTD schedule database, with the network data from the entire bus route network.
The goal of the algorithm’s goal is to find the travel itinerary with shortest travel time. The algorithm searches for the destination stop throughout the schedule database based on the origin stop and starting time. The following steps provide a description of the process used by the algorithm (Figure 14):
Figure 14. Algorithm for Finding Shortest Path
The WBIS project started by developing a user-friendly Bus Information System (BIS) in a local machine, not on the WWW, using NetEngine 1.1 and MapObjects 1.2. However, we found problems with the algorithm, and questioned the accessibility of the local version of BIS. We developed a new algorithm and considered using the World Wide Web to maximize accessibility.
With the new algorithm, however, the struggle turned from problems with the methodology to obstacles with the data preparation. As the project progressed, we spent a great deal of time correcting inaccurate data.
We submit the future research issues as followings:
Moreover, standardization of the CU-MTD schedule database would have been helpful, for this project. Because the initial function of the database did not include use in GIS, it continues to be difficult to integrate the geographic data with the schedule data. Consequently, modifications to the structure of the schedule database are needed.
Environmental Systems Research Institute, 1996, "MapObjects: Building Applications with MapObjects", Redlands, CA: Esri Inc.
Environmental Systems Research Institute, 1998a, "MapObjects Internet Map Server: Using MapObjects on the Internet", Redlands, CA: Esri Inc.
Environmental Systems Research Institute, 1998b, "NetEngine: Programmer’s Guide", Redlands, CA: Esri Inc.